13 min read
This report analyzes the IPv4 transfer market for Q2 2023, based on completed IPv4Center marketplace transactions and official RIR transfer records.
Executive Summary
The IPv4 transfer market cooled meaningfully in Q2 2023. Across 108 recorded transactions covering 169,728 addresses, total market value reached $6.54 million at a weighted average of $38.51 per IP — down 11.6% from Q1 2023's average. Transaction count declined 3.6% quarter-over-quarter, but the real story is deal size compression: the average deal dropped to $60,602 from $266,475 in Q1, signaling a shift toward smaller, retail-oriented trades. The median price of $38 sat close to the mean, suggesting a relatively symmetric distribution without extreme outlier distortion.Market Overview
| Transactions | 108 |
| IP Addresses Traded | 169,728 |
| Estimated Market Value | $6,544,968 |
| Average Price / IP | $38.51 |
| Median Price / IP | $38.00 |
| RIR Transfers | 2,385 |
Price Dynamics
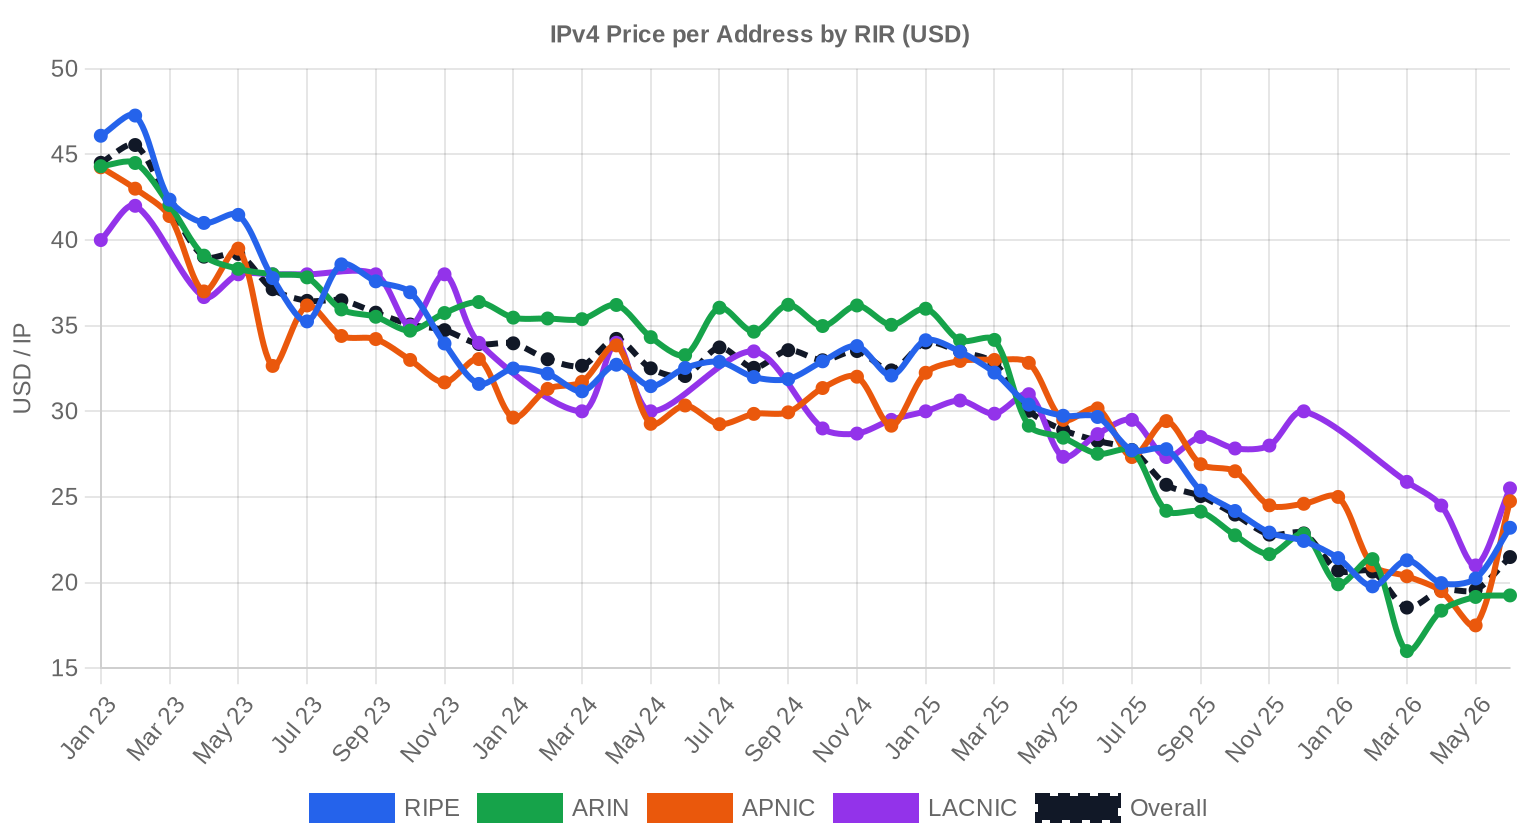
Prices ranged from $30 to $52 per IP this quarter, a $22 spread that reflects persistent quality and size premiums. The 11.6% decline from Q1 didn't arrive as a single shock — it was a gradual repricing as buyers resisted paying above $40 for standard ARIN blocks while RIPE inventory held firmer. The regression trend points down, with the quarterly change clocking in at -0.14%. Smaller blocks are still commanding higher per-IP pricing, but the floor on large lots has softened. Buyers with patience are finding better entry points than they've seen in over a year.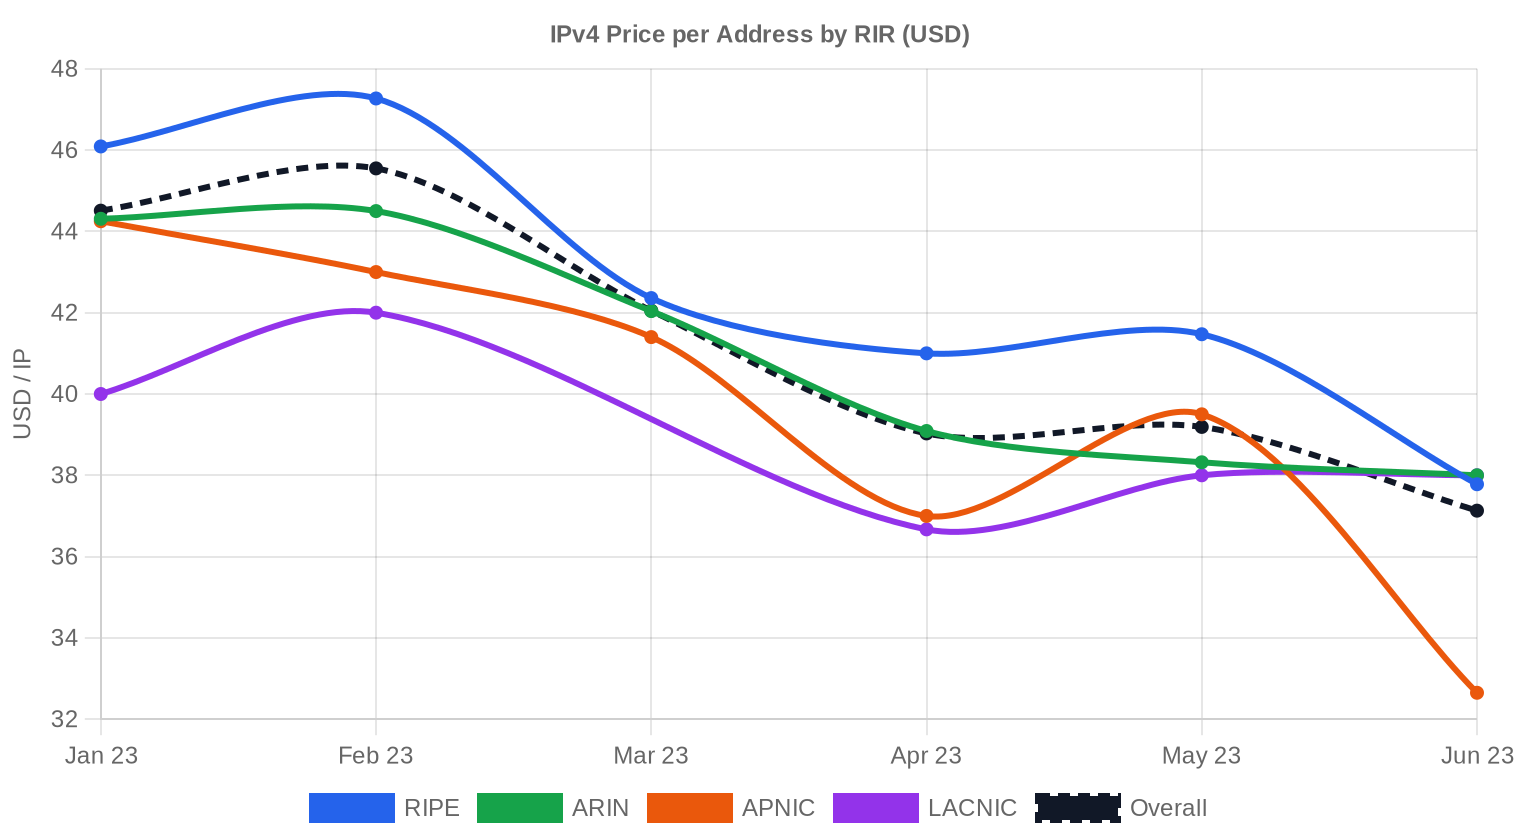
Pricing by RIR
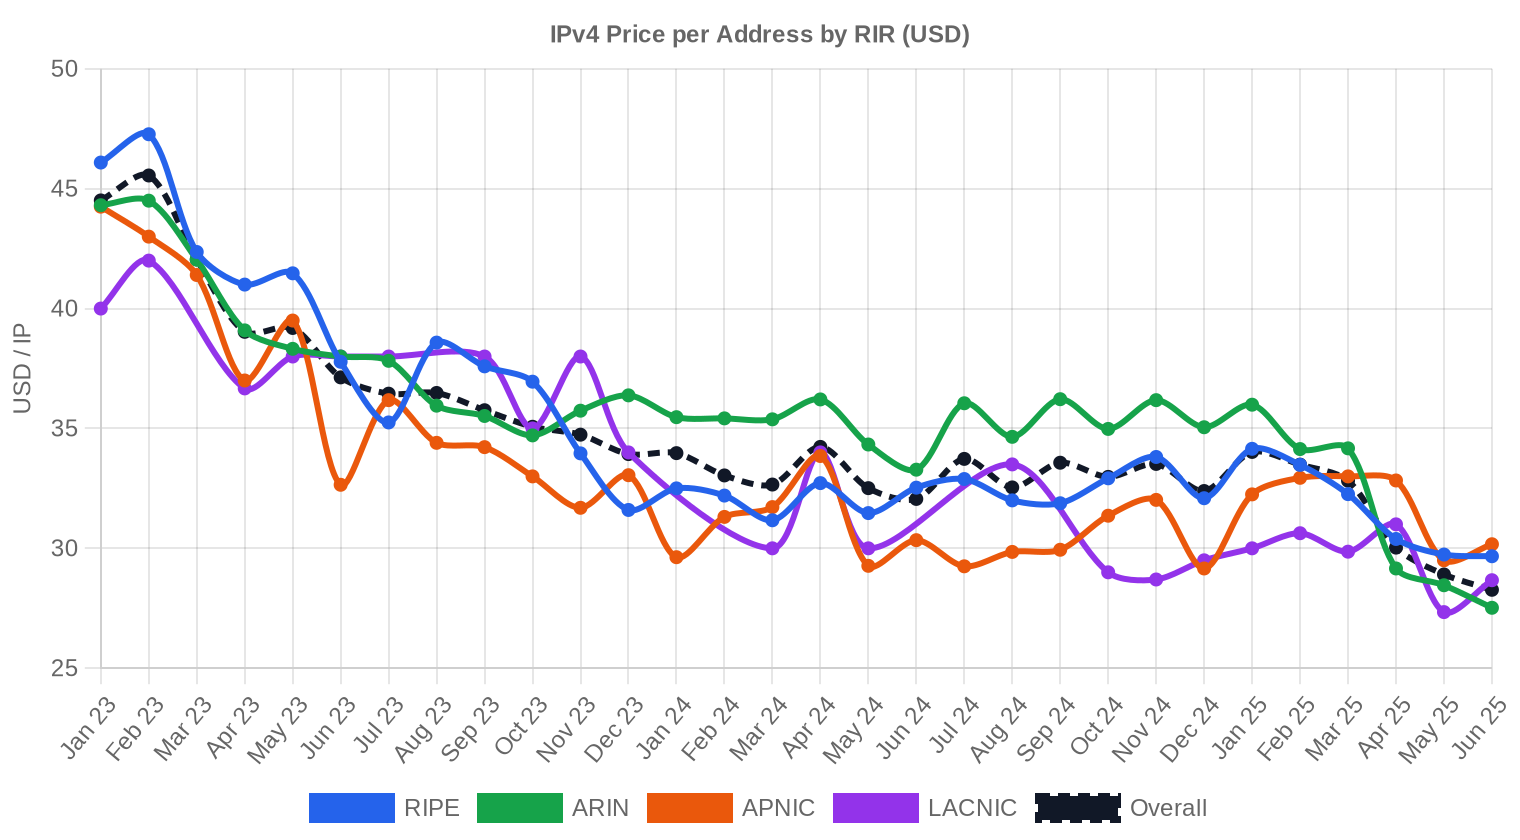
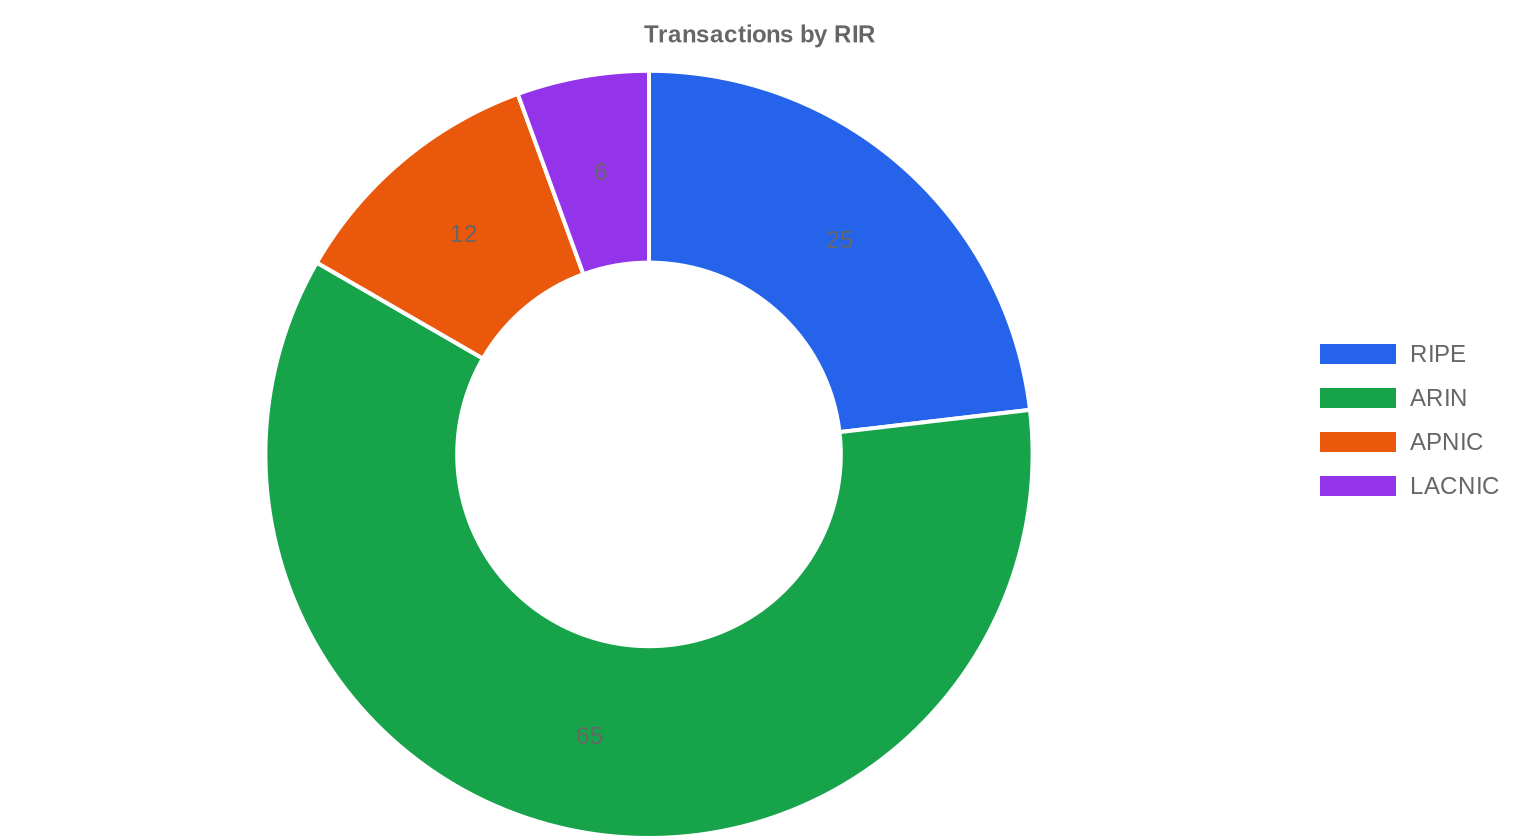
RIPE continues to command the market premium at $40.03 per IP, a $1.54 spread over ARIN's $38.49 average. APNIC blocks came cheapest at $36.02, though on thin volume. LACNIC printed a tight cluster between $36 and $38 on just 6 deals, likely reflecting a few bulk transactions from Latin American legacy holders.ARIN: $38.49/IP across 65 transactions (46.1% of IP volume). The backbone of market activity, with the widest price range ($30–$48.59). Median at $38.
RIPE: $40.03/IP across 25 transactions (28.2% of IP volume). Premium intact. Floor at $34.18, ceiling at $52 — the quarter's highest print.
APNIC: $36.02/IP across 12 transactions (3.9% of IP volume). Thinner liquidity keeps pricing soft. Median $35.50.
LACNIC: $37.33/IP across 6 transactions (21.7% of IP volume). Tight bid-ask with a $2 range. Bulk-weighted.
AFRINIC: Zero recorded transactions. Ongoing governance issues continue to freeze this registry's transfer market.
| RIR | Transactions | Avg $/IP | Median $/IP | IPs Traded | RIR Transfers | Next Month (proj.) | Year-End (proj.) |
|---|---|---|---|---|---|---|---|
| RIPE | 25 | $40.03 | $39.00 | 47,872 | 1,345 | $36.00 | $35.00 |
| ARIN | 65 | $38.49 | $38.00 | 78,336 | 1,040 | $37.00 | $37.00 |
| APNIC | 12 | $36.02 | $35.50 | 6,656 | 0 | $32.00 | $33.00 |
| LACNIC | 6 | $37.33 | $37.50 | 36,864 | 0 | $37.50 | $37.00 |
Transaction Volume
Supply & Block Sizes
/24 blocks dominated activity with 51 transactions — nearly half the quarter's deal count. This tracks with persistent demand from small-to-mid-tier hosting providers, enterprise IT shops, and regional ISPs that need a single usable block rather than large contiguous space. The heavy skew toward sub-/20 blocks explains much of the average deal size compression from Q1.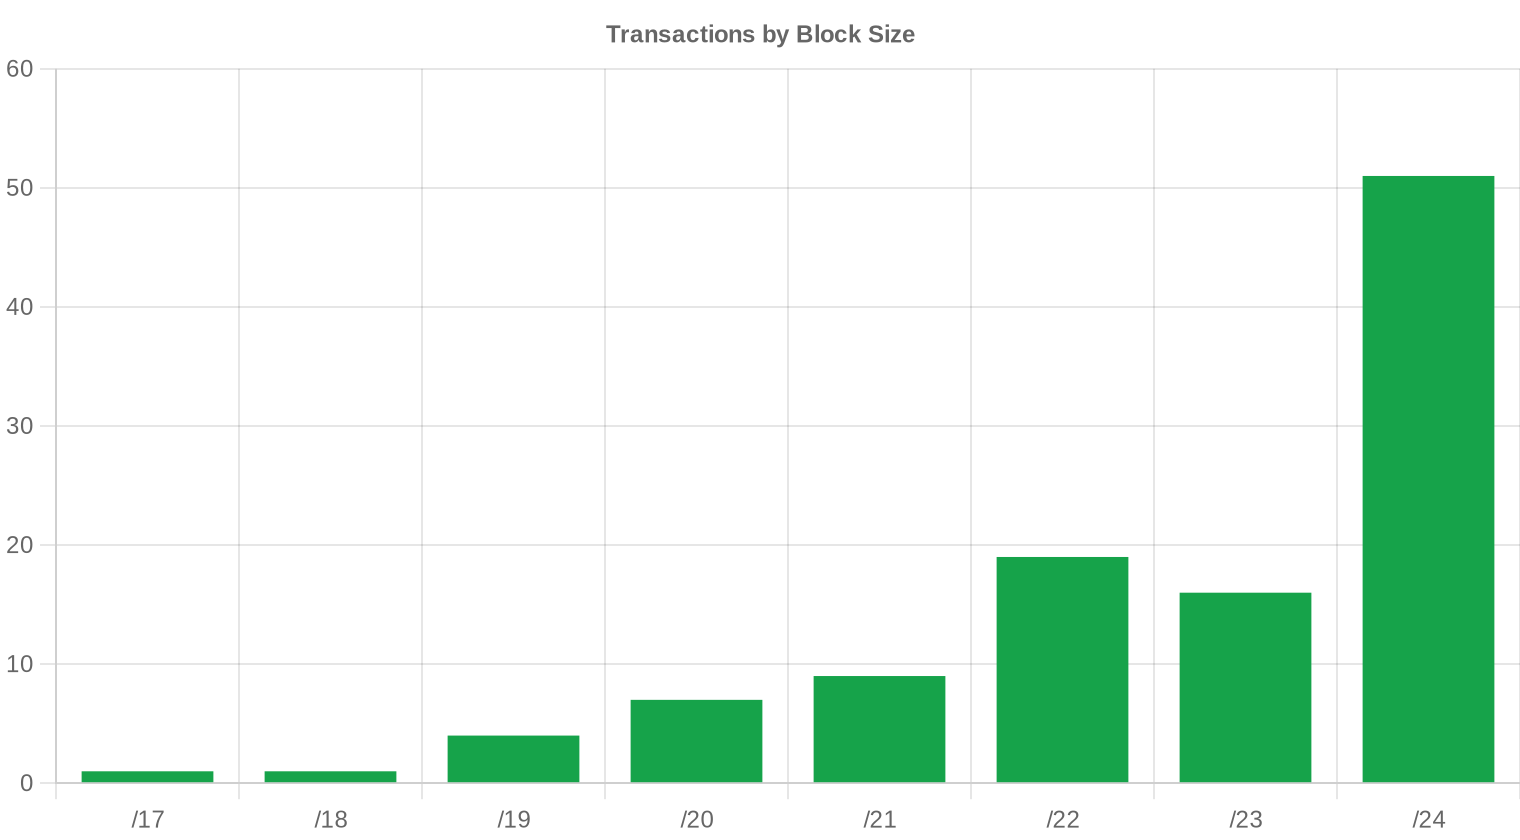
Geographic Activity
Country-level granularity is limited this quarter, but the RIR distribution tells the geographic story. ARIN's 60.2% share of transactions means North American buyers and sellers drove the market. RIPE's 25 deals kept European activity steady, while APNIC's 12 trades suggest continued but muted Asia-Pacific participation. Latin America contributed meaningfully to IP volume through a handful of large LACNIC deals.Registry Transfer Activity
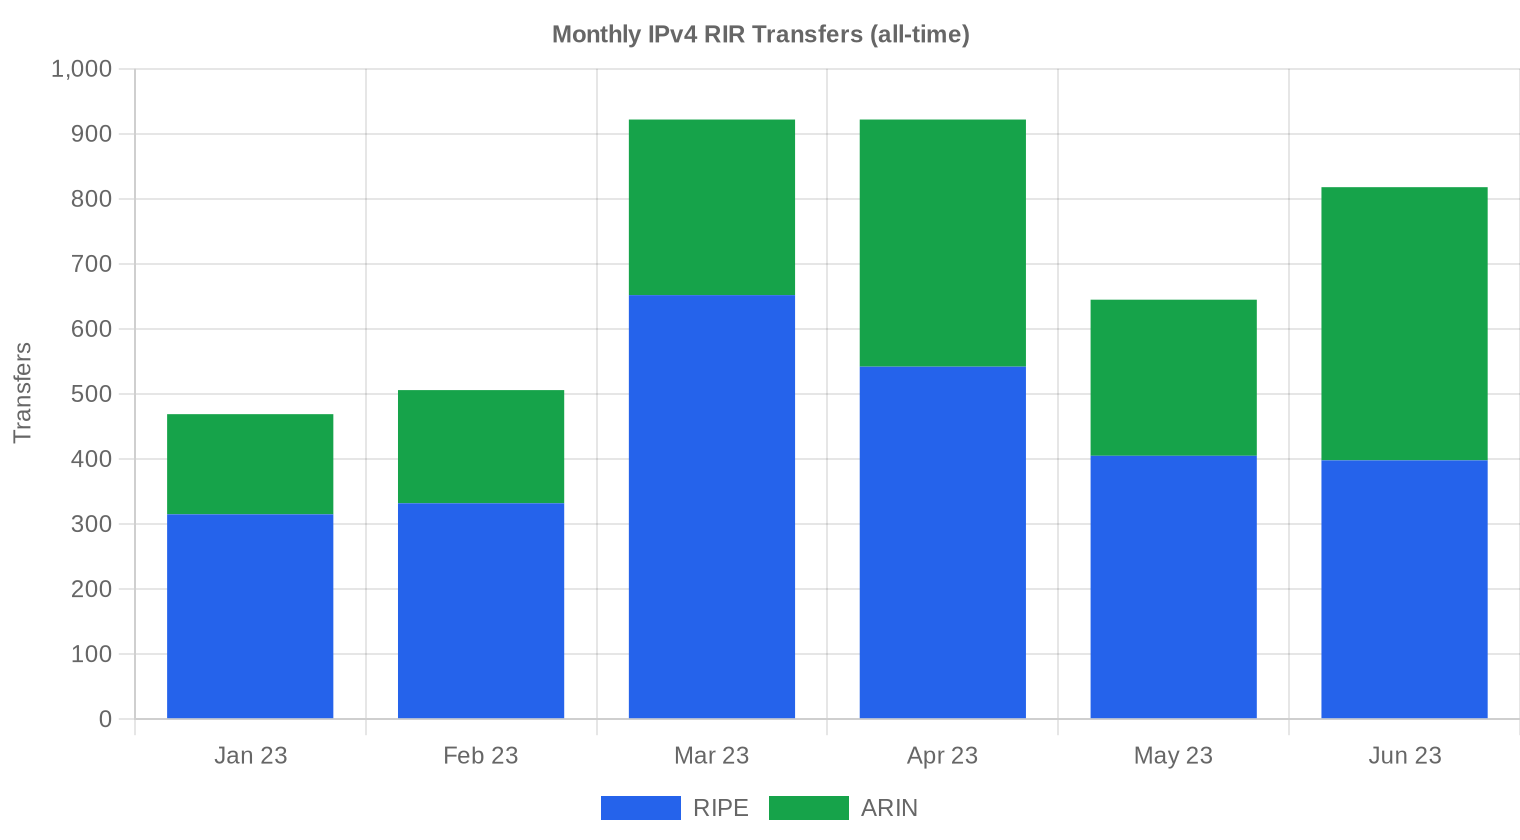
Total RIR-recorded transfers hit 2,385 in Q2 2023. RIPE led with 1,345 transfers — 56.4% of the total — despite representing only 23% of priced transactions in our dataset. ARIN logged 1,040 transfers. The gap between recorded transfers and priced market deals reflects the large volume of intra-organization and policy-driven transfers that don't carry a market price.Long-Run Transfer Trends
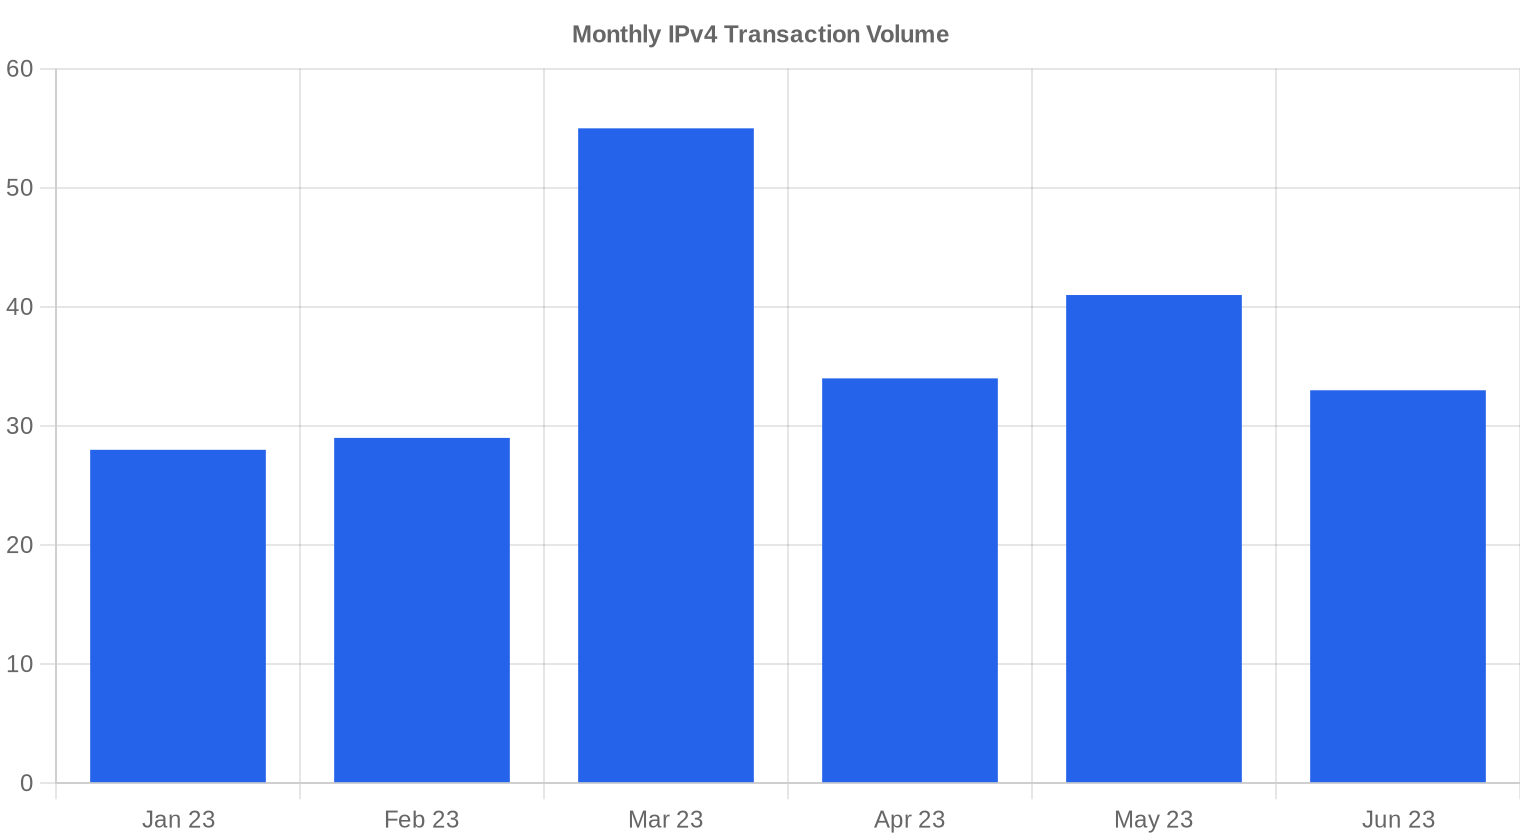
Over the trailing six months, 4,282 total transfers were recorded across all registries. March 2023 was the peak month, likely reflecting year-end budget deployments that closed in early Q1. RIPE accounted for 61.7% of the six-month transfer total versus ARIN's 38.3% — a ratio that has held remarkably stable and reflects RIPE's more active intra-registry transfer ecosystem.| RIR | RIR Transfers |
|---|---|
| RIPE | 2,644 |
| ARIN | 1,638 |
| RIR Transfers | 4,282 |
Outlook & Forecast
Forecasting each block-size band and RIR separately with our AI model:
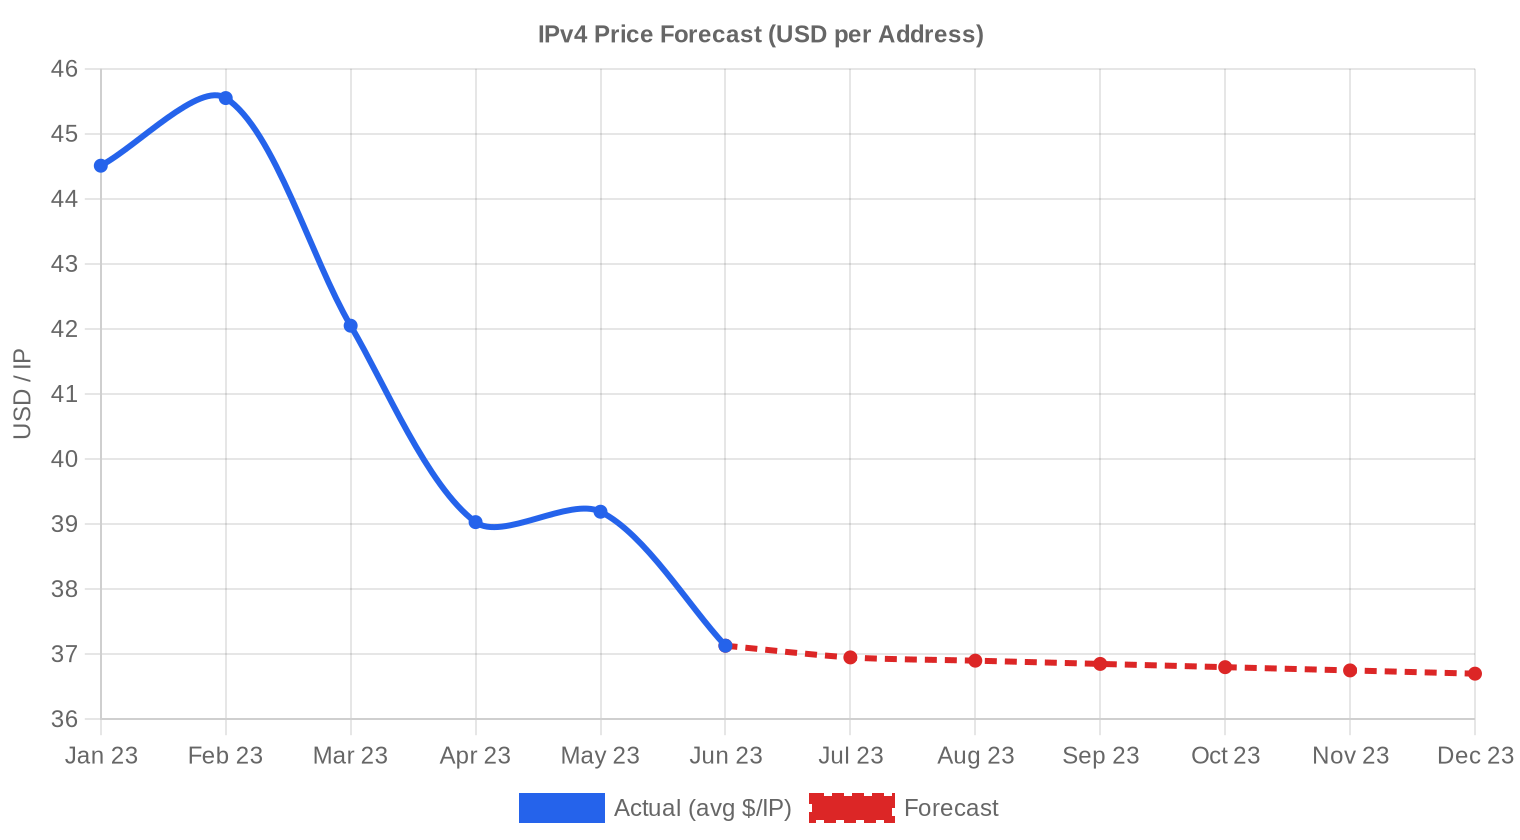
The overall average price per IP is projected to reach $36.70 by December 2023, with a next-month estimate of $36.77 per IP.
- RIPE: projected at $36.00 per IP next month, trending toward $35.00 by December 2023.
- ARIN: projected at $37.00 per IP next month, trending toward $37.00 by December 2023.
- APNIC: projected at $32.00 per IP next month, trending toward $33.00 by December 2023.
- LACNIC: projected at $37.50 per IP next month, trending toward $37.00 by December 2023.
- AFRINIC: insufficient data for a reliable forecast.
Forecast by Block Size
| Block | Current $/IP | Next Month | Year-End | Confidence |
|---|---|---|---|---|
| /24 | $37.00 | $36.50 (-1.4%) | $36.00 (-2.7%) | medium |
| /23 | $38.75 | $38.00 (-1.9%) | $37.00 (-4.5%) | medium |
| /22 | $30.24 | $32.00 (+5.8%) | $34.00 (+12.4%) | low |
| /21 | $45.00 | $44.00 (-2.2%) | $42.00 (-6.7%) | low |
| /20 | $38.50 | $38.00 (-1.3%) | $39.00 (+1.3%) | medium |
| /19 | $37.50 | $37.00 (-1.3%) | $38.00 (+1.3%) | low |
| /18-/16 | $38.50 | $38.00 (-1.3%) | $39.00 (+1.3%) | low |
| /15-up | $51.50 | $50.00 (-2.9%) | $52.00 (+1.0%) | low |
Editor's Take: Buy vs. Lease
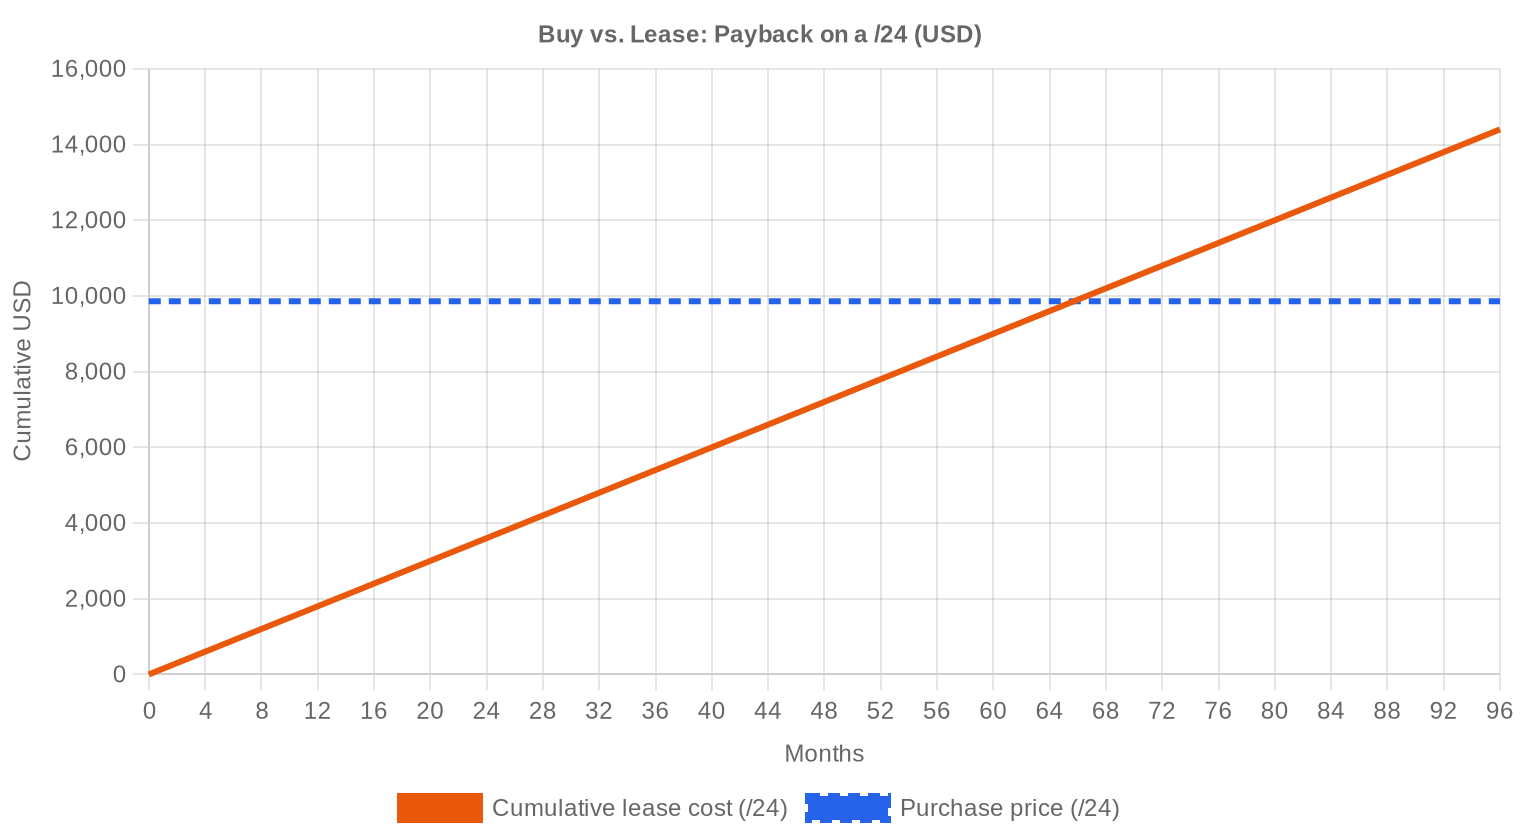
The buy-versus-lease math is straightforward this quarter. At $38.51 per IP on the buy side and $0.59 per IP monthly on the lease side, a purchased block pays for itself in 65.7 months — roughly 5.5 years. The implied annual yield for a lessor sits at 18.3%, which is exceptional by any asset-class standard. For organizations with a planning horizon beyond six years, buying remains the clear economic choice. For shorter deployments or uncertain capacity needs, leasing provides flexibility at a manageable premium. The critical variable is hold period: if you're reasonably certain you'll need the addresses for five-plus years, the amortization favors outright purchase at today's prices. With prices trending toward $36.70 by December, buyers who can wait a quarter may extract another 4-5% discount.| /24 Purchase price | $9,859 |
| /24 Lease price | $150 / mo |
| Payback period | 65.7 mo (5.5 yr) |
| Gross annual yield | 18.3% |
What This Means for You
Buyers: This is a favorable entry window. The 11.6% Q1-to-Q2 decline hasn't exhausted itself — models point to another $1.80 drop by year-end. If your procurement timeline allows, phasing purchases over Q3 could save 3-5% per IP. /24 blocks remain the most liquid and easiest to source.Sellers: The bid is weakening. If you're holding clean ARIN or RIPE blocks and debating timing, the trend is not your friend. Each quarter of delay could cost $1-2 per IP on realized proceeds. List now and price to move.
Leaseholders: At $0.59 per IP monthly, leasing remains viable for sub-five-year use cases. Renewal risk is real — lease rates haven't fallen as fast as purchase prices, so lessors are capturing an increasing share of the spread.
Block holders (non-users): An 18.3% annual yield on leased-out space is hard to beat in the current rate environment. If you own blocks you're not using, leasing them generates returns well above investment-grade bonds or most REIT yields.
Browse verified IPv4 blocksSell IPv4 →
List your blocks with managed transferLease IPv4 →
Flexible short-term capacityLease Out IPv4 →
Turn idle blocks into recurring revenue
IPv4 Pricing by Block Size
The /24 segment — 256 addresses — remains the market's most actively traded unit at 51 deals this quarter. Per-IP premiums on /24s run 10-20% above pricing on /20 and larger blocks, a persistent small-lot surcharge driven by the sheer number of buyers who need exactly one broadcast-capable block. Larger lots (/16 and above) trade at discounts but require patient buyers with deeper pockets and specific routing needs.| Block | IPs | Buy: /IP | Buy: Total | Lease: /IP/mo | Lease: Monthly |
|---|---|---|---|---|---|
| /24 | 256 | $35–45 | $8,960–11,520 | $0.38–0.50 | $97–128 |
| /22 | 1,024 | $28–38 | $28,672–38,912 | $0.33–0.45 | $338–461 |
| /20 | 4,096 | $22–32 | $90,112–131,072 | $0.30–0.40 | $1,229–1,638 |
| /18 | 16,384 | $20–30 | $327,680–491,520 | $0.30–0.38 | $4,915–6,226 |
| /16 | 65,536 | $18–28 | $1,179,648–1,835,008 | $0.30–0.35 | $19,661–22,938 |
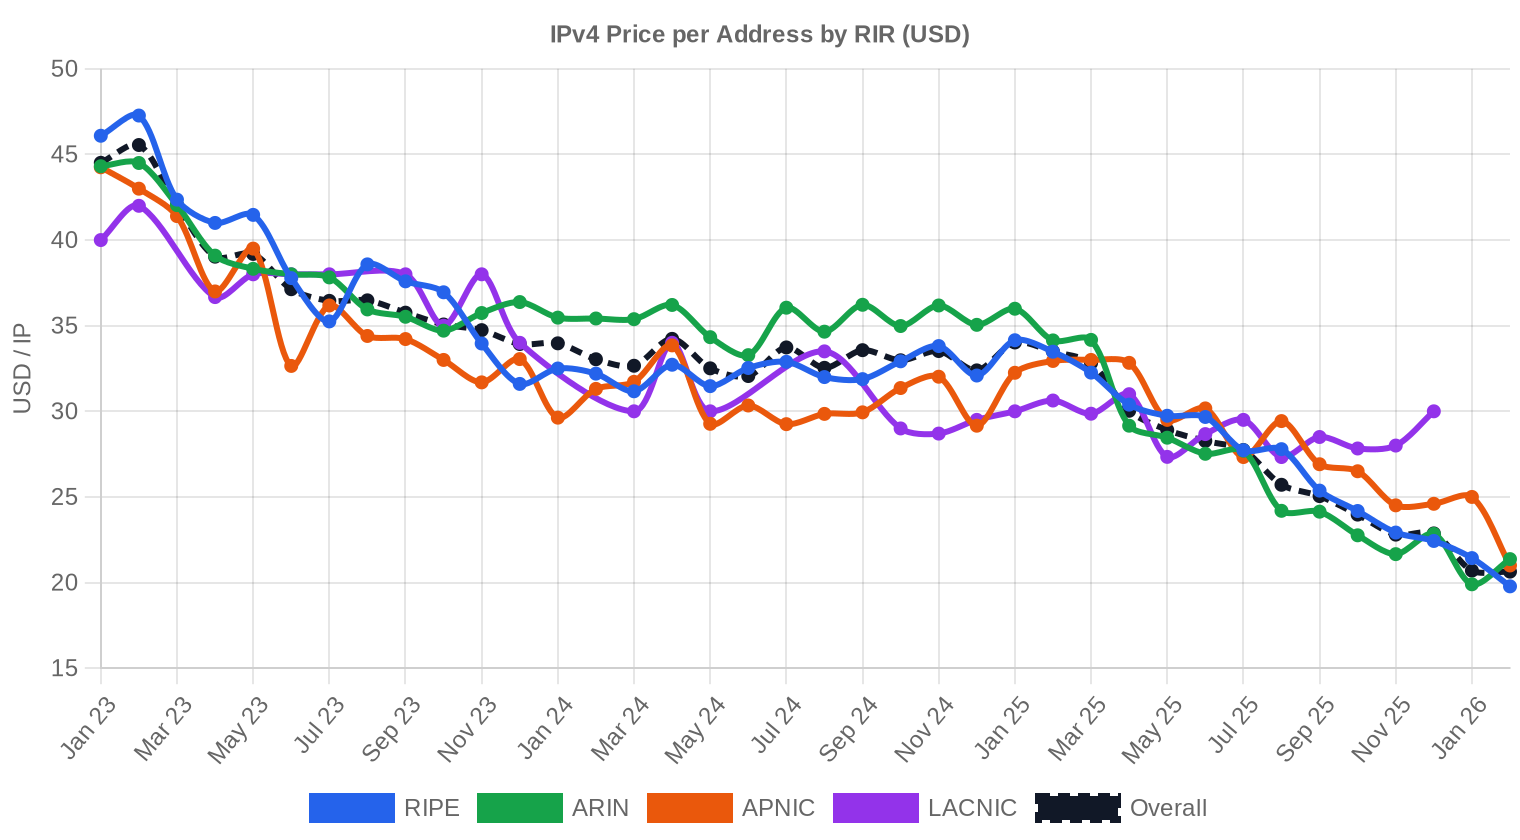
IPv4 Price History: 2011–2026
IPv4 pricing emerged as a market phenomenon after IANA exhausted its free pool in February 2011. Early trades in 2011-2014 ranged from $5 to $12 per IP. The market ratcheted steadily upward, breaching $20 by 2018 and hitting $50+ peaks in late 2021 during the pandemic-era infrastructure boom. AWS's February 2024 decision to charge $0.005/hour for public IPv4 addresses (announced mid-2023) began reshaping expectations even before it took effect, contributing to the softening we see now. The current $38.51 average represents a retracement of roughly 25% from peak levels.| Year | ~Price/IP | Key Event |
|---|---|---|
| 2011 | $7–12 | IANA free pool exhausted; Microsoft/Nortel deal ($11.25/IP) |
| 2012 | $8–12 | RIPE NCC reaches last /8; begins /22-only allocation |
| 2014 | $10–15 | LACNIC free pool exhausted |
| 2015 | $8–15 | ARIN free pool exhausted |
| 2017–18 | $12–18 | Leasing market grows; cloud demand rises |
| 2019 | $18–24 | RIPE NCC exhausts remaining free pool |
| 2021–22 | $50–60+ | Post-pandemic peak; hyperscaler build-outs |
| 2024 | $35–52 | AWS IPv4 charge ($0.005/IP/hr); large block correction |
| 2025–26 | $18–45 | Market bifurcation; /16s below $20 for first time since 2019 |
Market Structure: Who Is Buying & Selling
Buy-side activity in Q2 skewed heavily toward small and mid-size operators — the 86 deals under $50K tell that story clearly. Cloud providers and larger ISPs are still active but increasingly price-sensitive, willing to wait rather than chase. On the sell side, legacy holders and companies rationalizing their IP assets post-M&A continue to supply the market, with a steady trickle from bankruptcy-related dispositions.IPv4 vs. Other Asset Classes
At an 18.3% implied annual yield from leasing, IPv4 addresses outperform most traditional asset classes in the current environment. Ten-year Treasuries offered roughly 3.8% in Q2 2023; US REITs yielded 4-5%; the S&P 500 dividend yield sat near 1.5%. The obvious caveats are illiquidity, limited price discovery, and technology obsolescence risk — but for a niche digital asset, the risk-adjusted return profile remains compelling, particularly for holders with clean, transferable blocks.| Asset Class | Typical Yield | Liquidity | Primary Risk |
|---|---|---|---|
| IPv4 | 18.3% | Moderate | IPv6 adoption, block quality |
| Commercial Real Estate | 5–8% | Low | Vacancy, rate cycle |
| Investment-Grade Bonds | 4–5% | High | Duration, credit risk |
| S&P 500 | ~1,3% | High | Market volatility |
| Money Market / T-Bills | ~4–5% | High | Rate cycle changes |
IPv6 Adoption & Why IPv4 Remains Essential
Google's IPv6 adoption metrics hovered around 40% of traffic in Q2 2023, a figure that has been climbing at roughly 3-4 percentage points per year. That pace implies another decade before IPv6 reaches functional ubiquity — and even then, dual-stack requirements will keep legacy IPv4 infrastructure essential. The transition is happening; it's just happening slowly enough that IPv4 retains substantial economic value for the foreseeable future.AI & Cloud Infrastructure Demand
Large-scale AI training clusters and inference deployments are driving incremental IPv4 demand, though quantifying the exact volume remains difficult. What's clear is that every new GPU cluster needs network connectivity, and many AI infrastructure buildouts are happening in colocation environments that lack native IPv6 support. As generative AI capex surges — estimated at $50B+ industry-wide in 2023 — the downstream pull on IP address inventory is real, even if it represents a single-digit share of total market demand.What Determines IPv4 Block Value
Not all /24s are created equal. Clean blocks — free of blacklist entries, with no spam or abuse history — command premiums of 5-15% over blocks with reputational baggage. Allocation age matters less than it used to, but blocks with long, clean WHOIS histories still trade more quickly. RIR origin affects transferability: RIPE and ARIN blocks move fastest, APNIC blocks require more diligence, and AFRINIC blocks are essentially frozen.Sell vs. Lease: A Decision Framework
In a declining price environment, the sell-versus-lease decision hinges on your outlook. If you believe prices will stabilize around $36-37 (as our models suggest), leasing at $0.59/IP/month generates an 18.3% annual return on an asset worth $38.51 — hard to beat by selling. But if you expect further declines beyond year-end, taking the exit now locks in current value. Holders with clean, RIPE-origin blocks have the most flexibility given that registry's active lease market.| /24 Purchase price | $9,859 |
| /24 Lease price | $150 / mo |
| Payback period | 65.7 mo (5.5 yr) |
| Gross annual yield | 18.3% |
RIPE NCC 24-Month Transfer Restriction
RIPE NCC's 24-month holding requirement before inter-RIR transfer remains the single most influential policy constraint on supply. Blocks acquired within the RIPE region cannot be moved to ARIN or APNIC buyers for two years, creating a captive supply pool that supports the $40+ pricing premium. For buyers, it means RIPE blocks purchased today carry an implicit lockup — plan accordingly if flexibility is part of your procurement calculus.Deal Size Distribution
The quarter's deal distribution skewed overwhelmingly small: 86 of 108 transactions (79.6%) fell below $50K, accounting for $1.57M in aggregate value. The $50K–$250K band captured 16 deals worth $1.81M, while only 5 deals cleared the $250K–$1M threshold ($1.89M total). A single transaction exceeded $1M at $1.26M. Average deal size collapsed to $60,602 from $266,475 in Q1 — a 77% drop that underscores the absence of jumbo block trades this quarter.Top Trading Countries
Country-level data is sparse for Q2 2023, but RIR shares serve as a proxy. North America (ARIN, 60.2% of deals) remains the primary market, followed by Europe (RIPE, 23.1%). Asia-Pacific activity through APNIC was modest at 12 deals, and Latin America contributed 6 LACNIC transactions. The North American dominance reflects both the depth of legacy IPv4 holdings and the concentration of cloud and hosting demand in the US.BEAD Broadband Program Impact
The $42.45 billion BEAD (Broadband Equity, Access, and Deployment) program is beginning to shape procurement planning among regional ISPs and fixed wireless providers. As NTIA funding letters went out in mid-2023, applicants started scoping their IP address needs — typically /20 to /18 blocks for greenfield broadband buildouts. The full demand impact won't materialize until 2024-2025 grant disbursements, but forward-looking buyers are already positioning, particularly in the ARIN region.Hyperscaler IPv4 Holdings
Amazon, Microsoft, and Google collectively hold an estimated 100M+ IPv4 addresses — enough to materially influence market dynamics if any significant portion were released. AWS's upcoming public IP charging (announced in July 2023, effective February 2024) is designed to push customers toward IPv6 and Elastic IPs, which could eventually free up addresses from underutilized allocations. Whether hyperscalers become net sellers remains speculative, but the mere possibility acts as a ceiling on long-term price expectations.Macroeconomic Conditions & Market Impact
The Fed held rates at 5.00-5.25% through Q2 2023, and the higher-rate environment is visibly compressing enterprise IT budgets. Companies are scrutinizing all infrastructure spend, including IP address procurement — which partly explains the shift toward smaller, cheaper deal sizes. Venture-backed startups, once aggressive buyers of address space for cloud deployments, are conserving cash. Until rate expectations shift meaningfully, expect continued price discipline from the buy side.Methodology
Figures are based on completed IPv4Center marketplace transactions and RIR transfer statistics. Prices are in US dollars per IP address. Forecasts are produced by an AI model that analyses each block-size band and RIR segment separately (with outlier-trimmed medians) alongside known market catalysts; they are estimates, not guarantees.
Source: IPv4Center.com market data and RIR transfer statistics.
This report is generated automatically for informational purposes only and does not constitute financial advice.
Frequently Asked Questions
What was the average price per IPv4 address in Q2 2023?
The market-wide average landed at .51 per address, with a median of . The spread between floor () and ceiling () was relatively tight at , suggesting a maturing, less volatile market.
How many IPv4 transactions closed in Q2 2023, and what was the total dollar volume?
We tracked 108 completed transactions covering 169,728 addresses for an aggregate value of approximately .54 million. The average deal size came in around ,600.
Which RIR region commanded the highest prices in Q2 2023?
RIPE space was the priciest at .03 per IP on average — a roughly 4% premium to ARIN's .49 and an 11% premium to APNIC's .02. European demand and tighter supply continue to support the RIPE premium.
Why is ARIN-region space still the most traded despite not being the most expensive?
ARIN accounted for 60.2% of transaction volume with 65 deals and 78,336 addresses moved. North American space benefits from deeper liquidity, a more standardized transfer process, and a broader buyer base — factors that drive volume even as per-IP pricing trails RIPE.
What happened with APNIC and LACNIC transfers this quarter?
APNIC contributed 12 deals (6,656 IPs) at an average of .02, while LACNIC recorded 6 transactions covering 36,864 IPs at .33. Both regions posted zero inter-RIR transfers in the period, indicating predominantly intra-region activity. AFRINIC recorded no transactions at all.
What does the -to- price range tell us about block size dynamics?
Smaller blocks — predominantly /24s, which accounted for 51 of 108 transactions — tend to cluster near the higher end of the range on a per-IP basis. Larger blocks in the LACNIC region, for instance, traded in a remarkably narrow – band. Size discount is real: the bigger the block, the lower the unit cost.
The /24 was the most commonly traded prefix. How dominant was it?
Extremely. The /24 represented 51 out of 108 transactions — just under 47% of all deals. This is consistent with small-to-mid-size enterprises and hosting providers acquiring minimum routable blocks for BGP announcements.
How did the deal-size distribution break down in Q2 2023?
The market was heavily skewed toward smaller transactions: 86 deals (80%) fell under K, totaling .57M. The 16 mid-market deals (K–0K) contributed .81M, while just 6 transactions above 0K accounted for .15M — nearly half the quarter's total value. One deal exceeded M.
Is the IPv4 market trending up or down heading into the second half of 2023?
Down, modestly. Our model shows a -0.14% quarterly decline, with a near-term forecast of .77 for the next month and a year-end 2023 projection of .70. This isn't a crash — it's a controlled deceleration from a market that peaked in prior quarters.
How reliable is the year-end price forecast of .70?
We flag this forecast as reliable based on the underlying dataset. That said, a roughly 5% decline from Q2's .51 average to .70 implies continued modest softening — plausible given IPv6 adoption headwinds and increased willingness among legacy holders to monetize.
Should organizations buy or lease IPv4 addresses at current Q2 2023 rates?
At .51 per IP to buy versus .5859 per IP per month to lease, the breakeven point is approximately 65.7 months — about 5.5 years. If your planning horizon exceeds that, buying is the rational play. Our model's verdict: buy.
What annual yield does leasing generate for IPv4 holders right now?
Approximately 18.3% annually. At a lease rate of .5859/IP/month (.03/IP/year) against a purchase cost of .51, IPv4 blocks function as a surprisingly high-yielding asset — well above conventional real estate or fixed-income benchmarks.
What does a /24 lease cost monthly in the current market?
About 0 per month, based on a sample of 44 lease transactions. Annualized, that's ,800 for 256 addresses — substantially below the roughly ,859 it would cost to purchase the same /24 outright.
What mistakes should be avoided when purchasing IPv4 blocks in the current market?
Three common errors: (1) overpaying for small blocks when the median is — anything above in ARIN space needs justification; (2) neglecting blacklist and reputation checks, which can render addresses unusable; (3) ignoring the buy-vs-lease calculus — if your need is under 5.5 years, leasing is economically superior at current rates.
What are the risks of buying IPv4 addresses at + when prices are trending down?
The primary risk is asset depreciation. With our model projecting .70 by year-end — a potential 4.7% decline — buyers could face mark-to-market losses. However, the 18.3% annual lease yield provides a substantial cushion, and operational necessity often trumps speculative timing.
Is AFRINIC space investable in Q2 2023?
No. AFRINIC recorded zero transactions and zero transfers this quarter. Ongoing governance disputes and policy uncertainty have effectively frozen the region's transfer market. We would advise against deploying capital into AFRINIC-registered space until institutional clarity improves.
What risks does accelerating IPv6 adoption pose to IPv4 valuations?
IPv6 remains the single largest structural headwind. As major cloud providers and mobile carriers shift traffic to IPv6 natively, marginal IPv4 demand erodes. That said, the installed base of IPv4-dependent infrastructure is enormous and sticky — we don't model a price collapse, but the gentle downward trend in pricing likely reflects this slow-motion substitution.
How many total inter-RIR and intra-RIR transfers were recorded in the first half of 2023?
Across the trailing six-month window (roughly H1 2023), we counted 4,282 total transfers. RIPE dominated with 61.7% of transfer volume, ARIN accounted for 38.3%, and all other RIRs registered zero. Peak transfer activity occurred in March 2023.
Why does RIPE lead in transfer volume but ARIN leads in transaction count?
RIPE's 61.7% share of transfers reflects both intra-RIPE policy-driven transfers (some of which are administrative, not market transactions) and active European demand. ARIN's 65 sales transactions versus RIPE's 25 indicate that North American deal flow is more granular — more buyers, smaller blocks, more fragmented demand.
What drove the single transaction above million in Q2 2023?
That deal was valued at approximately .26M. Given the quarter's average pricing, this implies a block of roughly 32,000+ addresses — likely a /17 or equivalent. Large-block transactions of this size typically involve enterprise consolidation, carrier expansion, or portfolio trades between brokers.
How long does a typical IPv4 transfer take to complete?
ARIN transfers generally close in 2–4 weeks once both parties have submitted documentation. RIPE transfers can be faster — often under two weeks — owing to a more streamlined policy framework. APNIC and LACNIC timelines are less predictable and can stretch to 6–8 weeks depending on compliance checks.
What should buyers budget for a /24 block in Q2 2023?
At the market-wide average of .51 per IP, a /24 (256 addresses) runs approximately ,859. In RIPE, expect closer to ,248 given the .03 average. In APNIC, the same block would cost roughly ,221. Budget an additional 5–10% for broker fees, escrow, and transfer-related costs.
Are there risks in buying the cheapest available IPv4 space at per IP?
Absolutely. Bottom-of-the-range blocks often come with baggage — poor reputation scores, prior spam or abuse history, or complex chain-of-title issues. Savings of /IP versus the median look attractive on a spreadsheet, but unusable addresses are worth zero. Due diligence costs are a rounding error compared to acquiring a tainted block.
How does the LACNIC market compare to the broader market in Q2 2023?
LACNIC was a surprisingly active niche: just 6 transactions, but they covered 36,864 IPs — an average deal size of 6,144 addresses, far above the global average. Pricing was compressed at – with a .33 mean, suggesting a handful of large, negotiated block trades rather than open-market spot activity.
What would make us revise our year-end forecast of .70 upward?
A sudden supply shock — for example, a major RIR tightening transfer policy or a large buyer entering the market for 5G or IoT deployment — could reverse the mild downtrend. Absent that, the combination of incremental IPv6 substitution and steady legacy block liquidation keeps the path of least resistance pointed lower.