15 min read
This report analyzes the IPv4 transfer market for 2025, based on completed IPv4Center marketplace transactions and official RIR transfer records.
Executive Summary
The IPv4 transfer market processed 901 transactions in 2025, moving just over 5 million addresses at a combined value of $99.6 million. Average pricing landed at $27.75 per IP — a sharp 16.1% decline from 2024. Transaction volume rose 19.8% year-over-year, meaning more deals got done at lower prices, a classic pattern of supply catching up to demand. The median held at $28, keeping the average-median spread tight and suggesting the decline was broad-based rather than driven by a few distressed blocks. The overall trend line points down, with month-over-month regression showing a 1.1% decline in the most recent period.Market Overview
| Transactions | 901 |
| IP Addresses Traded | 5,005,056 |
| Estimated Market Value | $99,558,803 |
| Average Price / IP | $27.75 |
| Median Price / IP | $28.00 |
| RIR Transfers | 10,316 |
Year-over-Year Comparison
| Metric | This period | A year earlier (2024) | Change |
|---|---|---|---|
| Transactions | 901 | 752 | +19.8% |
| IP Addresses Traded | 5,005,056 | 1,818,624 | +175.2% |
| Estimated Market Value | $99,558,803 | $60,628,036 | +64.2% |
| Average Price / IP | $27.75 | $33.09 | -16.1% |
| RIR Transfers | 10,316 | 10,553 | -2.2% |
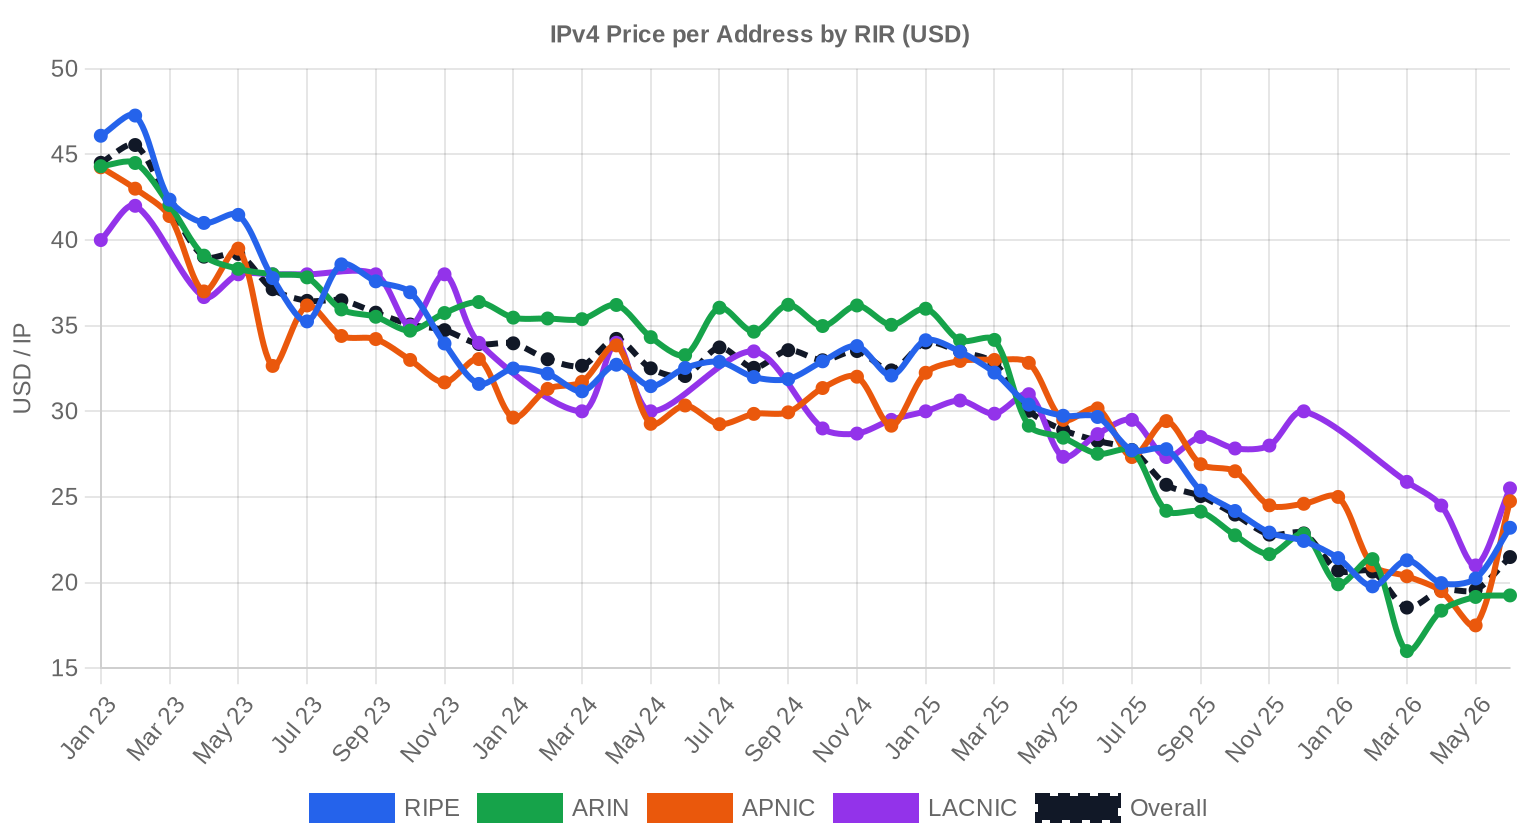
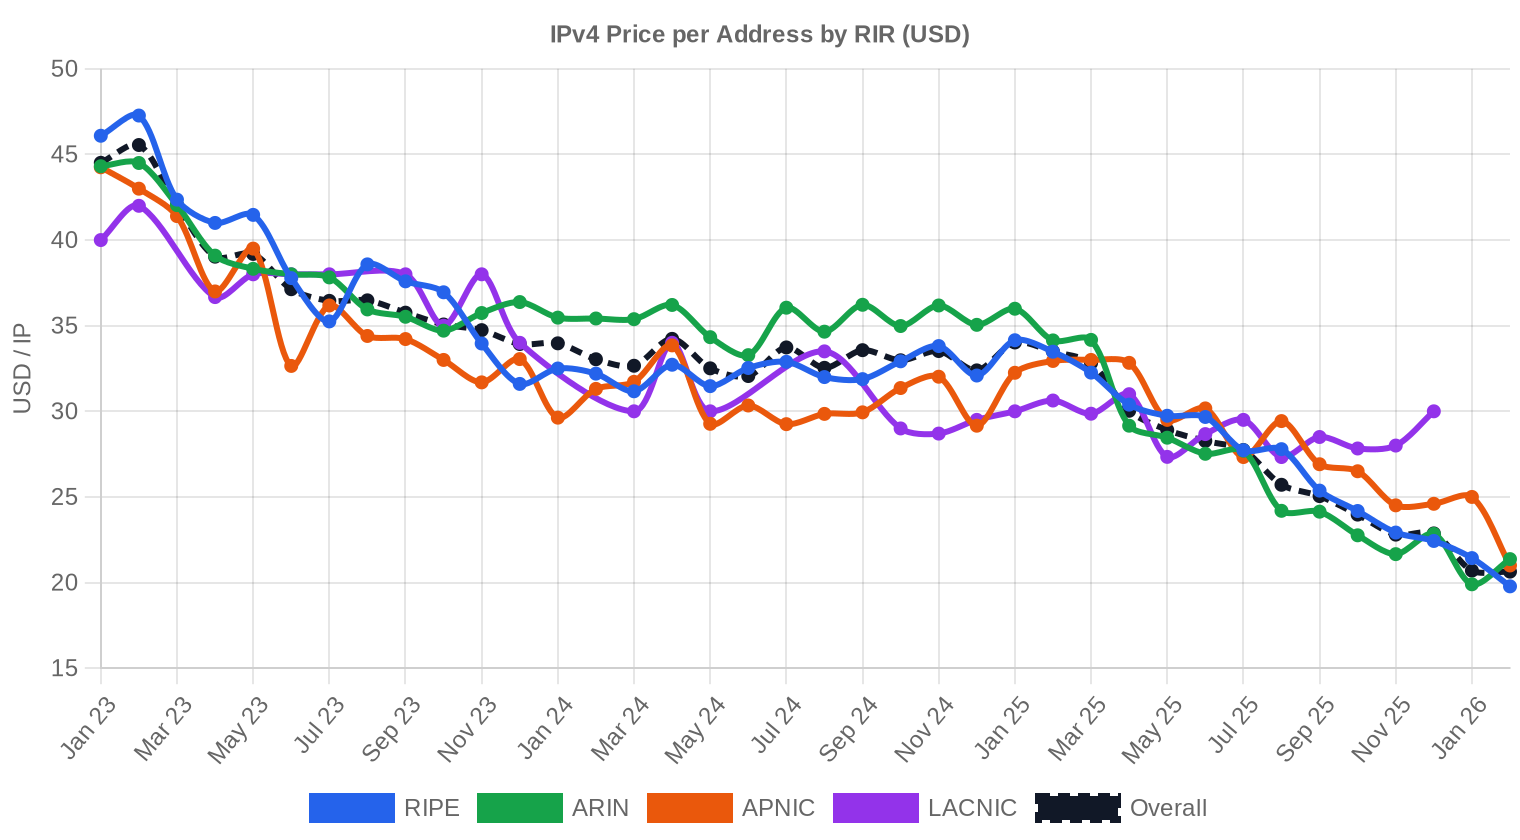
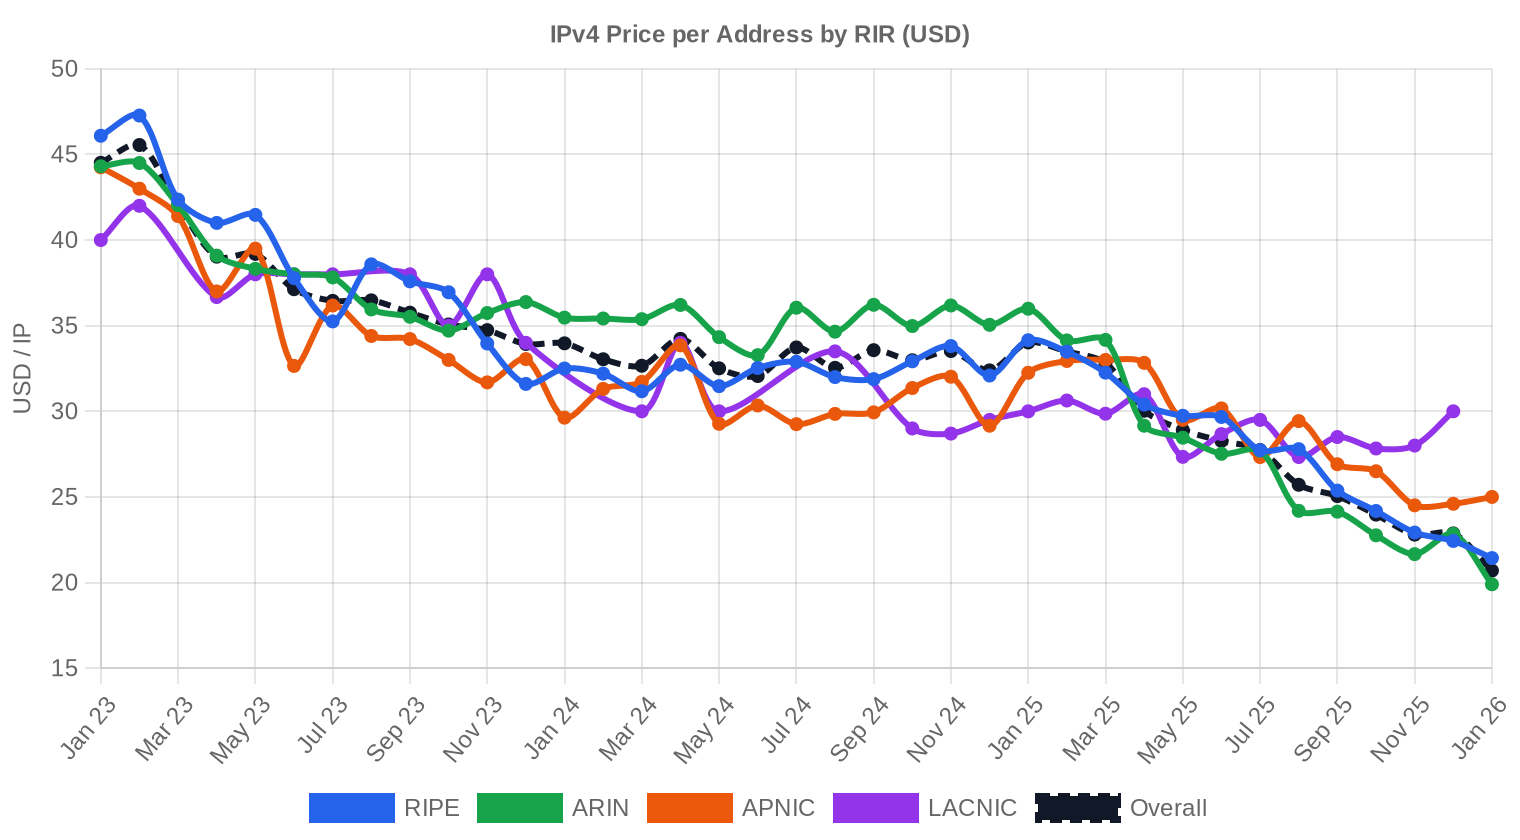
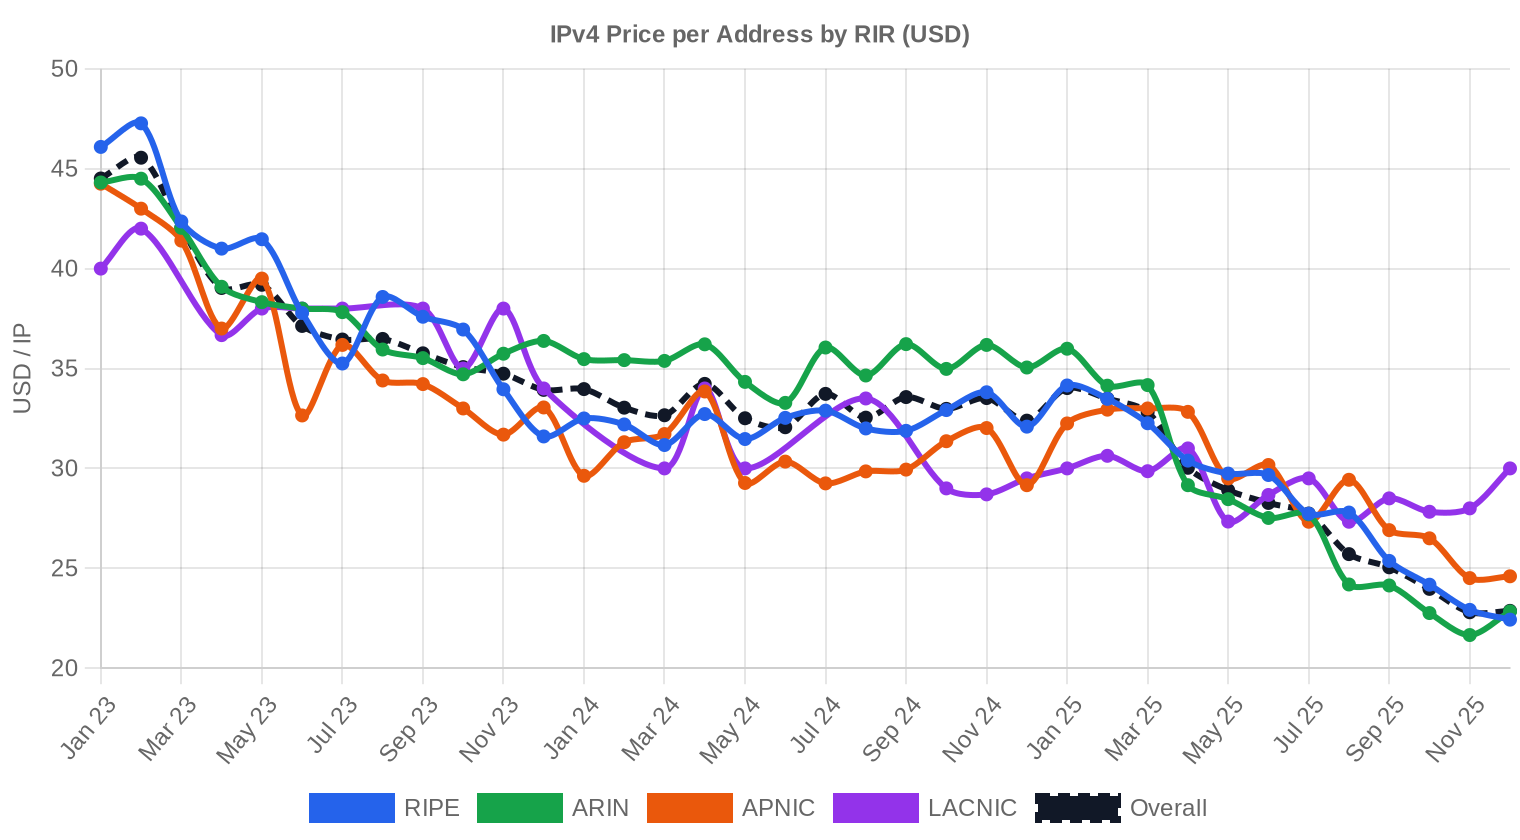
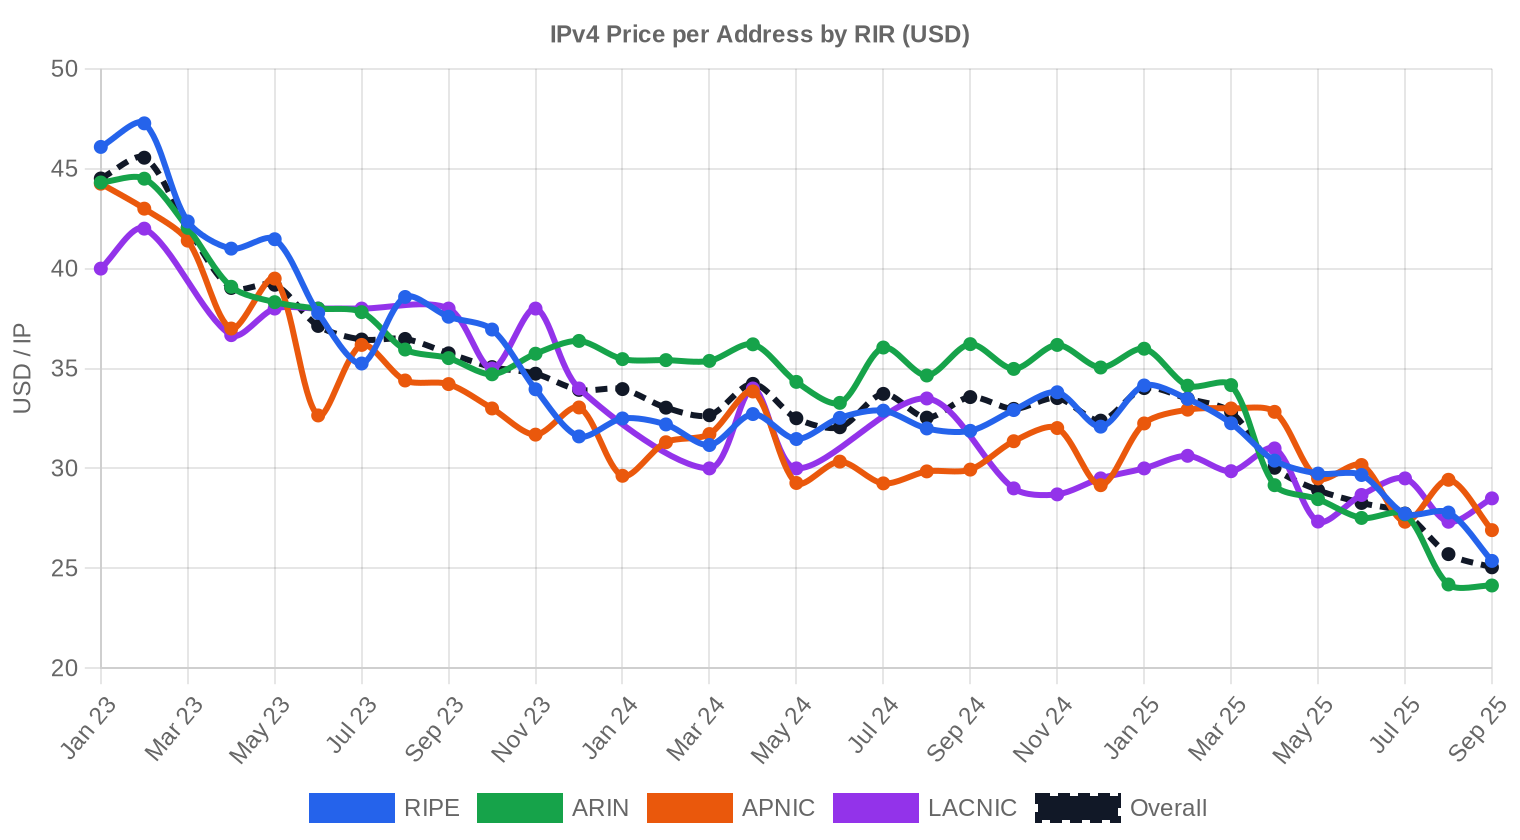
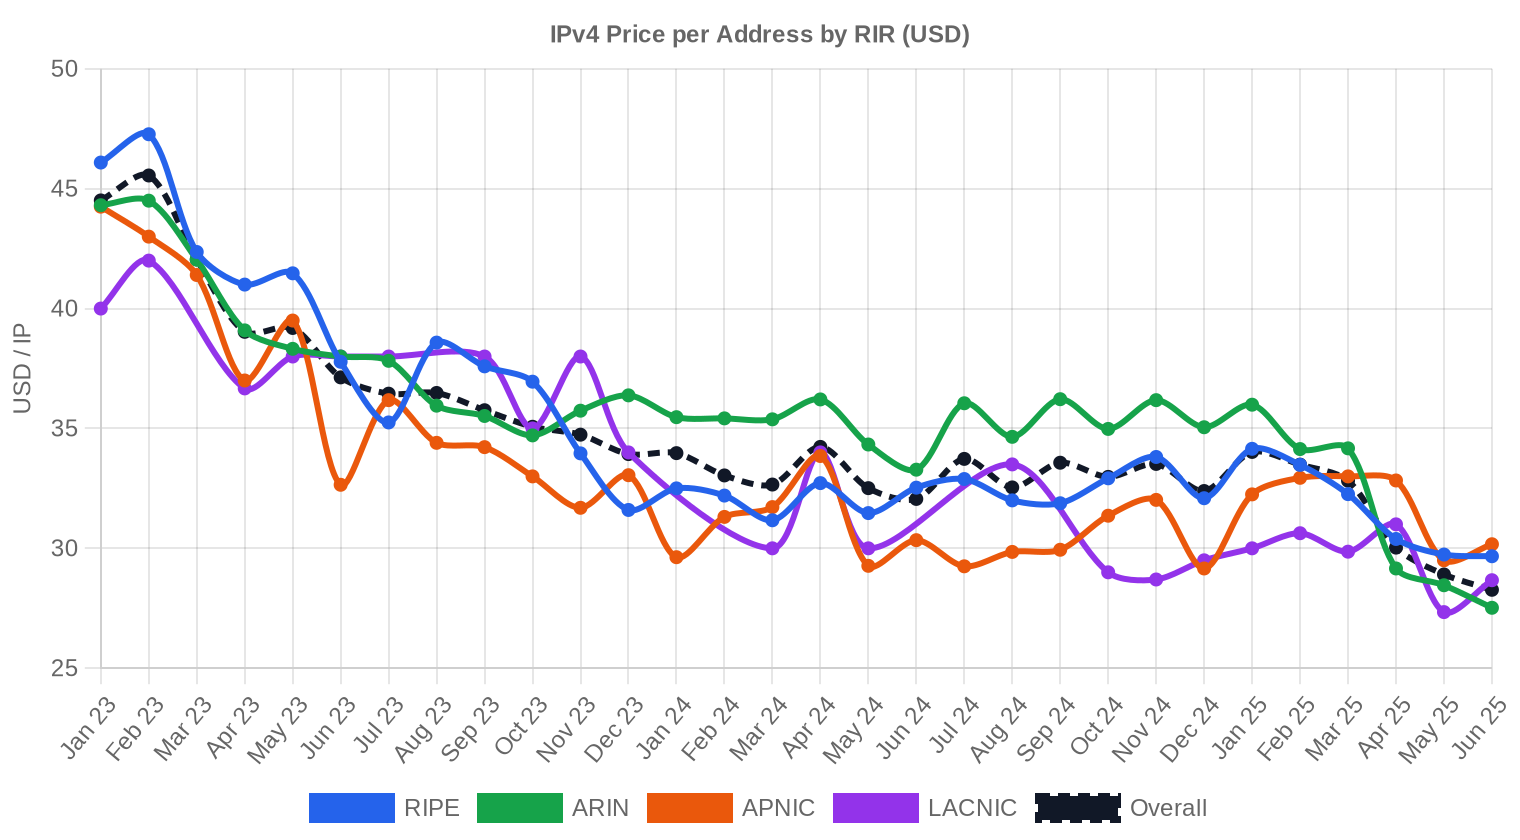
Price Dynamics
The pricing range in 2025 ran from $11 to $50 per IP — a $39 spread that reflects the gap between bulk /8-adjacent legacy blocks and premium small-lot APNIC inventory. That floor of $11 is striking; we haven't seen double-digit lows since early 2022, and it signals that some large holders are liquidating aggressively. The 16.1% year-over-year drop is the largest annual decline since the market's post-pandemic correction, and it accelerated through the back half of the year. Buyers who paid $33+ per IP in 2024 are sitting on paper losses, which tends to create its own momentum — holders who were on the fence about selling start racing to the exits. The regression trend remains firmly negative, with no structural support visible above the $25 level on current trajectories.
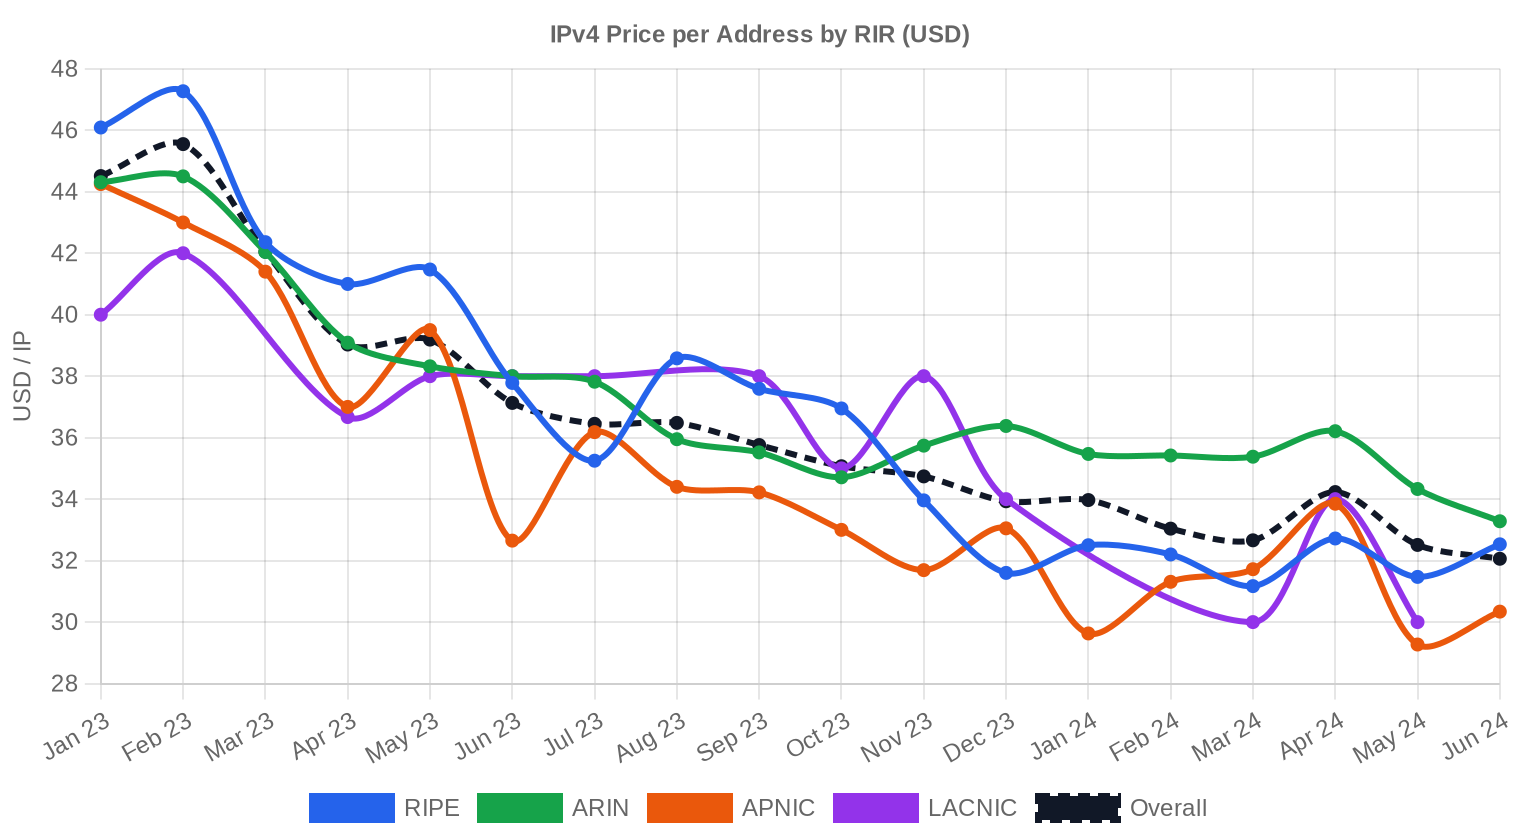
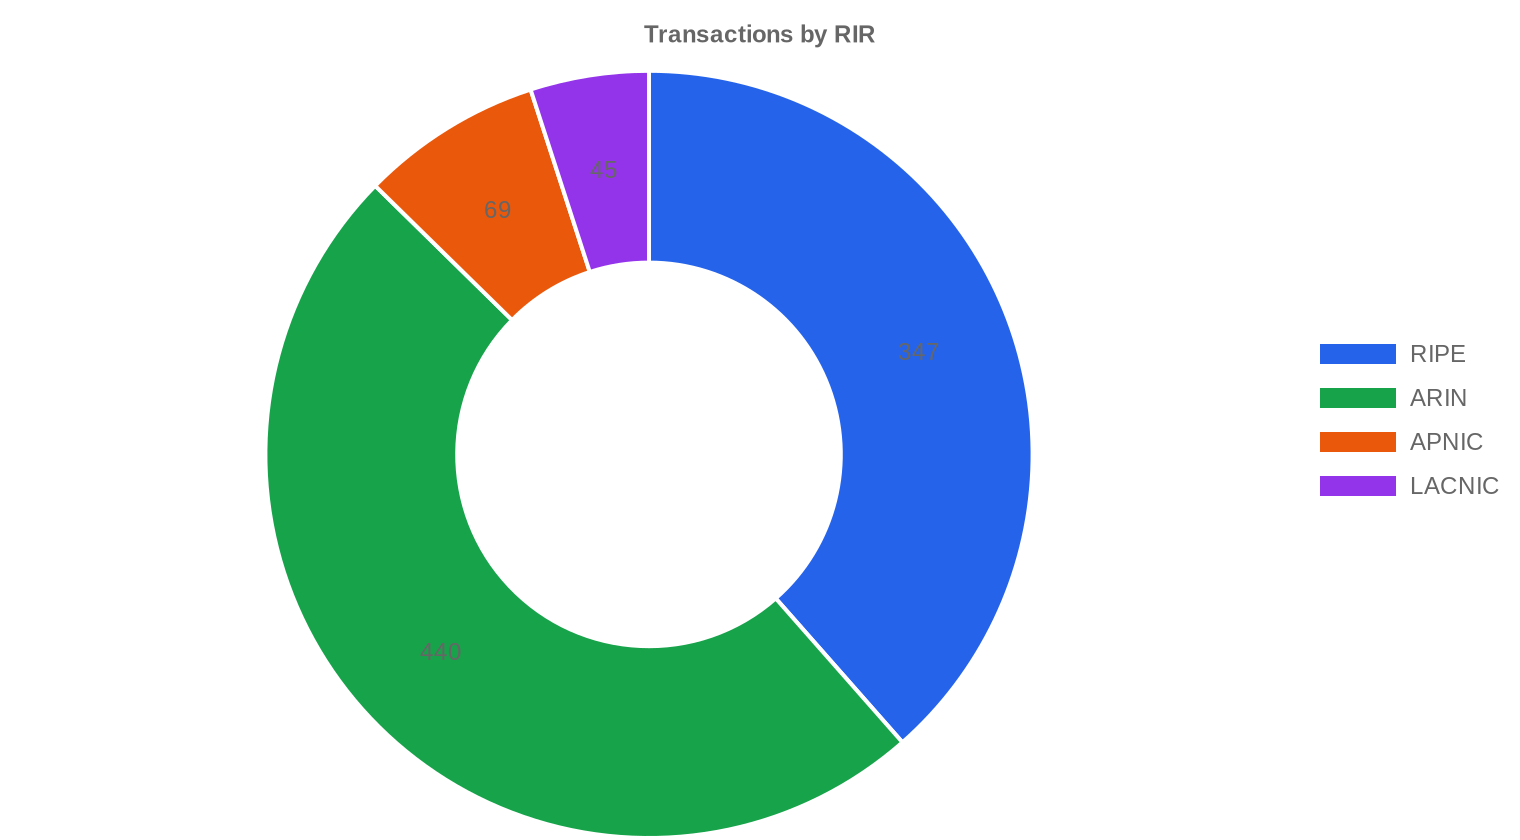
Pricing by RIR
ARIN dominated deal flow with 48.8% of total volume, but its average price of $27.24 made it the cheapest major registry — a reversal from 2023 when ARIN space routinely commanded premiums. APNIC held the top spot at $29.32 per IP, though on just 69 transactions covering 86,528 addresses, so thin liquidity inflates the figure. RIPE priced at $27.91, nearly converging with ARIN for the first time in several years. LACNIC came in at $29.18 across 45 deals with a remarkably tight spread ($25.50–$34.50), reflecting the controlled supply environment in Latin America.ARIN: $27.24 per IP across 440 transactions (75.1% of total IPs traded).
RIPE: $27.91 per IP across 347 transactions (21.0% of total IPs traded).
APNIC: $29.32 per IP across 69 transactions (1.7% of total IPs traded).
LACNIC: $29.18 per IP across 45 transactions (2.1% of total IPs traded).
AFRINIC: No recorded transactions — the registry remains effectively frozen for transfers.
| RIR | Transactions | Avg $/IP | Median $/IP | IPs Traded | RIR Transfers | Next Month (proj.) | Year-End (proj.) |
|---|---|---|---|---|---|---|---|
| RIPE | 347 | $27.91 | $29.00 | 1,052,160 | 5,406 | $21.00 | $18.00 |
| ARIN | 440 | $27.24 | $27.00 | 3,759,360 | 4,910 | $21.00 | $18.00 |
| APNIC | 69 | $29.32 | $30.00 | 86,528 | 0 | $25.00 | $22.00 |
| LACNIC | 45 | $29.18 | $29.00 | 107,008 | 0 | $29.00 | $28.00 |
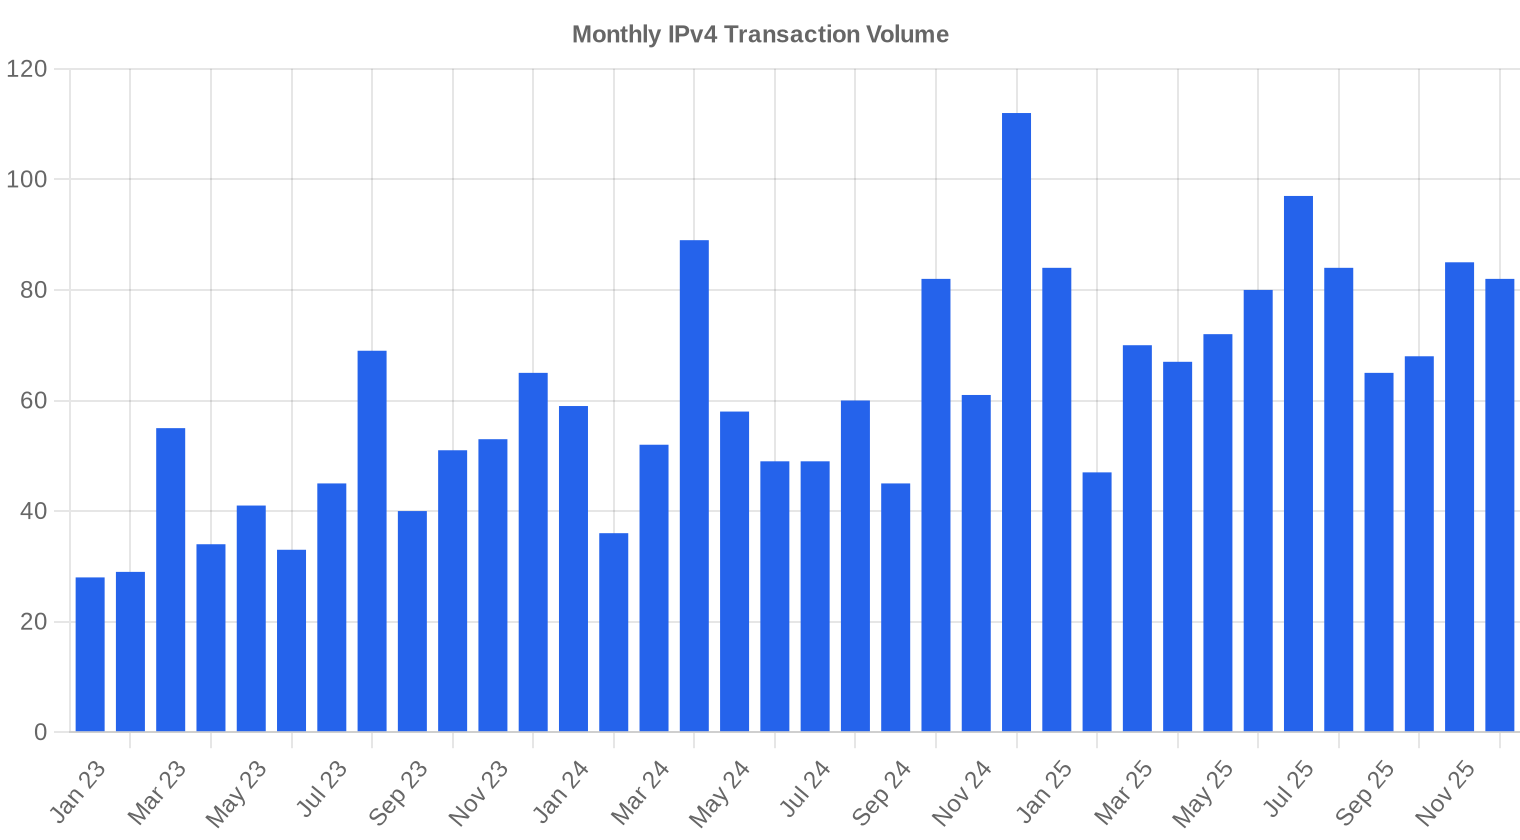
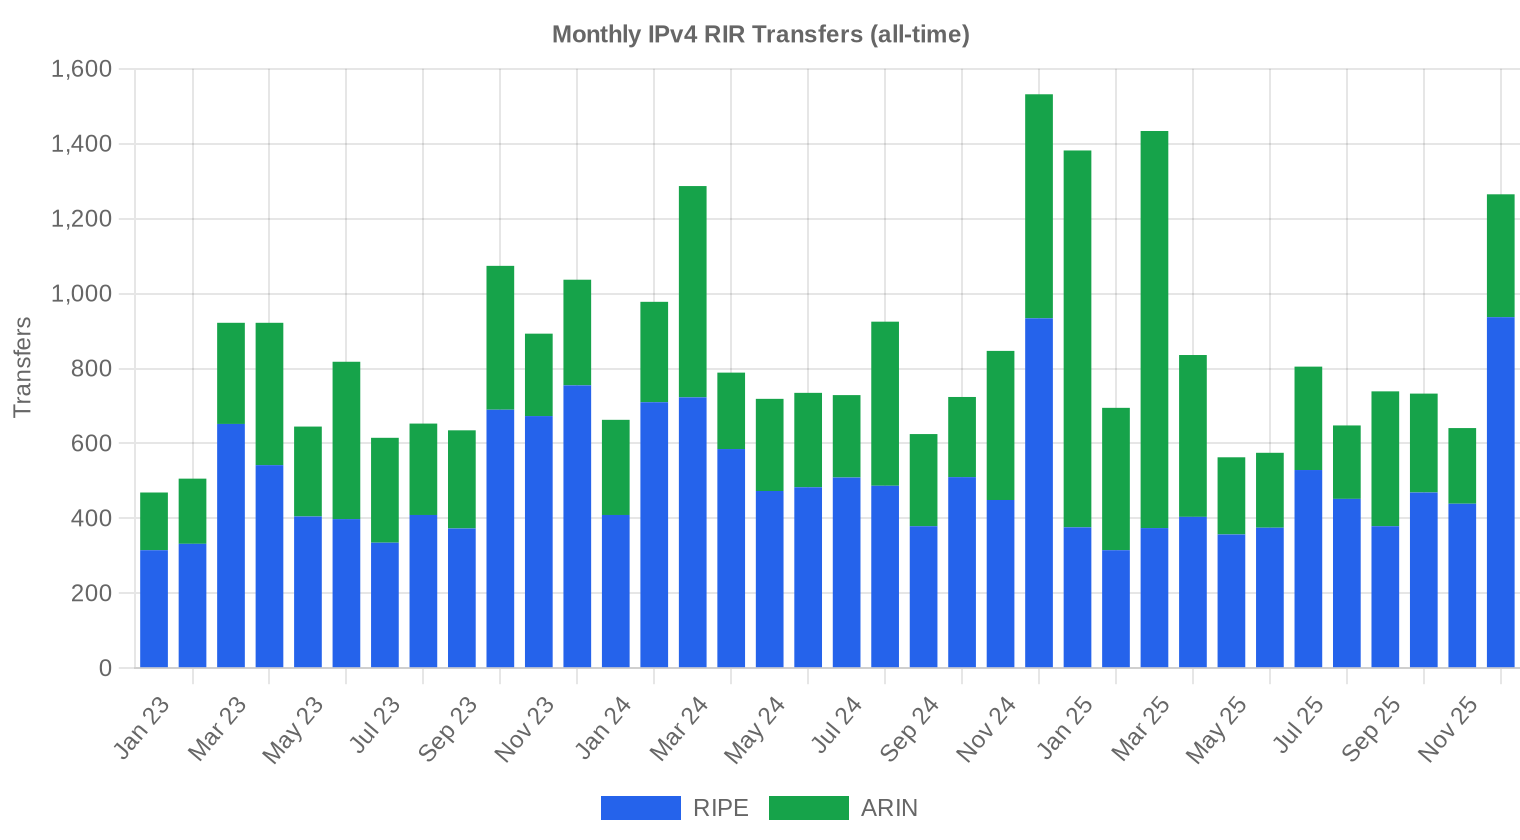
Transaction Volume
Supply & Block Sizes
The /24 was again the most traded prefix, accounting for 297 of 901 transactions — about a third of all deals. Buyers continue to favor /24s for discrete deployments: email infrastructure, CDN nodes, VPN endpoints. Larger blocks (/16 and above) accounted for the bulk of dollar volume, though, with 42 deals over $1 million representing $92.7 million of the $99.6 million total — a 93% share of value from fewer than 5% of transactions.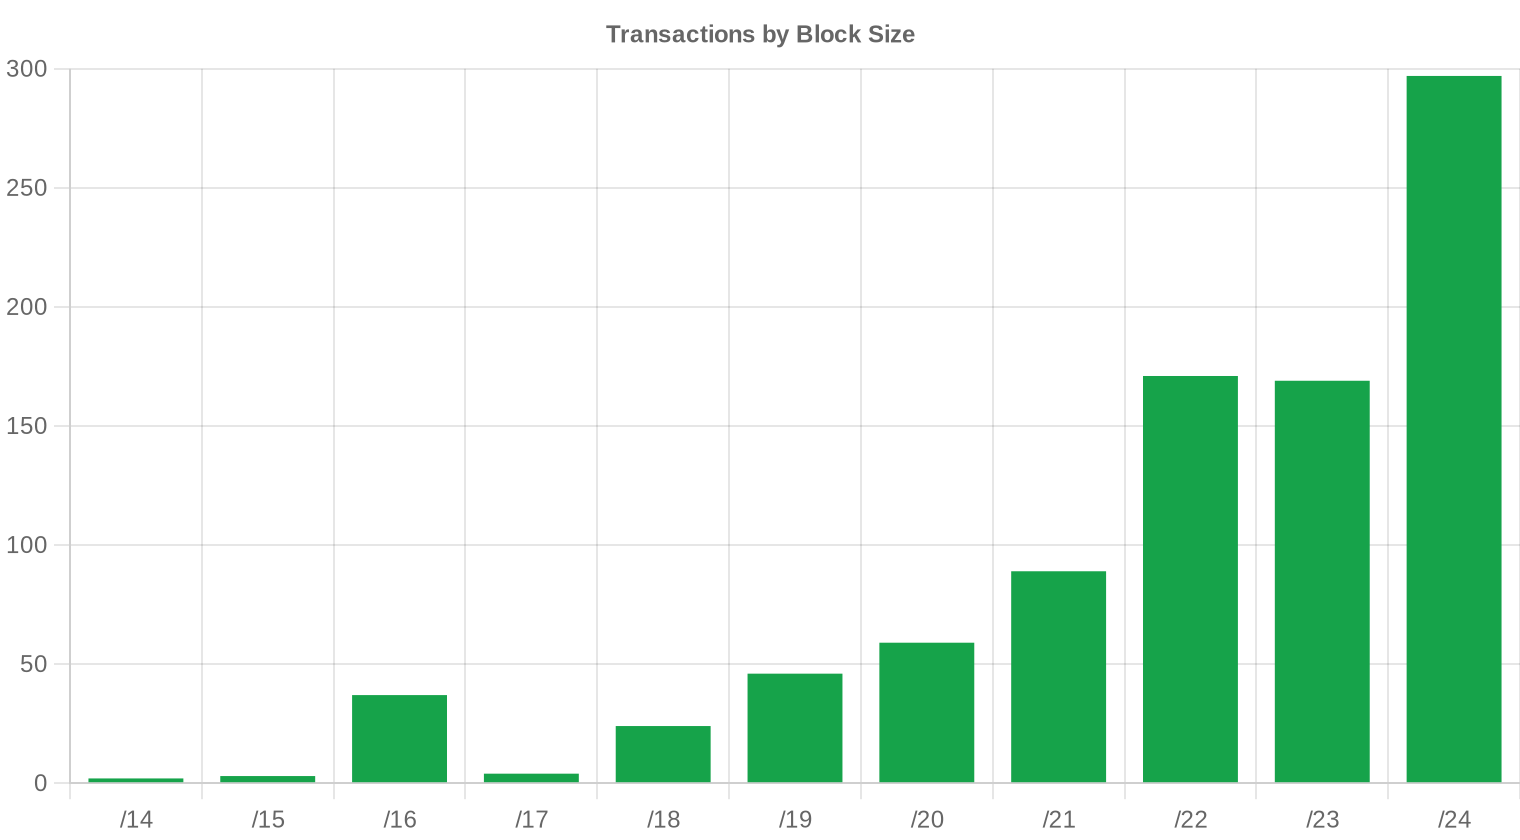
Geographic Activity
The United States accounted for 16% of known buyer geography, with Canada and the United Kingdom each at 3%. European markets — Bulgaria, Germany, Italy — each registered single-digit shares. The US concentration reflects both ARIN's dominance in deal count and the ongoing build-out of domestic cloud and broadband infrastructure that requires routable address space.Registry Transfer Activity
Official RIR transfer registries recorded 10,316 transfers in 2025, well above the 901 priced transactions captured in our dataset. RIPE led with 5,406 transfers (52.4% of the total), followed by ARIN at 4,910. The gap between total transfers and priced transactions reflects intra-company moves, mergers, and transfers where pricing remains undisclosed.Long-Run Transfer Trends
Over the trailing 36-month window, 30,058 transfers were recorded across all RIRs. RIPE accounted for 59.7% of that cumulative total versus ARIN's 40.3% — a reminder that European transfer activity is structurally higher due to RIPE's more fragmented holder base. The peak month in that window was December 2024, consistent with the year-end tax and budget-cycle rush that typically compresses Q4 pricing before a January reset.| RIR | RIR Transfers |
|---|---|
| RIPE | 17,936 |
| ARIN | 12,122 |
| RIR Transfers | 30,058 |
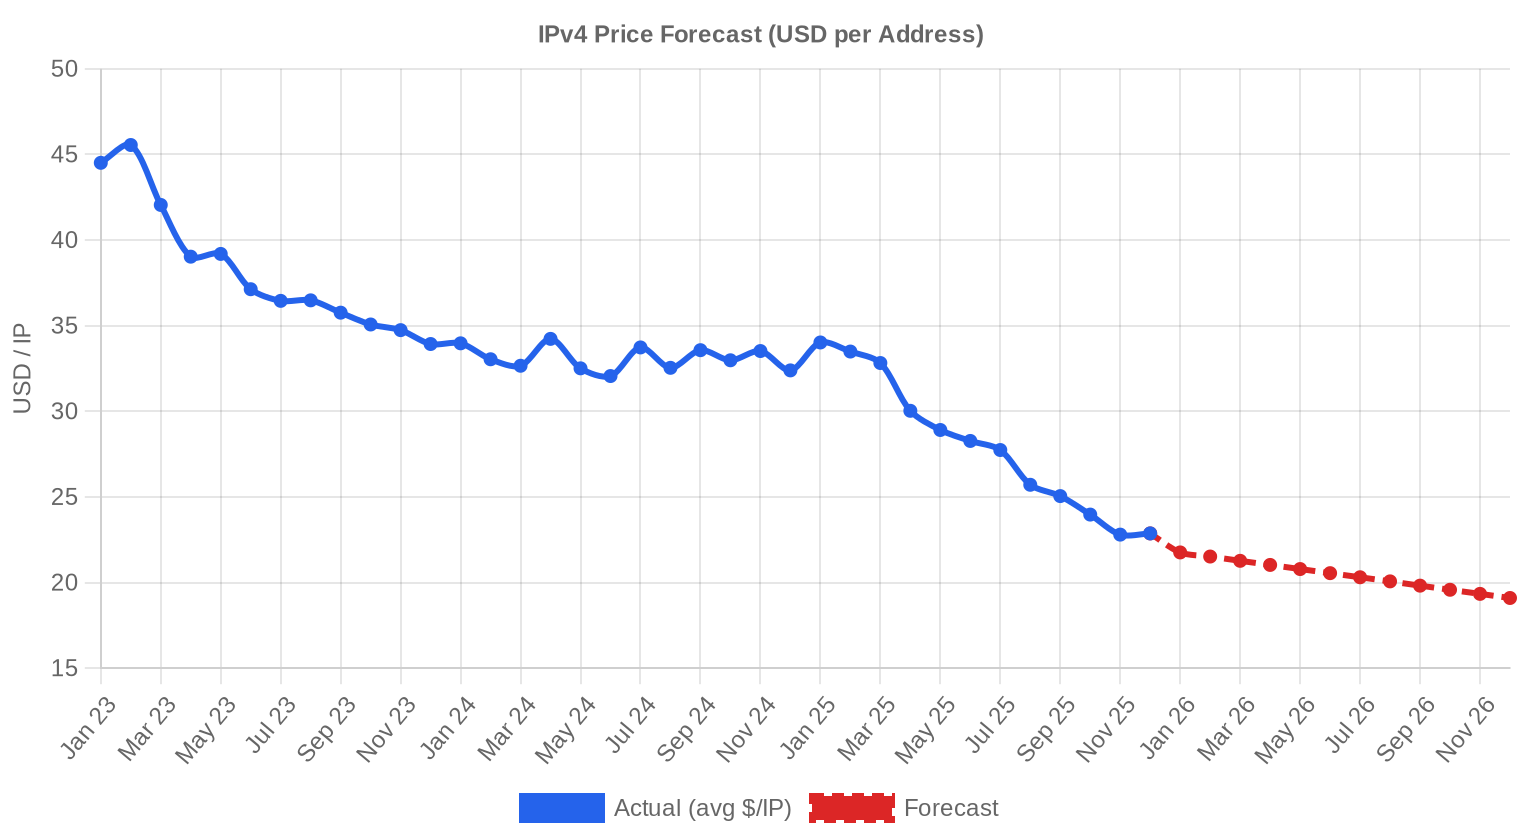
Outlook & Forecast
Forecasting each block-size band and RIR separately with our AI model:
The overall average price per IP is projected to reach $19.10 by December 2026, with a next-month estimate of $21.87 per IP.
2025 year-end expectation: $22.00 · 2026 year-end expectation: $19.10 per IP.
- RIPE: projected at $21.00 per IP next month, trending toward $18.00 by December 2026.
- ARIN: projected at $21.00 per IP next month, trending toward $18.00 by December 2026.
- APNIC: projected at $25.00 per IP next month, trending toward $22.00 by December 2026.
- LACNIC: projected at $29.00 per IP next month, trending toward $28.00 by December 2026.
- AFRINIC: insufficient data for a reliable forecast.
Forecast by Block Size
| Block | Current $/IP | Next Month | Year-End | Confidence |
|---|---|---|---|---|
| /24 | $25.00 | $25.00 (0.0%) | $22.00 (-12.0%) | medium |
| /23 | $21.35 | $22.00 (+3.0%) | $19.00 (-11.0%) | medium |
| /22 | $20.88 | $21.00 (+0.6%) | $18.00 (-13.8%) | medium |
| /21 | $20.50 | $20.00 (-2.4%) | $17.00 (-17.1%) | medium |
| /20 | $25.00 | $22.00 (-12.0%) | $20.00 (-20.0%) | low |
| /19 | $17.50 | $17.00 (-2.9%) | $15.00 (-14.3%) | low |
| /18-/16 | $12.75 | $13.00 (+2.0%) | $12.00 (-5.9%) | low |
| /15-up | $11.63 | $11.00 (-5.4%) | $10.00 (-14.0%) | low |
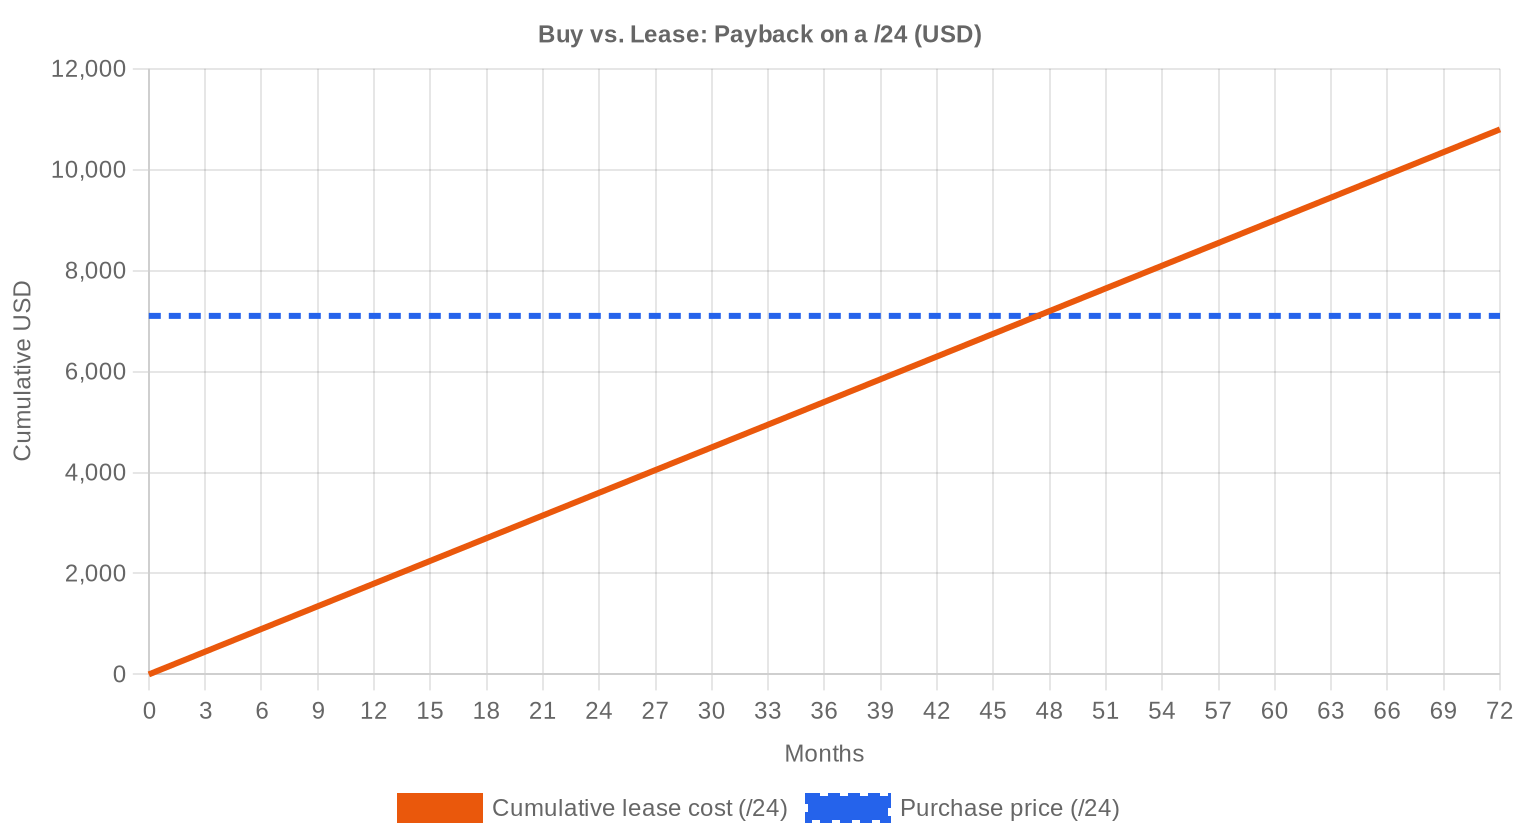
Editor's Take: Buy vs. Lease
At $27.75 per IP to buy and $0.5859 per IP per month to lease, the amortization math breaks even at 47.4 months — just under four years. That payback period favors buying, especially for organizations with a planning horizon beyond 2029. The annual yield on leased-out IPv4 sits at 25.3%, which is exceptional by any asset-class standard, but it assumes stable lease rates in a declining price environment. If purchase prices continue toward $19 by year-end 2026, lease rates will follow — they always do, just with a lag. Our recommendation: buy now if you need the space for five-plus years. If your use case is shorter-term or project-based, lease and revisit when the market bottoms.| /24 Purchase price | $7,104 |
| /24 Lease price | $150 / mo |
| Payback period | 47.4 mo (3.9 yr) |
| Gross annual yield | 25.3% |
What This Means for You
Buyers: You have leverage you haven't had since 2021. Average pricing is down 16% and the forecast points lower. There's no urgency premium — take your time, negotiate hard, and push for clean blocks with no blacklist history. A /24 that cost $8,500 a year ago is now around $7,100.Sellers: The window for $30+ exits on ARIN space is closing. If you're holding legacy blocks with no operational use, the math favors selling now over waiting for a rebound that may not come in 2025–2026. Every quarter of delay could cost 4–5% of realized value.
Leasers: Monthly rates at $0.59 per IP remain attractive for short-duration needs. But watch the spread — as purchase prices fall, lease economics tilt further toward buying for anyone with a 4+ year horizon.
Block holders with no immediate plans: Leasing generates 25.3% annual yield at current rates. That's better than most alternatives in fixed income or real estate. But it requires active management — tenant quality, blacklist monitoring, and re-leasing when contracts expire.
Browse verified IPv4 blocksSell IPv4 →
List your blocks with managed transferLease IPv4 →
Flexible short-term capacityLease Out IPv4 →
Turn idle blocks into recurring revenue
IPv4 Pricing by Block Size
Small-block premiums remain intact but are compressing. A /24 (256 IPs) at the median price runs about $7,168, while a /16 (65,536 IPs) at bulk rates can dip below $15 per IP on the right deal. The per-IP premium for a /24 over a /16 used to run 80–100%; it's now closer to 50–60%, which suggests the small-block scarcity narrative is fading as more holders fragment and sell.| Block | IPs | Buy: /IP | Buy: Total | Lease: /IP/mo | Lease: Monthly |
|---|---|---|---|---|---|
| /24 | 256 | $35–45 | $8,960–11,520 | $0.38–0.50 | $97–128 |
| /22 | 1,024 | $28–38 | $28,672–38,912 | $0.33–0.45 | $338–461 |
| /20 | 4,096 | $22–32 | $90,112–131,072 | $0.30–0.40 | $1,229–1,638 |
| /18 | 16,384 | $20–30 | $327,680–491,520 | $0.30–0.38 | $4,915–6,226 |
| /16 | 65,536 | $18–28 | $1,179,648–1,835,008 | $0.30–0.35 | $19,661–22,938 |
IPv4 Price History: 2011–2026
When IANA handed out the last /8 blocks in 2011, IPv4 addresses traded at $4–$7 per IP. Prices climbed steadily through the decade, accelerating during the pandemic-era infrastructure boom to a peak near $55–$60 for small blocks in 2022. AWS's decision to charge $0.005/hour for public IPv4 starting in February 2024 was a psychological turning point — it quantified the cost of free-riding on address space and pushed some holders to monetize. The current $27.75 average represents a market that has given back roughly half its 2022 gains, settling into a new regime where supply and demand are more balanced than at any point in the last five years.| Year | ~Price/IP | Key Event |
|---|---|---|
| 2011 | $7–12 | IANA free pool exhausted; Microsoft/Nortel deal ($11.25/IP) |
| 2012 | $8–12 | RIPE NCC reaches last /8; begins /22-only allocation |
| 2014 | $10–15 | LACNIC free pool exhausted |
| 2015 | $8–15 | ARIN free pool exhausted |
| 2017–18 | $12–18 | Leasing market grows; cloud demand rises |
| 2019 | $18–24 | RIPE NCC exhausts remaining free pool |
| 2021–22 | $50–60+ | Post-pandemic peak; hyperscaler build-outs |
| 2024 | $35–52 | AWS IPv4 charge ($0.005/IP/hr); large block correction |
| 2025–26 | $18–45 | Market bifurcation; /16s below $20 for first time since 2019 |
Market Structure: Who Is Buying & Selling
The buy side is dominated by mid-tier cloud providers, regional ISPs expanding coverage areas, and enterprises repatriating workloads from public cloud. On the sell side, legacy corporate holders — many of whom received Class A and B allocations in the 1980s and 1990s — continue to divest blocks that serve no internal purpose. Bankruptcy estates and M&A restructurings also feed supply, particularly in the ARIN region where corporate churn is highest.IPv4 vs. Other Asset Classes
At a 25.3% annualized lease yield, IPv4 addresses outperform virtually every conventional asset class on a current-income basis. US Treasuries yield under 5%, commercial real estate cap rates sit at 6–8%, and the S&P 500 dividend yield is below 1.5%. The catch is depreciation risk: if the underlying asset falls to $19 per IP by end of 2026 as forecast, total return nets out to roughly 10–12% annualized after capital losses — still competitive, but not the slam dunk the headline yield suggests.| Asset Class | Typical Yield | Liquidity | Primary Risk |
|---|---|---|---|
| IPv4 | 25.3% | Moderate | IPv6 adoption, block quality |
| Commercial Real Estate | 5–8% | Low | Vacancy, rate cycle |
| Investment-Grade Bonds | 4–5% | High | Duration, credit risk |
| S&P 500 | ~1,3% | High | Market volatility |
| Money Market / T-Bills | ~4–5% | High | Rate cycle changes |
IPv6 Adoption & Why IPv4 Remains Essential
IPv6 adoption crossed 45% of Google's traffic in 2025, but the long tail of IPv4 dependency shows no sign of disappearing. Legacy enterprise applications, IoT devices with hardcoded stacks, and billions of residential CPE units will require IPv4 connectivity through at least 2030. The coexistence period is now measured in decades, not years — and that structural demand floor is what keeps IPv4 pricing from collapsing entirely even in a down market.AI & Cloud Infrastructure Demand
AI infrastructure buildouts are a net positive for IPv4 demand, though the effect is more diffuse than headlines suggest. Training clusters need relatively few public IPs — they communicate internally over private fabrics — but inference endpoints, API gateways, and edge nodes each require routable addresses. The explosion of AI-as-a-service startups is creating a new cohort of small-block buyers, many of whom are leasing /24s for the first time.What Determines IPv4 Block Value
Block cleanliness remains the single largest pricing variable. A /24 with zero Spamhaus listings and no abuse history can command a 15–20% premium over a comparable block with even a single CBL entry. Allocation age matters too — older blocks from the early ARIN and RIPE eras carry less risk of disputes. RIR transferability is the gating factor for cross-regional deals: RIPE's 24-month rule, ARIN's needs-based justification, and APNIC's scarcity all create distinct pricing tiers.Sell vs. Lease: A Decision Framework
In a declining price market, leasing preserves optionality while generating income. Sellers who lock in at $27–$28 today capture value that may not be available in 12 months. The breakpoint: if you believe prices stabilize above $22 by 2027, lease and collect the 25% yield. If you think the decline pushes through $20, sell now and redeploy capital — the depreciation will eat your lease income.| /24 Purchase price | $7,104 |
| /24 Lease price | $150 / mo |
| Payback period | 47.4 mo (3.9 yr) |
| Gross annual yield | 25.3% |
RIPE NCC 24-Month Transfer Restriction
RIPE's 24-month holding requirement before re-transfer continues to act as a supply brake in the European market. Blocks acquired in early 2024 won't be eligible for resale until 2026, which creates a structural lag that supports RIPE pricing even as ARIN space softens. Speculators who bought RIPE blocks at $33–$35 in 2023 are now locked in at a loss, and their eventual forced selling could create a secondary price dip in late 2026.Deal Size Distribution
Average deal size jumped to 110,498 IPs per transaction in 2025, up 37% from 80,622 in 2024. That shift was driven by the top end: 42 deals over $1 million moved $92.7 million in value, dwarfing the 637 sub-$50K transactions that collectively represented just $9.4 million. The mid-market ($50K–$250K) accounted for 194 deals and $22.2 million — the most balanced segment in terms of price discovery and liquidity.Top Trading Countries
The United States led buyer geography at 16% of identified transactions, followed by Canada and the United Kingdom at 3% each. Bulgaria, Russia, Germany, and Italy each registered at 1%. The US share understates actual demand — many transactions involve shell entities or subsidiaries that mask the ultimate buyer's geography, particularly for hyperscaler-adjacent deals routed through Delaware LLCs.BEAD Broadband Program Impact
The $42.45 billion BEAD program is entering its deployment phase, and participating ISPs will need routable IPv4 space for subscriber provisioning. Most BEAD recipients are small to mid-size carriers who typically buy /20 to /18 blocks — exactly the range where supply is thinnest. We expect BEAD-driven demand to put a floor under mid-size block pricing even as /24s and large /16+ blocks continue to soften.Hyperscaler IPv4 Holdings
Amazon, Microsoft, and Google collectively hold an estimated 100+ million IPv4 addresses — enough to supply the entire market for years if released. They won't. These addresses are embedded in production infrastructure and represent a strategic moat. Amazon's decision to charge for public IPv4 use has, however, pushed its customers to be more efficient, which has a trickle-down effect: enterprises that optimize their AWS footprint sometimes release blocks back to market. The hyperscalers are net demand suppressors through efficiency gains, even as they remain net holders.Macroeconomic Conditions & Market Impact
Falling interest rates in 2025 have loosened enterprise IT budgets, which explains the 19.8% jump in transaction volume even as prices dropped. Cheaper capital means more infrastructure projects get greenlit, and each project that involves public-facing services needs address space. The flip side: a slowing economy reduces new ISP subscriber growth, which historically accounts for 30–40% of IPv4 demand. The net effect has been volume up, price down — more buyers, but at lower willingness to pay.Model Update & Calibration
As part of our continuous improvement process, we backtested previous forecasts against realised prices and fine-tuned the model accordingly. Recent months now carry more influence than older data, and the confidence bands have been widened or narrowed based on how well they captured actual outcomes in the past. You can see the full backtest results in the table and chart below.
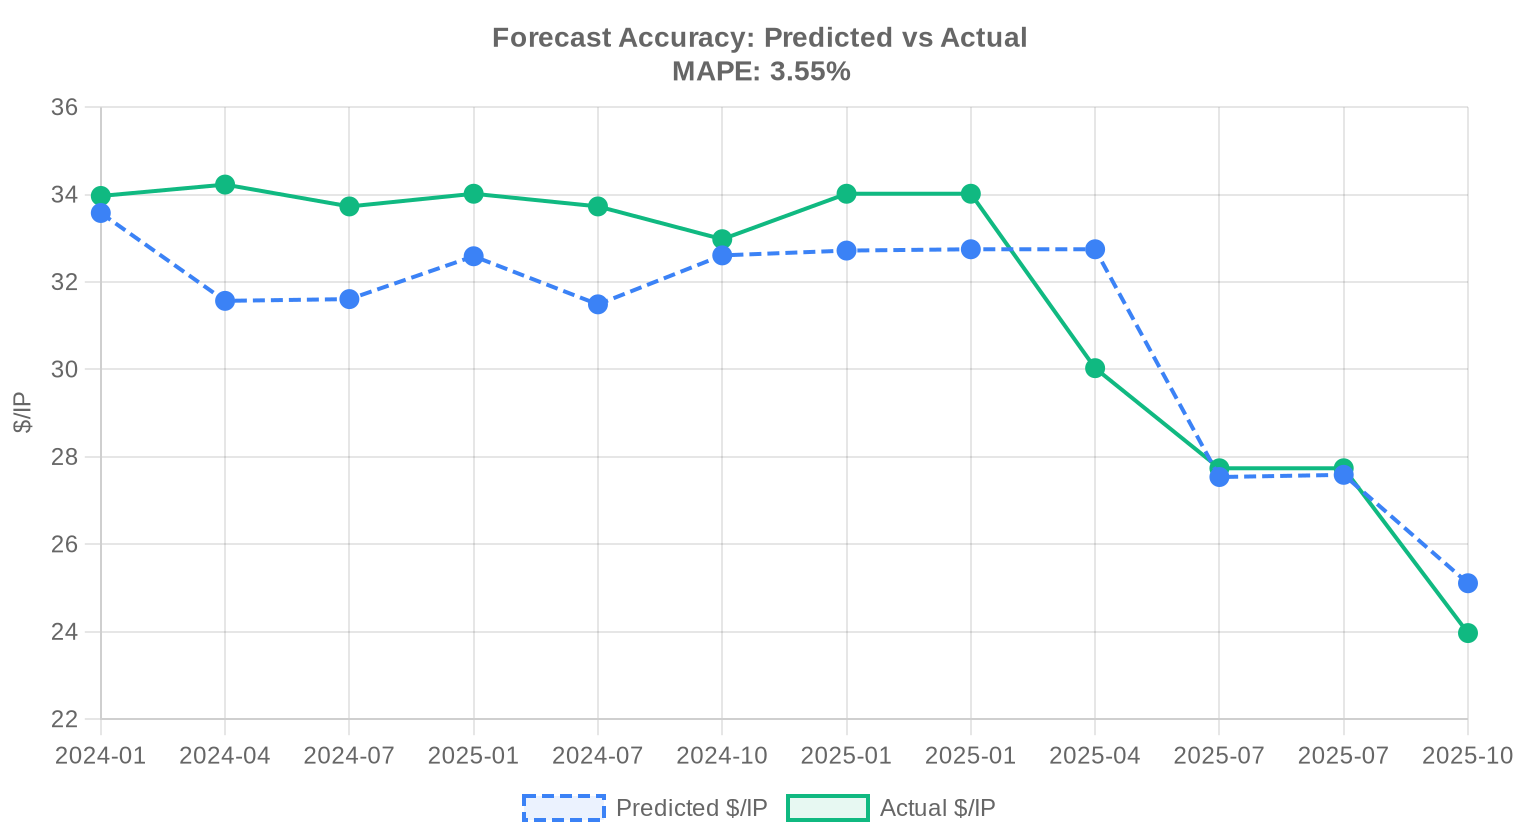
| Report Period | Target Month | Predicted | Actual | Deviation |
|---|---|---|---|---|
| 2024-H2 | 2025-01 | $33 | $34 | -4% |
| 2024-Q4 | 2025-01 | $33 | $34 | -4% |
| 2025-Q1 | 2025-04 | $33 | $30 | +9% |
| 2025-H1 | 2025-07 | $28 | $28 | -1% |
| 2025-Q2 | 2025-07 | $28 | $28 | -1% |
| 2025-Q3 | 2025-10 | $25 | $24 | +5% |
Methodology
Figures are based on completed IPv4Center marketplace transactions and RIR transfer statistics. Prices are in US dollars per IP address. Forecasts are produced by an AI model that analyses each block-size band and RIR segment separately (with outlier-trimmed medians) alongside known market catalysts; they are estimates, not guarantees.
Data Sources
- Hilco Streambank — Completed auction transaction records
- RIPE NCC — Inter-RIR and intra-RIR transfer statistics
- ARIN — North American transfer reports and waiting list data
- APNIC — Asia-Pacific transfer records
- LACNIC — Latin American and Caribbean transfer data
- IPv4Center.com — Proprietary marketplace transaction and lease pricing data
This report is generated automatically for informational purposes only and does not constitute financial advice.
Frequently Asked Questions
What is the average price per IPv4 address in 2025?
The market-wide average stands at .75 per address, with a median of . This represents a modest but meaningful decline — the trend is definitively down, with prices off roughly 1.1% and further softening anticipated through year-end.
How many IPv4 transfer transactions closed in 2025?
We recorded 901 priced transactions covering just over 5 million addresses, generating approximately .6 million in aggregate deal value. Beyond priced sales, total registered transfers across all RIRs reached 10,316 — a figure that includes intra-org restructurings and non-market moves.
Which RIR region commands the highest per-address prices in 2025?
APNIC leads at .32 per address (median ), followed closely by LACNIC at .18. RIPE sits at .91 and ARIN at .24. The Asia-Pacific premium reflects persistent scarcity — APNIC exhausted its free pool earliest, and supply in the region remains structurally tight.
Why is ARIN the dominant RIR by transaction volume despite not having the highest prices?
ARIN accounted for 440 of 901 transactions (48.8% share) and an outsized 75.1% of total IP volume at 3.76 million addresses. North American blocks tend to be larger — the average ARIN deal moved considerably more addresses than the average RIPE deal — and institutional sellers (carriers, legacy holders) remain active. Price discount to APNIC is roughly per address, which, on a million-address block, is not trivial.
What is the typical deal size in the 2025 market?
The average deal covers approximately 110,498 addresses, but that figure is heavily skewed by a handful of large block trades. By count, 637 of 901 transactions (70.7%) closed below ,000, confirming that /24 and small-prefix trades dominate the market's transaction flow even as large blocks dominate dollar volume.
How does the /24 prefix size factor into the 2025 market?
The /24 (256 addresses) is the single most traded block size, representing 297 of 901 transactions — roughly one-third of all deals. It remains the minimum independently routable prefix on the global internet and serves as the market's de facto retail unit.
Is the IPv4 market trending up or down in 2025?
Down. Prices have declined approximately 1.1% from recent levels, and our forecast model — which we consider reliable — projects a year-end 2026 average of .10 per address. The near-term trajectory points to .87 next month. This is not a crash, but it is a sustained, orderly repricing.
What is driving the downward price trend?
Several converging forces: incremental IPv6 adoption reducing marginal demand, a steady release of blocks by legacy holders monetizing assets, and an expanding lease market that provides a capital-light alternative to outright purchase. The 42 deals exceeding million suggest institutional supply is entering the market at scale.
Should I buy or lease IPv4 addresses at current 2025 rates?
At current pricing, buying is the better economic decision for holders with a time horizon beyond roughly 47 months (3.9 years). A /24 costs approximately ,104 to purchase versus 0/month to lease. The buy-versus-lease breakeven is just under 4 years — well within a typical network asset lifecycle. Our verdict: buy, provided you have confidence in a 4+ year hold period.
What annual yield does leasing IPv4 addresses generate for owners?
Based on 44 observed lease transactions, the annualized yield is approximately 25.3% — a figure that would make most real-asset investors blush. Monthly lease rates average .59 per address (0 per /24), against a purchase cost of .75 per address. This yield will compress as purchase prices decline, but for now it remains exceptionally attractive for block owners willing to manage counterparty risk.
What are the risks of buying IPv4 addresses at .75 with prices projected to fall?
The obvious risk is capital depreciation. If our year-end 2026 forecast of .10 proves accurate, a buyer today faces roughly 31% mark-to-market erosion within 18-20 months. Buyers should stress-test against a declining price curve and ensure operational need — not speculative upside — justifies the purchase. The lease alternative exists precisely for organizations unwilling to take this directional bet.
What mistakes should be avoided when purchasing IPv4 blocks in 2025?
Three common errors stand out. First, overpaying for APNIC or LACNIC blocks without verifying clean routing history — the and .50 maxima observed this year suggest some buyers are paying premiums that may not be justified. Second, ignoring the transfer policy timeline; ARIN and RIPE transfers involve administrative lead times that can stretch weeks. Third, failing to escrow — the .6 million transacted this year includes enough counterparty risk to warrant professional intermediation on every deal.
Is AFRINIC a viable source of IPv4 addresses in 2025?
No. AFRINIC recorded zero priced transactions and zero registered transfers in our dataset for 2025. The region's ongoing governance difficulties and policy uncertainty have effectively frozen the transfer market. Treat AFRINIC-region blocks as illiquid until further notice.
How does RIPE compare to ARIN in transfer activity?
RIPE leads in total registered transfers at 5,406 versus ARIN's 4,910, capturing 59.7% of all transfer-hub activity over the trailing 36-month window. However, ARIN dominates in priced transaction volume (3.76 million IPs vs. RIPE's 1.05 million). The interpretation: RIPE sees more administrative and intra-group transfers, while ARIN handles the big dollar-weighted market deals.
What is the price range for IPv4 addresses across all regions in 2025?
The observed range is to per address. ARIN shows the widest spread (–), reflecting the diversity of block sizes and seller motivations in North America. LACNIC is the tightest band (.50–.50), consistent with a small, relationship-driven market with only 45 transactions recorded.
Which countries are most active in the IPv4 transfer market?
The United States dominates at 16% of observed country-tagged activity, followed by Canada and the United Kingdom at 3% each. Bulgaria, Russia, Germany, and Italy each register at 1%. The US concentration is unsurprising given ARIN's 48.8% transaction share and the sheer depth of the North American installed base.
What does the deal-size distribution tell us about market structure?
The market is bimodal. The 637 sub-K deals generated only .4 million in aggregate value, while 42 transactions exceeding million accounted for .7 million — 93% of total market value from fewer than 5% of deals. This is a market with a long retail tail and a short, fat institutional head.
Will IPv6 adoption make IPv4 addresses worthless?
Not in any investable time horizon. IPv6 has been 'imminent' for over a decade. While adoption is incrementally reducing marginal IPv4 demand — and is a factor in the current downward price trend — dual-stack requirements, legacy infrastructure, and IoT device addressing will sustain IPv4 demand well beyond 2030. Our year-end 2026 forecast of .10 implies continued value, not a zero.
What risks does a declining price forecast pose for IPv4 lessors?
If addresses depreciate toward .10 by late 2026, the current 25.3% annualized lease yield on a .75 cost basis rises to an even more attractive headline number — but the replacement cost of blocks falls, potentially compressing lease rates as new entrants undercut incumbents. Lessors should lock in longer-term lease agreements now while tenants are still calibrated to current rate cards.
How long does a typical IPv4 transfer take to complete?
Timeline varies by RIR. ARIN and RIPE transfers generally close within 2-6 weeks once documentation is submitted, though complex deals involving needs-based justification (ARIN's legacy policy) can take longer. APNIC and LACNIC transfers can be faster for smaller blocks but lack the depth of intermediary infrastructure available in North America and Europe.
Are large IPv4 blocks (/16 and above) still available in 2025?
Yes, but the premium end of the market is thin. The 42 transactions exceeding million collectively represent over .7 million in value and approximately 92.7 million / .75 ≈ 3.3 million addresses. Large blocks trade, but they trade bilaterally and often off-market. Expect longer negotiation cycles and heavier diligence requirements.
What are the risks of purchasing IPv4 addresses from under-regulated RIR regions?
The primary risks are routing integrity, blacklist contamination, and policy clawback. Blocks sourced from regions with weaker governance (or, in AFRINIC's case, near-frozen policy frameworks) may carry hidden encumbrances. Due diligence on WHOIS history, Spamhaus listings, and BGP routing stability is non-negotiable — the -to- price spread in 2025 reflects, in part, quality differentials that buyers ignore at their peril.
How reliable is the price forecast of .10 by year-end 2026?
We rate forecast reliability as high, based on trend persistence, transfer volume data across 10,316 observed transfers, and the consistency of the downward price signal across RIRs. That said, exogenous shocks — a major carrier liquidation, regulatory changes, or an acceleration in IPv6 mandates — could steepen or reverse the curve. Use .10 as a base case, not a certainty.
What should sellers consider before listing IPv4 assets in a declining market?
Time is not your friend. With prices projected to fall from .75 today toward .10 by late 2026, every quarter of delay costs approximately per address in foregone value on a representative block. Sellers sitting on clean, well-routed ARIN or RIPE blocks should move decisively. The alternative — leasing at 25.3% yield while the asset depreciates — is viable but requires active management and tenant credit assessment.
How does the IPv4 lease market compare across RIRs?
Lease data is concentrated in RIPE, where we observed a monthly rate of .59 per address (0 per /24) across 44 sample transactions. ARIN, APNIC, LACNIC, and AFRINIC lease markets are either too opaque or too thin to produce reliable pricing. The RIPE lease market's relative transparency makes it the best benchmark for global lease rate assumptions, though ARIN lessees should expect comparable or slightly lower rates given the purchase price discount.