14 min read
This report analyzes the IPv4 transfer market for Q2 2025, based on completed IPv4Center marketplace transactions and official RIR transfer records.
Executive Summary
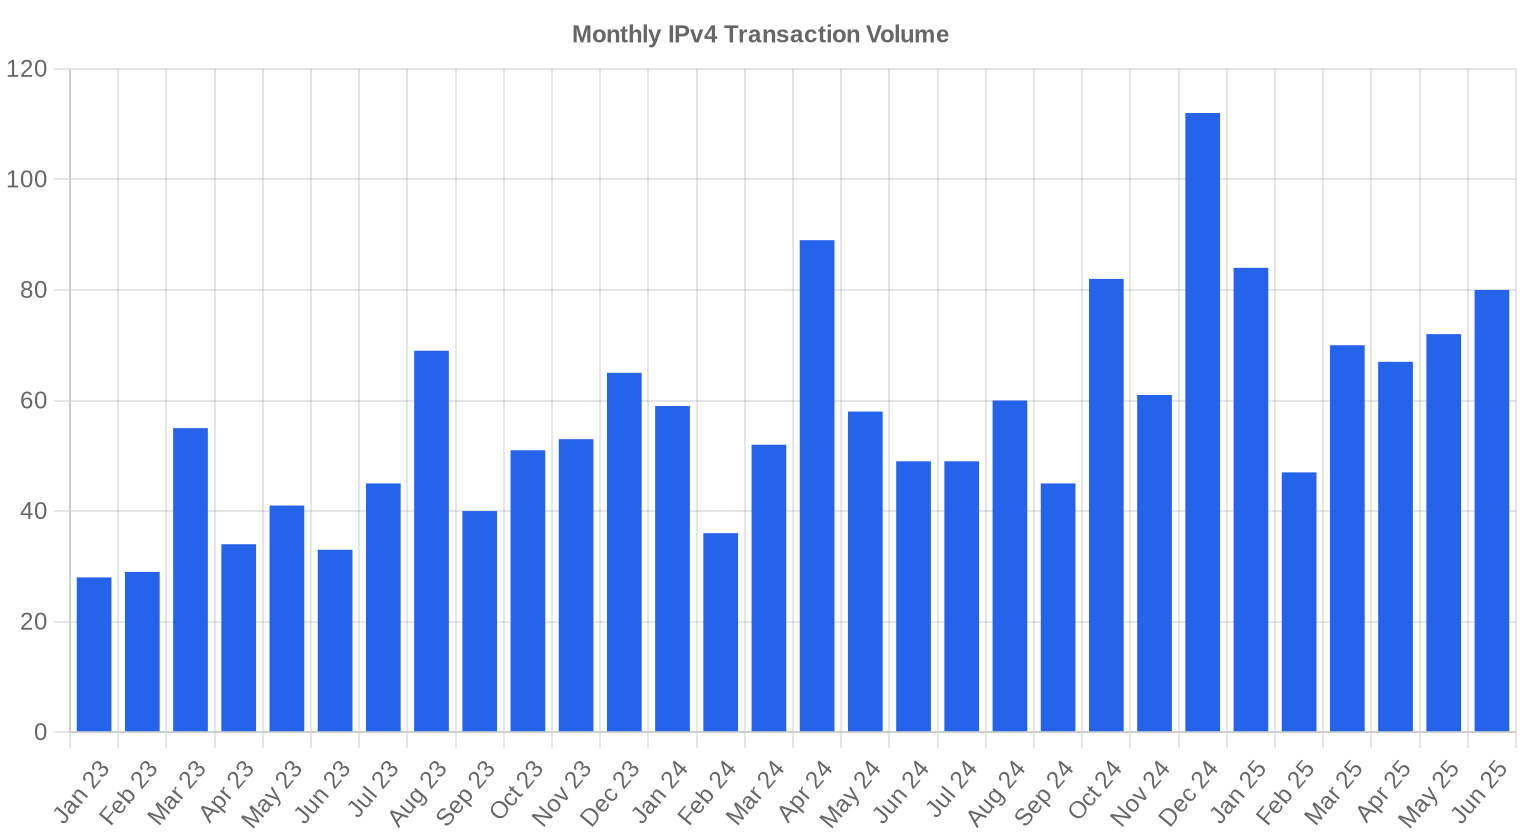
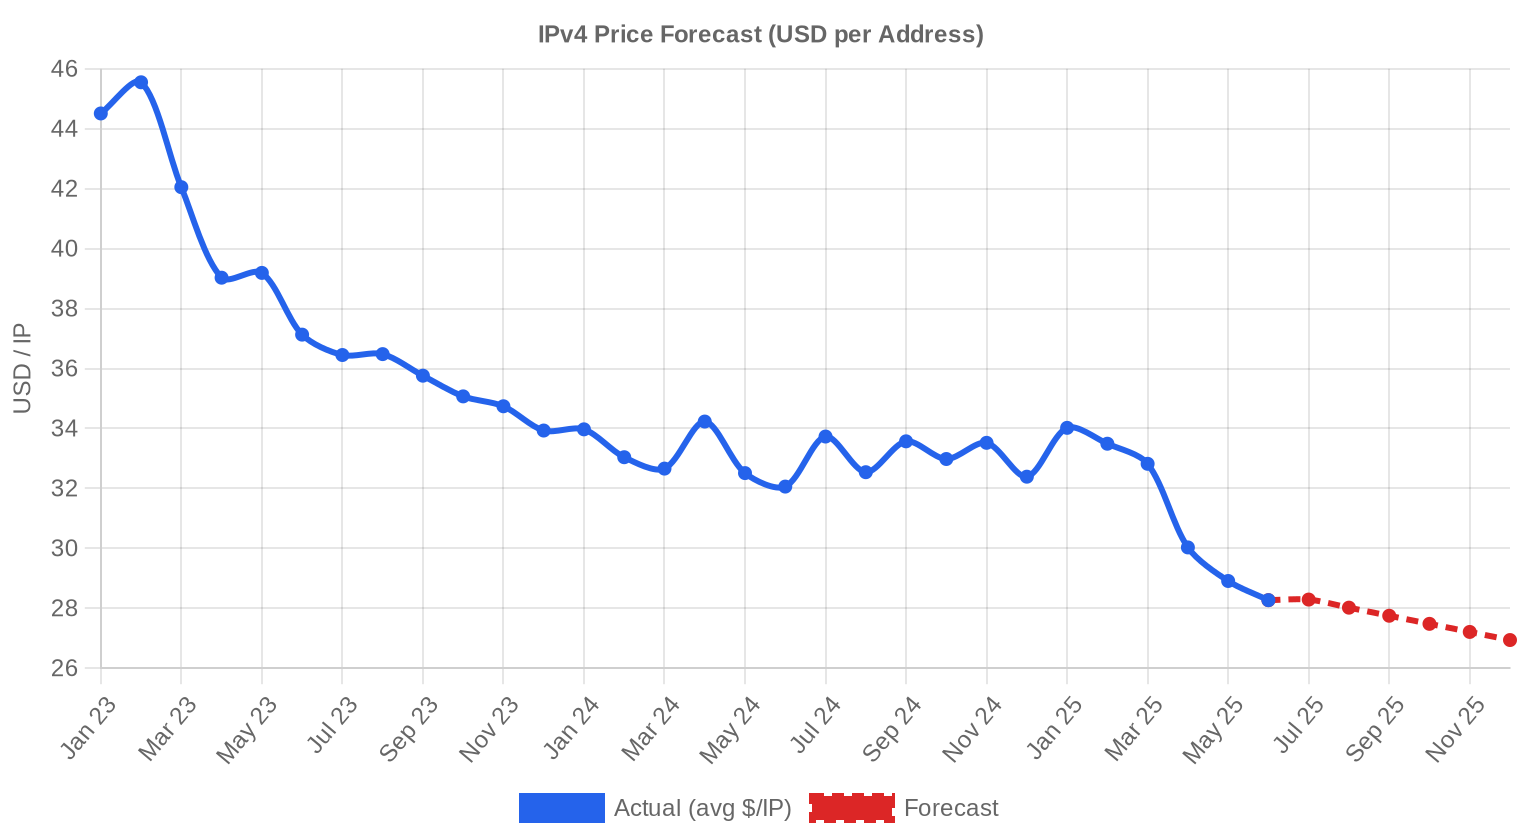
The IPv4 transfer market moved 1,219,840 addresses across 219 transactions in Q2 2025, generating $26.8 million in aggregate value. The average price landed at $29.02 per IP — down 13.3% from Q1 2025 and 12.5% below Q2 2024 levels. The median held at $29, confirming the average isn't being dragged by outliers. This is the fourth consecutive quarter of declining prices, and the trend shows no sign of reversing. Volume was up modestly — 9 more transactions than the prior quarter — but the real story remains the persistent erosion in per-IP pricing.Market Overview
| Transactions | 219 |
| IP Addresses Traded | 1,219,840 |
| Estimated Market Value | $26,772,793 |
| Average Price / IP | $29.02 |
| Median Price / IP | $29.00 |
| RIR Transfers | 1,974 |
Year-over-Year Comparison
| Metric | This period | A year earlier (Q2 2024) | Change |
|---|---|---|---|
| Transactions | 219 | 196 | +11.7% |
| IP Addresses Traded | 1,219,840 | 393,984 | +209.6% |
| Estimated Market Value | $26,772,793 | $13,283,978 | +101.5% |
| Average Price / IP | $29.02 | $33.18 | -12.5% |
| RIR Transfers | 1,974 | 2,243 | -12.0% |
Price Dynamics
Prices ranged from $17.80 to $40.00 per IP during the quarter, a $22.20 spread that reflects wide variation across block sizes, RIRs, and deal urgency. The floor has dropped meaningfully: $17.80 marks the lowest transaction price we've recorded in several quarters, likely a large ARIN block sold under time pressure. The $40 ceiling was hit on what appears to be a small, clean ARIN allocation — the kind of premium that small-block scarcity still commands. Regression trend is firmly negative, with the quarter-over-quarter decline of 13.3% accelerating from the pace we saw in late 2024. The spread between small-block premiums and bulk pricing is widening, creating what amounts to two distinct sub-markets operating under the same headline number.
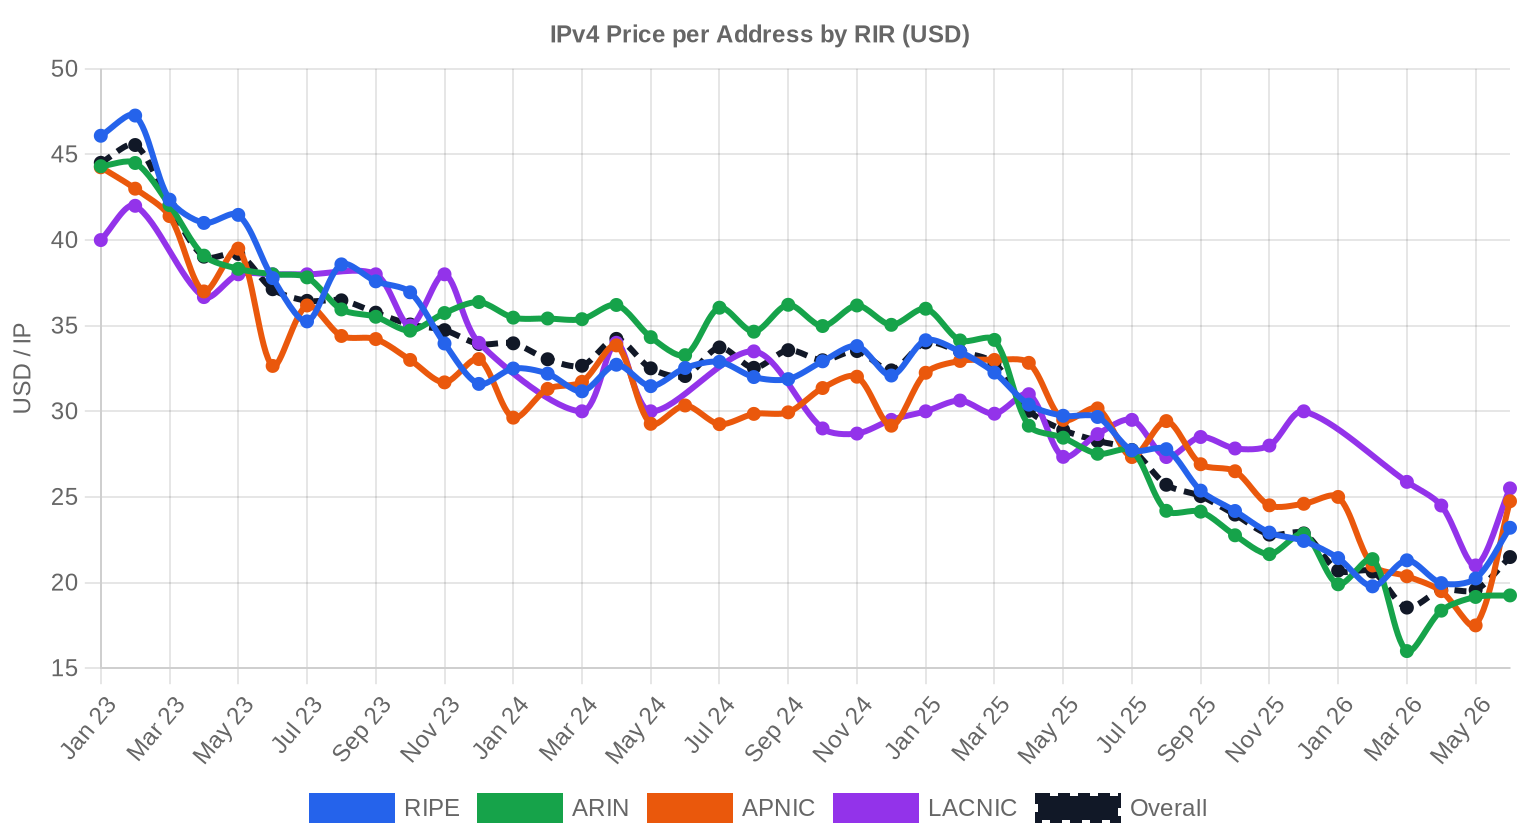
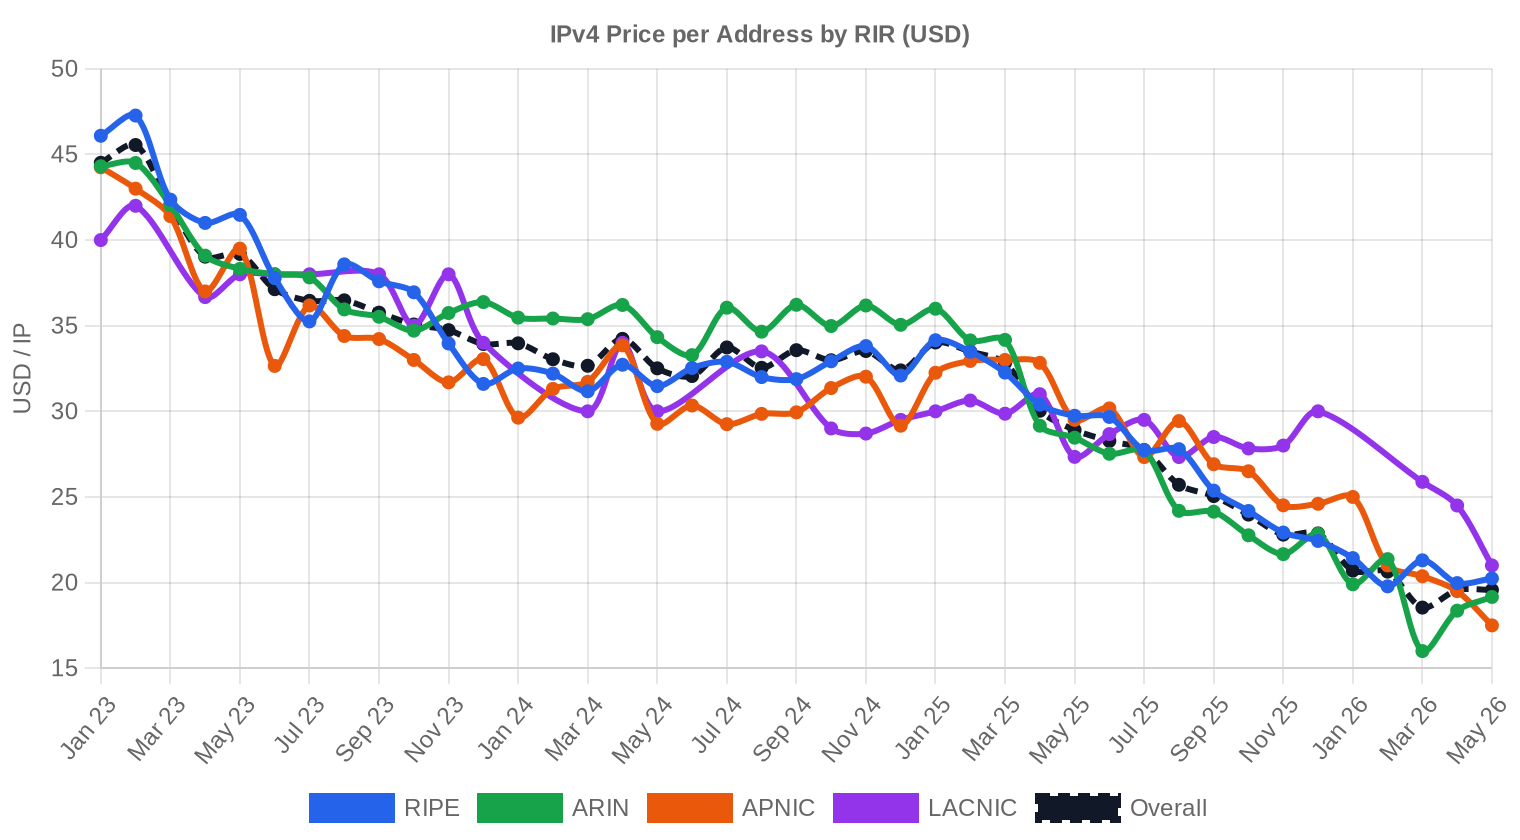
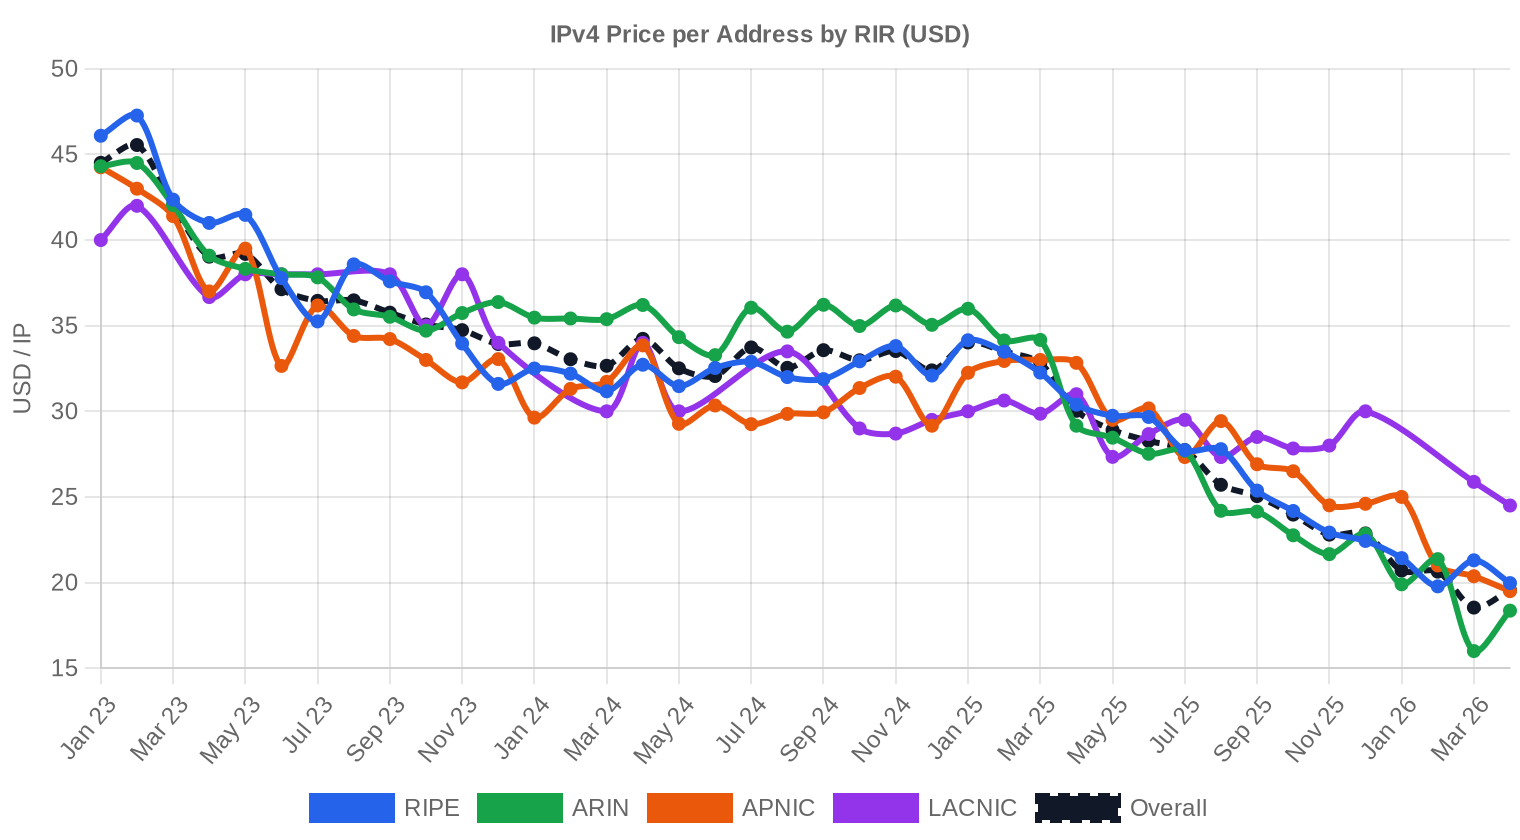
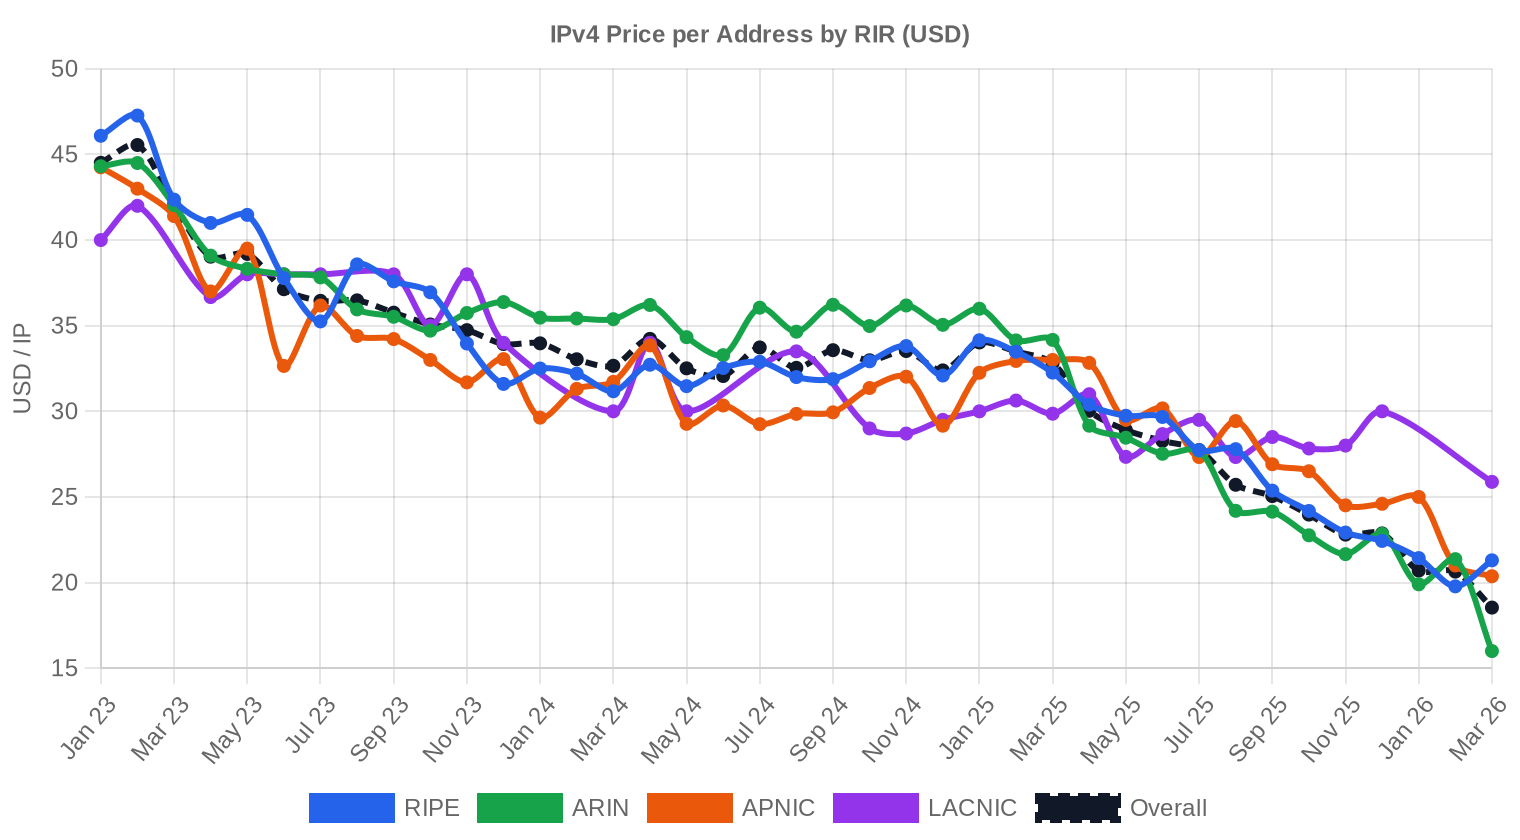
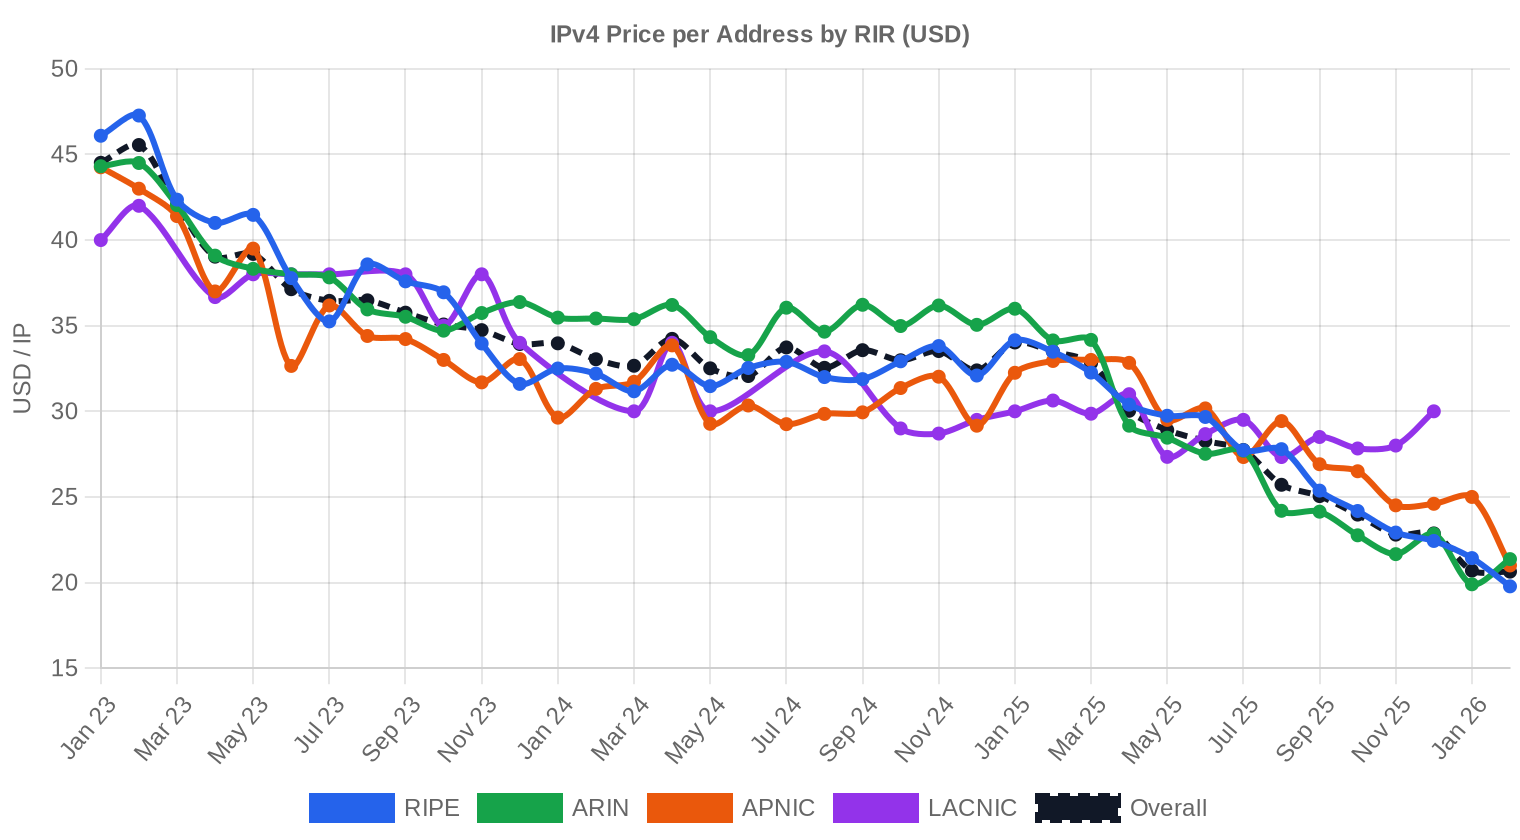
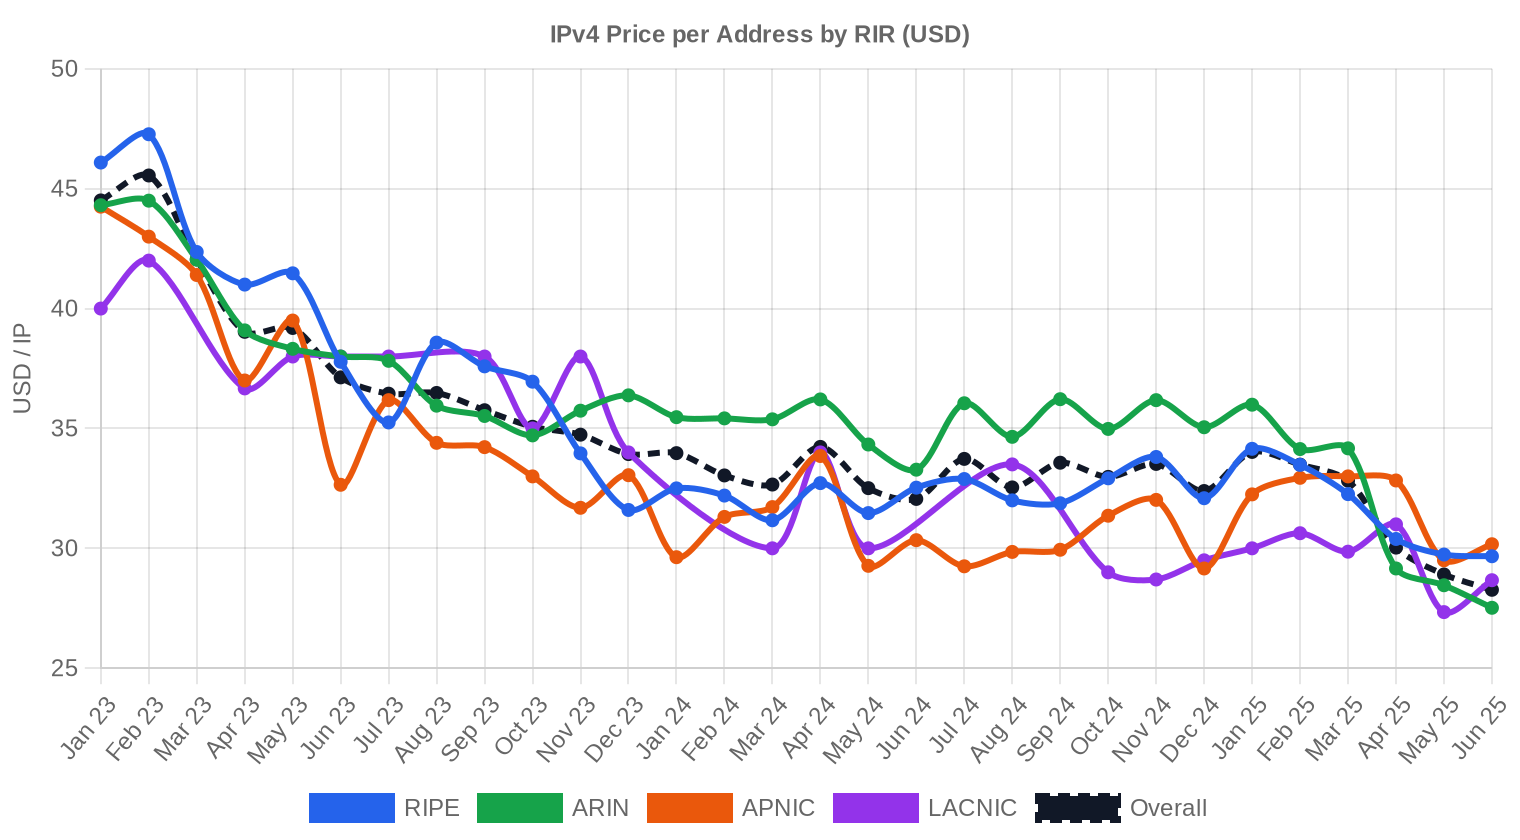
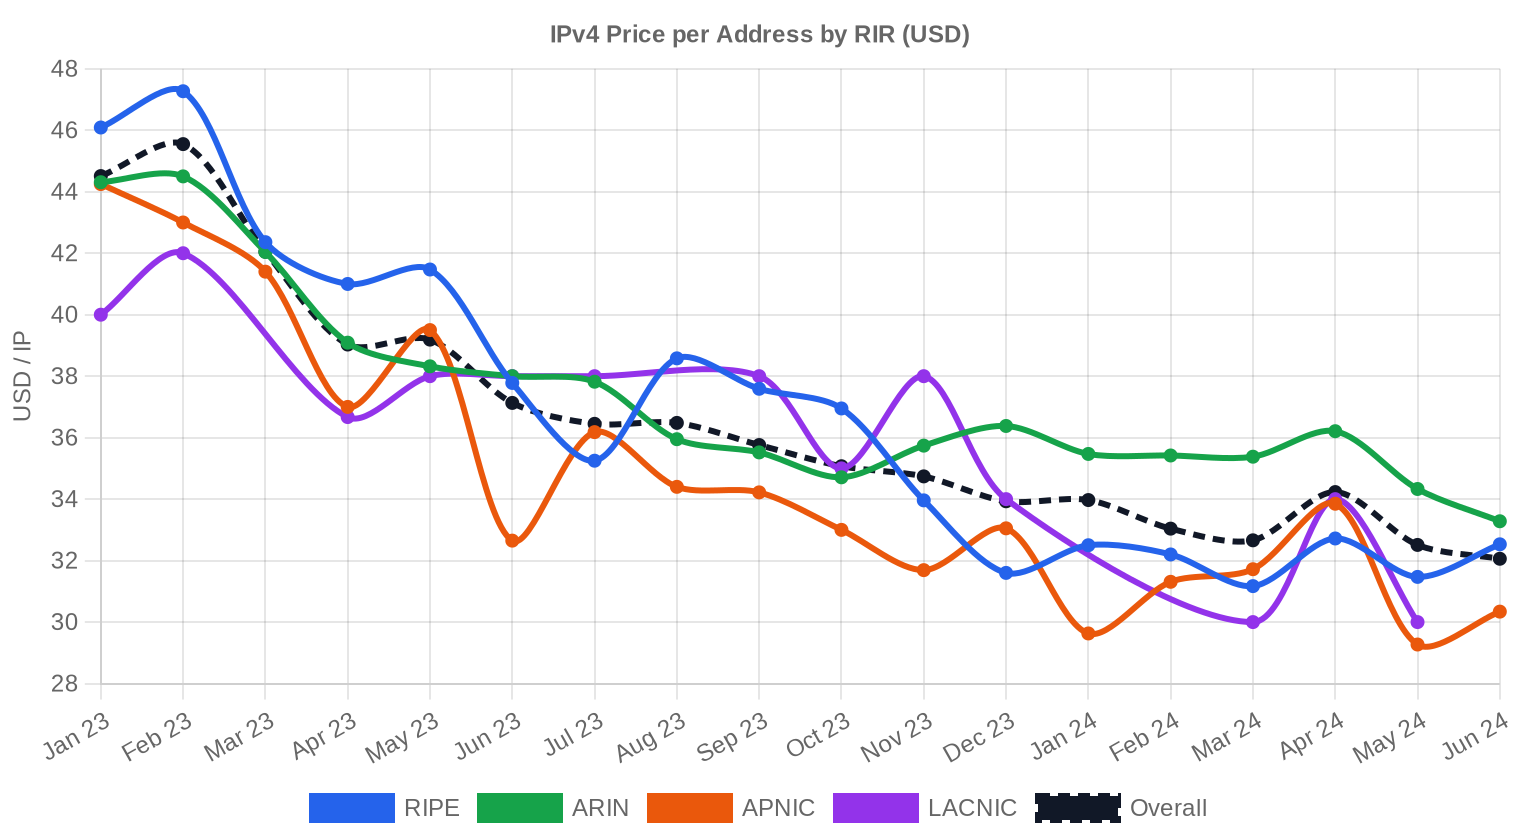
Pricing by RIR
ARIN dominated volume as usual, accounting for 57.5% of all transacted IPs, but its average price of $28.27 was the second-lowest among active registries. APNIC commanded the highest average at $31.19, though on thin volume — just 13 transactions covering 18,688 IPs. RIPE sat in between at $29.97, with a tighter range ($19.50–$37.00) that reflects more standardized block characteristics and the discipline imposed by the 24-month holding rule. LACNIC contributed 8 deals for 2,048 IPs at $28.79 average — a rounding error in the overall market but consistent with prior quarters. AFRINIC recorded zero transactions for the period.ARIN: $28.27/IP across 126 transactions (81.8% of IP volume).
RIPE: $29.97/IP across 72 transactions (16.5% of IP volume).
APNIC: $31.19/IP across 13 transactions (1.5% of IP volume).
LACNIC: $28.79/IP across 8 transactions (0.2% of IP volume).
AFRINIC: No recorded transactions.
| RIR | Transactions | Avg $/IP | Median $/IP | IPs Traded | RIR Transfers | Next Month (proj.) | Year-End (proj.) |
|---|---|---|---|---|---|---|---|
| RIPE | 72 | $29.97 | $30.00 | 201,728 | 1,136 | $28.50 | $27.50 |
| ARIN | 126 | $28.27 | $28.00 | 997,376 | 838 | $26.50 | $26.00 |
| APNIC | 13 | $31.19 | $30.00 | 18,688 | 0 | $30.00 | $30.00 |
| LACNIC | 8 | $28.79 | $29.00 | 2,048 | 0 | $29.00 | $28.50 |
Transaction Volume

Supply & Block Sizes
/24 blocks dominated deal flow with 73 transactions — one-third of all trades. This isn't surprising: /24s remain the minimum useful allocation for most enterprises and small ISPs, and they carry the highest per-IP premium precisely because of that utility. Larger blocks (/16 and above) drove the bulk of dollar volume but accounted for far fewer transactions, consistent with the institutional character of the large-block market.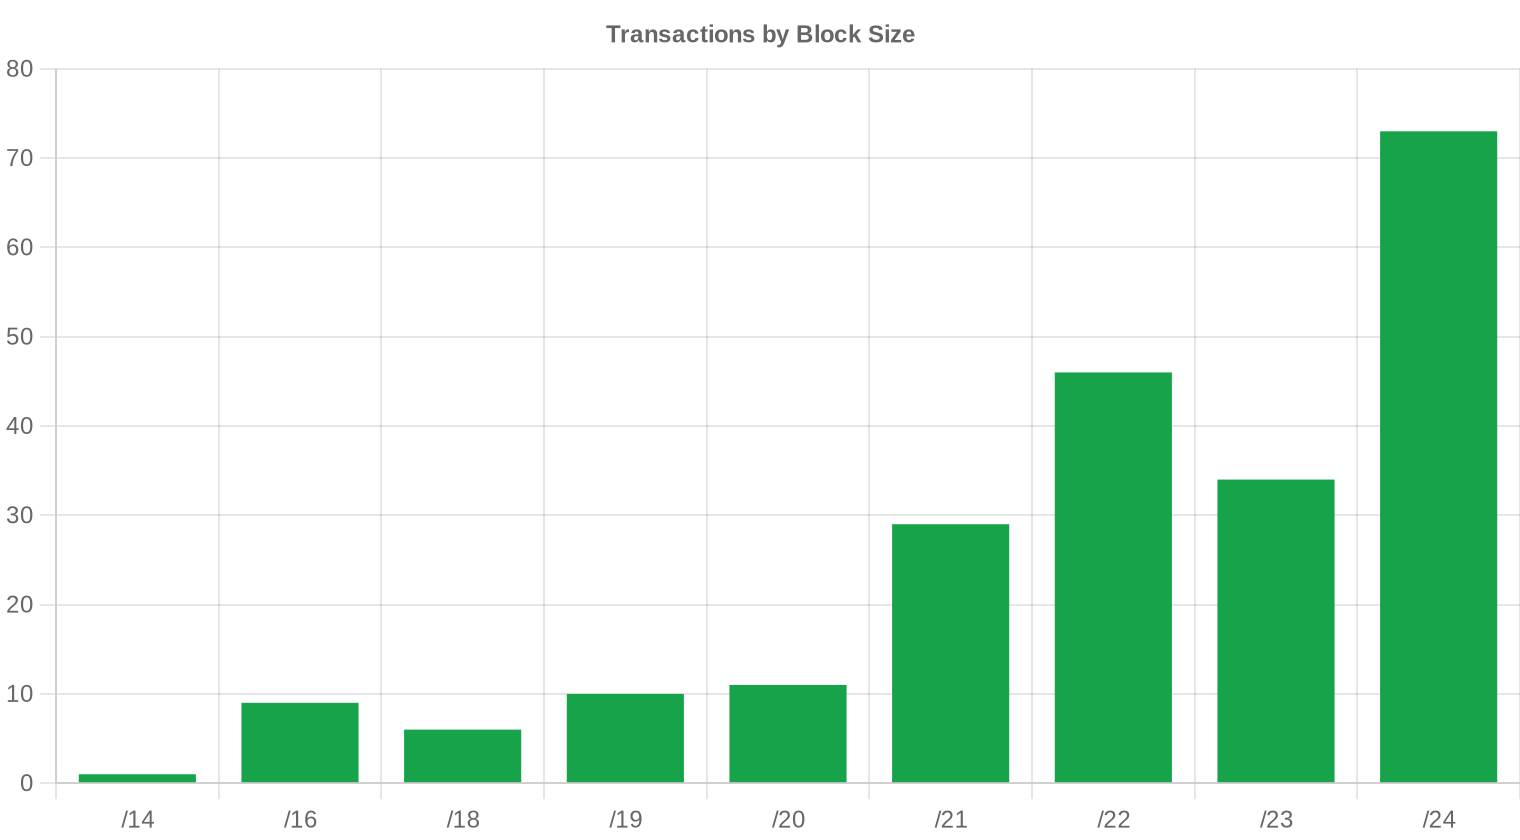
Geographic Activity
Country-level distribution data was not available for Q2 2025. Based on RIR share, North American entities (ARIN region) accounted for the majority of activity, followed by European buyers and sellers operating through RIPE NCC. The Asia-Pacific region, while commanding premium pricing, remained a relatively thin market in absolute terms.Registry Transfer Activity
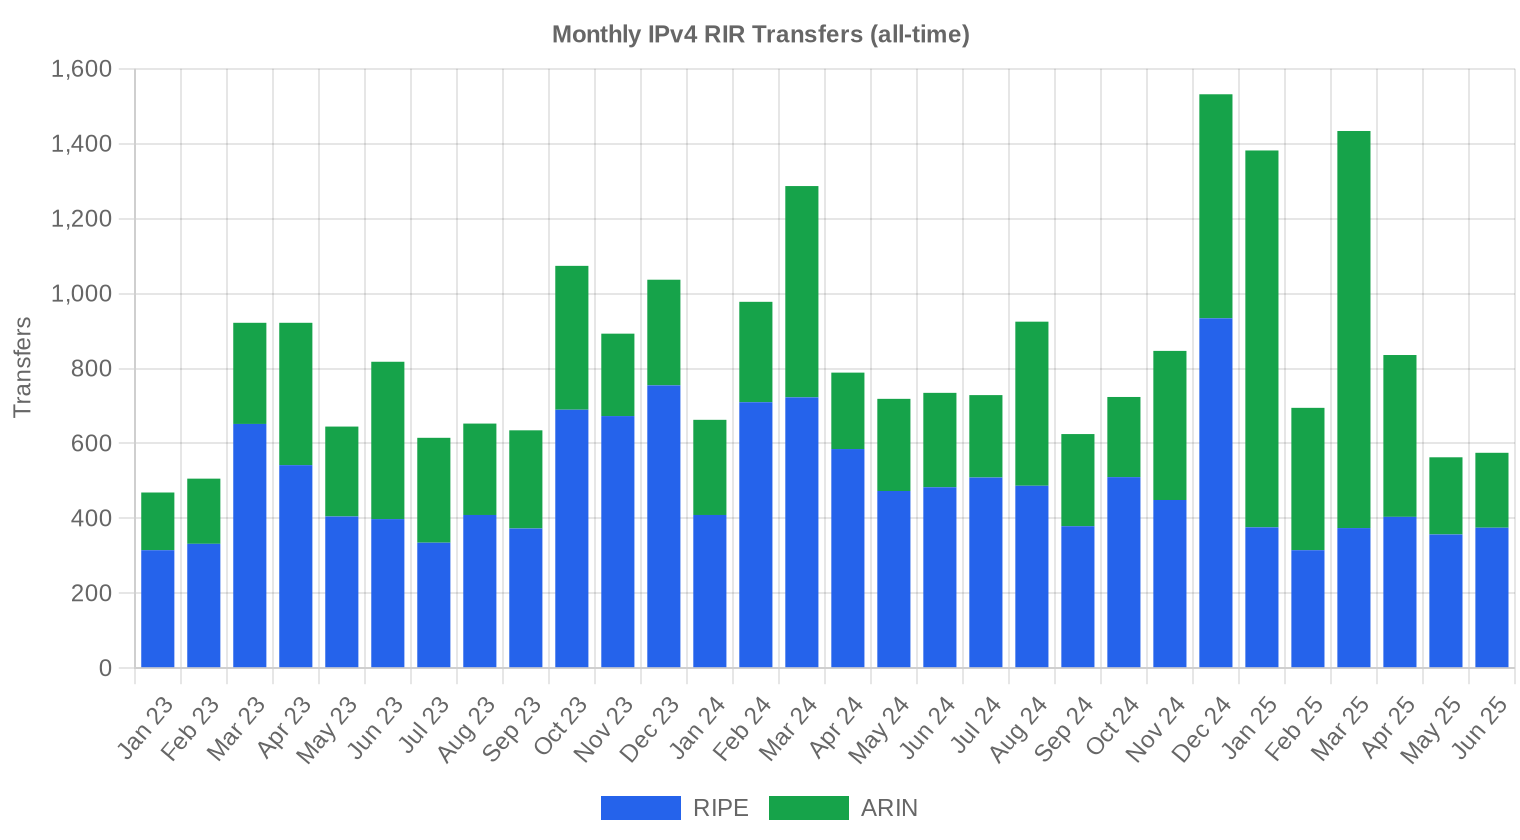
Official RIR transfer registries recorded 1,974 transfers in Q2 2025 — a figure that exceeds our transaction count because it includes intra-company moves, mergers, and non-market transfers. RIPE led with 1,136 recorded transfers, representing 57.5% of all registry activity. ARIN followed at 838 transfers. Neither APNIC, LACNIC, nor AFRINIC reported transfer figures for the period.Long-Run Transfer Trends
Over the trailing 30 months, we have tracked 25,227 total RIR transfers. The peak month was December 2024, consistent with the year-end pattern we see every cycle — companies closing deals before fiscal year-end and tax deadlines. RIPE has consistently accounted for the lion's share at 58.4% of cumulative transfers versus ARIN's 41.6%, a split that partly reflects RIPE's more granular transfer reporting.| RIR | RIR Transfers |
|---|---|
| RIPE | 14,731 |
| ARIN | 10,496 |
| RIR Transfers | 25,227 |
Outlook & Forecast
Forecasting each block-size band and RIR separately with our AI model:
The overall average price per IP is projected to reach $26.94 by December 2025, with a next-month estimate of $27.59 per IP.
- RIPE: projected at $28.50 per IP next month, trending toward $27.50 by December 2025.
- ARIN: projected at $26.50 per IP next month, trending toward $26.00 by December 2025.
- APNIC: projected at $30.00 per IP next month, trending toward $30.00 by December 2025.
- LACNIC: projected at $29.00 per IP next month, trending toward $28.50 by December 2025.
- AFRINIC: insufficient data for a reliable forecast.
Forecast by Block Size
| Block | Current $/IP | Next Month | Year-End | Confidence |
|---|---|---|---|---|
| /24 | $29.00 | $29.00 (0.0%) | $28.00 (-3.4%) | medium |
| /23 | $29.75 | $29.50 (-0.8%) | $29.00 (-2.5%) | medium |
| /22 | $27.00 | $27.00 (0.0%) | $26.00 (-3.7%) | medium |
| /21 | $26.00 | $26.00 (0.0%) | $25.50 (-1.9%) | medium |
| /20 | $27.00 | $27.00 (0.0%) | $28.00 (+3.7%) | low |
| /19 | $24.50 | $25.00 (+2.0%) | $25.00 (+2.0%) | low |
| /18-/16 | $22.00 | $22.00 (0.0%) | $22.00 (0.0%) | low |
| /15-up | $17.80 | $18.00 (+1.1%) | $18.00 (+1.1%) | low |
Editor's Take: Buy vs. Lease
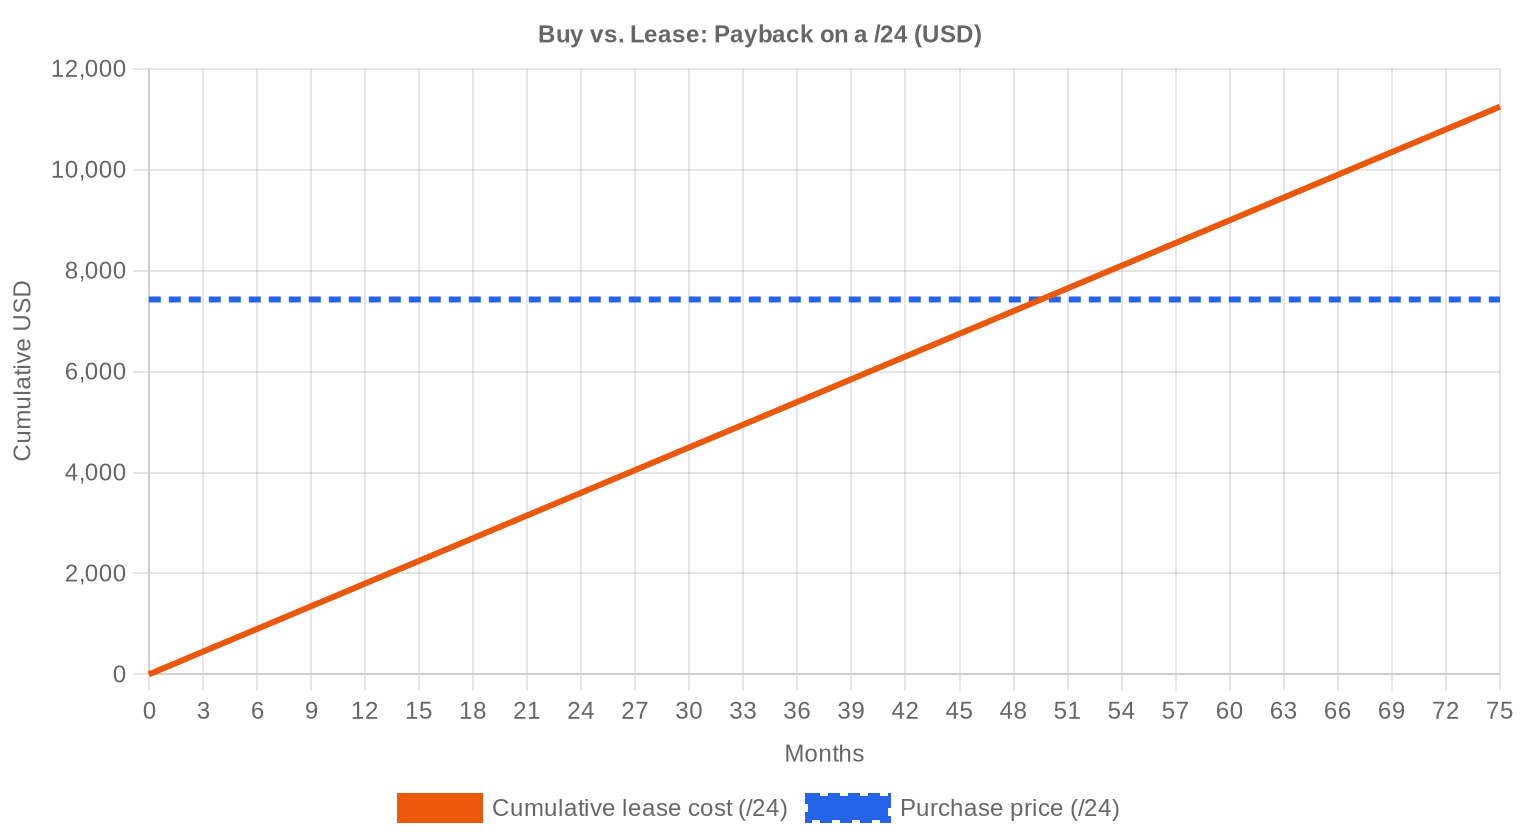
The buy-versus-lease calculus has shifted this quarter. At $29.02 per IP and a lease rate of $0.5859/month, the breakeven sits at 49.5 months — just over four years. That's a reasonable payback for any organization with a planning horizon beyond 2029. The implied annual yield of 24.2% on a purchased block leased back to the market dwarfs virtually every fixed-income alternative available today. Our recommendation is to buy if you have a medium-term need (3+ years) and available capital. Leasing still makes sense for short-duration projects, testing environments, or organizations that can't stomach the upfront outlay of $7,429 for a /24. But the math favors ownership, and declining prices mean the entry point keeps getting better for buyers willing to act.| /24 Purchase price | $7,429 |
| /24 Lease price | $150 / mo |
| Payback period | 49.5 mo (4.1 yr) |
| Gross annual yield | 24.2% |
What This Means for You
Buyers: This is a buyer's market. Prices are down 12.5% year-over-year with further declines projected. If you've been waiting for a pullback, you're in one. Don't anchor to 2023 prices — the market has repriced structurally, and waiting for $20/IP may mean missing blocks that fit your allocation needs.Sellers: Every quarter you hold is a quarter of depreciation at current trajectory. If you're sitting on unused space, the revenue-maximizing move is to sell now or lease immediately — holding idle blocks is a losing strategy in a declining-price environment.
Leasers: Monthly rates around $0.59/IP ($150/month for a /24) remain stable. If your needs are under four years, leasing avoids capital risk. But check the breakeven: at 49.5 months, buying starts winning fast.
Block holders: The 24.2% annual yield from leasing is exceptional. If you own clean blocks and aren't using them, you should be generating income from them. The carrying cost of doing nothing is real.
Browse verified IPv4 blocksSell IPv4 →
List your blocks with managed transferLease IPv4 →
Flexible short-term capacityLease Out IPv4 →
Turn idle blocks into recurring revenue
IPv4 Pricing by Block Size
Per-IP pricing varies dramatically with block size. /24s (256 IPs) transacted at the highest per-IP rate, reflecting the scarcity premium for the smallest routable block. Larger allocations — /20s and above — traded at meaningful discounts to the $29 average, with some large ARIN blocks clearing below $20/IP. The current /24 price of roughly $7,429 per block represents a 30–40% premium per IP versus a /16 purchased in bulk.| Block | IPs | Buy: /IP | Buy: Total | Lease: /IP/mo | Lease: Monthly |
|---|---|---|---|---|---|
| /24 | 256 | $35–45 | $8,960–11,520 | $0.38–0.50 | $97–128 |
| /22 | 1,024 | $28–38 | $28,672–38,912 | $0.33–0.45 | $338–461 |
| /20 | 4,096 | $22–32 | $90,112–131,072 | $0.30–0.40 | $1,229–1,638 |
| /18 | 16,384 | $20–30 | $327,680–491,520 | $0.30–0.38 | $4,915–6,226 |
| /16 | 65,536 | $18–28 | $1,179,648–1,835,008 | $0.30–0.35 | $19,661–22,938 |
IPv4 Price History: 2011–2026
IPv4 addresses were effectively free before IANA exhaustion in 2011. Prices climbed steadily through the 2010s, accelerating sharply from 2019 to 2022, when the market peaked near $55–$60/IP for mid-size blocks. AWS's decision to begin charging $0.005/hour for public IPv4 in February 2024 marked a psychological and practical turning point — large cloud customers began returning addresses, softening demand. The market has bifurcated since: small blocks hold value better than large ones, and APNIC/RIPE addresses trade at premiums to ARIN.| Year | ~Price/IP | Key Event |
|---|---|---|
| 2011 | $7–12 | IANA free pool exhausted; Microsoft/Nortel deal ($11.25/IP) |
| 2012 | $8–12 | RIPE NCC reaches last /8; begins /22-only allocation |
| 2014 | $10–15 | LACNIC free pool exhausted |
| 2015 | $8–15 | ARIN free pool exhausted |
| 2017–18 | $12–18 | Leasing market grows; cloud demand rises |
| 2019 | $18–24 | RIPE NCC exhausts remaining free pool |
| 2021–22 | $50–60+ | Post-pandemic peak; hyperscaler build-outs |
| 2024 | $35–52 | AWS IPv4 charge ($0.005/IP/hr); large block correction |
| 2025–26 | $18–45 | Market bifurcation; /16s below $20 for first time since 2019 |
Market Structure: Who Is Buying & Selling
The buy side is increasingly dominated by mid-tier ISPs, hosting companies, and regional cloud providers who need routable space but lack the scale to justify IPv6-only infrastructure. Legacy holders — corporations, universities, and government agencies with allocations from the 1990s — remain the primary supply source. Bankruptcy estates and M&A activity contribute opportunistic blocks, often in larger sizes that clear at discounted per-IP rates.IPv4 vs. Other Asset Classes
At a 24.2% implied annual yield from lease-back, IPv4 addresses outperform virtually every traditional asset class on a current-income basis. Ten-year Treasuries yield around 4.5%; commercial real estate cap rates sit in the 6–8% range; even high-yield credit barely touches 8%. The catch is depreciation risk — if per-IP prices continue falling at 12–13% annually, your total return erodes. Think of IPv4 as a high-yield, depreciating asset — more like specialized equipment than real estate.| Asset Class | Typical Yield | Liquidity | Primary Risk |
|---|---|---|---|
| IPv4 | 24.2% | Moderate | IPv6 adoption, block quality |
| Commercial Real Estate | 5–8% | Low | Vacancy, rate cycle |
| Investment-Grade Bonds | 4–5% | High | Duration, credit risk |
| S&P 500 | ~1,3% | High | Market volatility |
| Money Market / T-Bills | ~4–5% | High | Rate cycle changes |
IPv6 Adoption & Why IPv4 Remains Essential
IPv6 adoption continues its slow crawl. Google reports roughly 45% of its traffic arriving over IPv6, but the enterprise and SMB segments lag far behind. The practical reality is that IPv4 will remain essential infrastructure for at least another decade — dual-stack is the norm, not a transition strategy. As long as significant portions of the internet are IPv4-only, addresses will retain operational value regardless of price trends.AI & Cloud Infrastructure Demand
AI infrastructure buildout is generating incremental IPv4 demand, particularly from inference providers who need public-facing endpoints. Training clusters are largely internal and don't require routable IPv4, but the proliferation of API-serving GPU farms, edge inference nodes, and AI-integrated SaaS platforms is adding net new demand. This is a tailwind, but not yet large enough to offset the broader pricing decline driven by cloud returns and efficiency gains.What Determines IPv4 Block Value
Block value depends on several factors beyond raw size. Clean reputation — no blacklist history, no spam associations — commands a premium that can reach 15–20% over comparable dirty blocks. Allocation age matters: older blocks are generally cleaner but may have fragmented WHOIS records. RIR jurisdiction affects transferability and regulatory burden, with ARIN blocks being the most liquid and AFRINIC blocks essentially untradeable. Contiguous space always trades better than fragmented equivalents.Sell vs. Lease: A Decision Framework
In a falling-price market, selling locks in today's value while leasing bets on stable or rising prices. If you believe the year-end forecast of $26.94, selling now at $29 protects $2/IP of value — roughly $500 on a /24. Leasing makes sense if you plan to hold regardless and want income while the asset depreciates, especially given the 24.2% annualized yield. The hybrid play — sell some blocks, lease others — is probably the right answer for holders with multiple allocations.| /24 Purchase price | $7,429 |
| /24 Lease price | $150 / mo |
| Payback period | 49.5 mo (4.1 yr) |
| Gross annual yield | 24.2% |
RIPE NCC 24-Month Transfer Restriction
RIPE NCC's 24-month holding requirement before transfer constrains the speculative flipping that characterized earlier market cycles. It reduces short-term supply elasticity, which helps explain why RIPE addresses trade at a $1.70/IP premium to ARIN — buyers are paying for the reduced churn risk. The rule also creates a natural lag in supply response: even if prices surge, new RIPE supply can't reach market for two years.Deal Size Distribution
Average deal size rose to $122,250, up 7.2% from $114,064 in Q1 2025 and up 80.4% from $67,775 in Q2 2024. The increase reflects a shift toward larger blocks: 10 transactions exceeded $1 million, accounting for $24.7 million — fully 92% of total market value. At the other end, 153 transactions fell below $50,000, representing 70% of deal count but just 9% of dollar volume. The market is increasingly bifurcated between high-volume institutional trades and a long tail of small-block retail activity.Top Trading Countries
Country-level transaction data was not reported for Q2 2025. Historically, the United States dominates ARIN-region activity, followed by Canada. Within RIPE territory, the UK, Germany, and the Netherlands consistently rank as the most active markets, driven by dense hosting and data center ecosystems. APNIC-region activity tends to concentrate in Australia, India, and Southeast Asian markets where IPv4 scarcity is most acute.BEAD Broadband Program Impact
The $42.45 billion BEAD program is beginning to move from planning into procurement phases across multiple US states. Rural broadband buildouts funded by BEAD will require IPv4 allocations for CPE management, CGNAT infrastructure, and subscriber assignment — predominantly in the /20 to /17 range. As awards convert to active network construction through 2025–2027, expect BEAD-driven demand to tighten supply for mid-size ARIN blocks specifically, potentially creating a price floor under that segment even as the broader market declines.Hyperscaler IPv4 Holdings
Amazon, Microsoft, and Google collectively hold tens of millions of IPv4 addresses — AWS alone controls an estimated 100+ million. AWS's public IPv4 charging policy, introduced in early 2024, has prompted customers to release unused addresses, adding supply back into the ecosystem. If any hyperscaler decided to monetize even 5% of its holdings, the market impact would be material — several quarters of normal transaction volume hitting the market at once. This overhang is one reason we remain bearish on medium-term pricing.Macroeconomic Conditions & Market Impact
Elevated interest rates have made the capital cost of IPv4 purchases more relevant — at 5% financing, a $7,429 /24 carries roughly $370/year in opportunity cost. Enterprise IT budgets are cautiously expanding in 2025 after two years of consolidation, but IPv4 procurement remains a low priority versus AI and security spending. The overall macro environment is modestly negative for IPv4 demand: tighter money favors leasing over buying, and corporate belt-tightening pushes efficiency over expansion.Model Update & Calibration
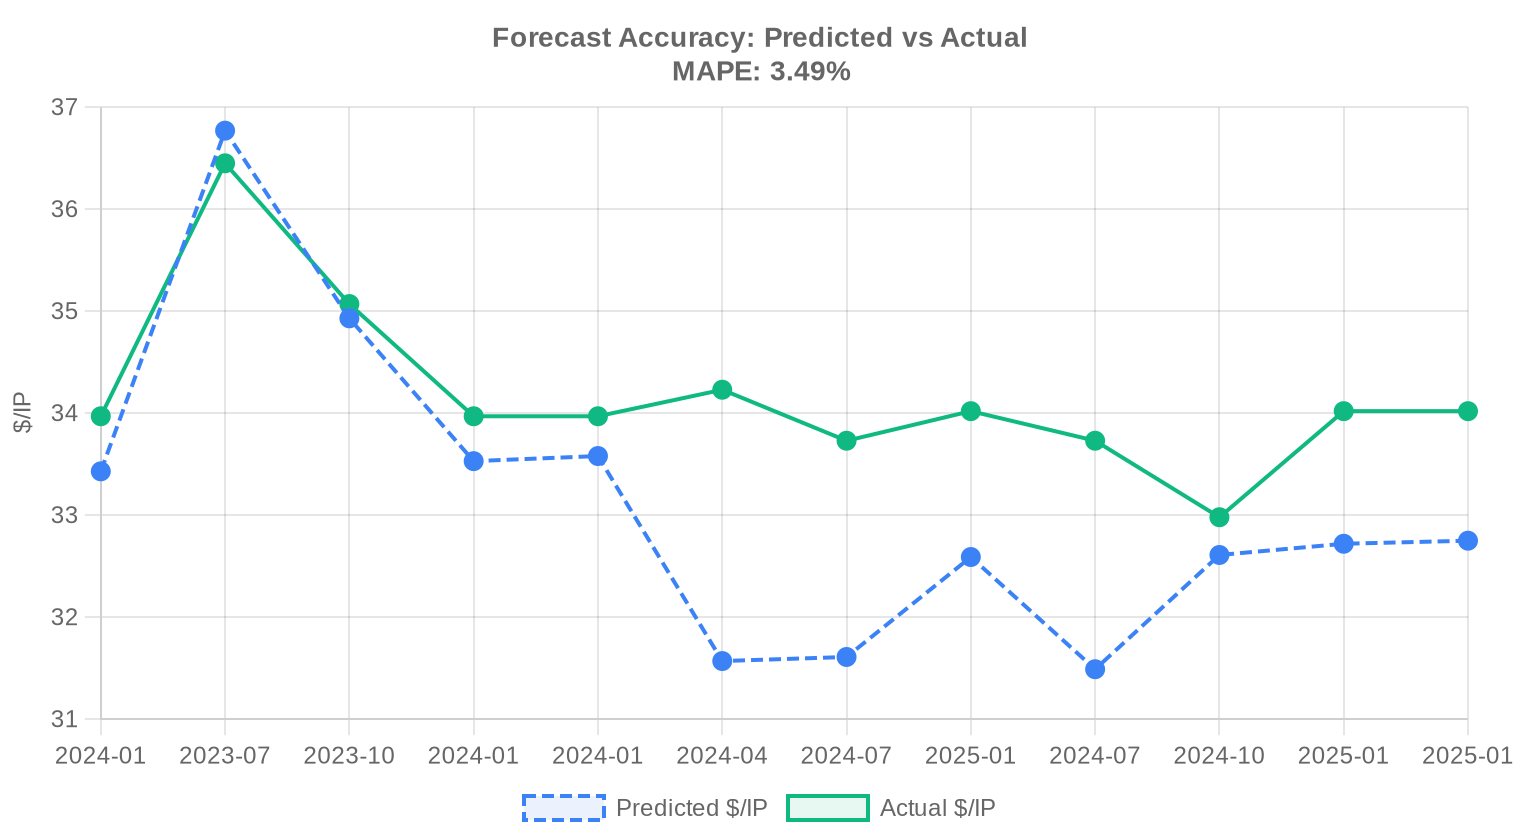
We reviewed our past projections against actual market outcomes and recalibrated the model for this report. The updated model places more weight on recent price movements using exponential decay, dynamically adjusts prediction bands to reflect current market conditions, and corrects for any systematic bias detected in earlier forecasts. The predicted-vs-actual comparison chart below shows how closely our past estimates tracked reality.
| Report Period | Target Month | Predicted | Actual | Deviation |
|---|---|---|---|---|
| 2024-H1 | 2024-07 | $32 | $34 | -6% |
| 2024 | 2025-01 | $33 | $34 | -4% |
| 2024-Q2 | 2024-07 | $31 | $34 | -7% |
| 2024-Q3 | 2024-10 | $33 | $33 | -1% |
| 2024-H2 | 2025-01 | $33 | $34 | -4% |
| 2024-Q4 | 2025-01 | $33 | $34 | -4% |
Methodology
Figures are based on completed IPv4Center marketplace transactions and RIR transfer statistics. Prices are in US dollars per IP address. Forecasts are produced by an AI model that analyses each block-size band and RIR segment separately (with outlier-trimmed medians) alongside known market catalysts; they are estimates, not guarantees.
Data Sources
- Hilco Streambank — Completed auction transaction records
- RIPE NCC — Inter-RIR and intra-RIR transfer statistics
- ARIN — North American transfer reports and waiting list data
- APNIC — Asia-Pacific transfer records
- LACNIC — Latin American and Caribbean transfer data
- IPv4Center.com — Proprietary marketplace transaction and lease pricing data
This report is generated automatically for informational purposes only and does not constitute financial advice.
Frequently Asked Questions
What was the average price per IPv4 address in Q2 2025?
The market-wide average landed at .02 per address, with a median of .00 — a notably tight spread that signals consensus pricing rather than outlier-driven distortion. The range ran from .80 on the low end to .00 at the top.
How many IPv4 transactions closed in Q2 2025, and what was the total dollar volume?
We recorded 219 priced transactions covering approximately 1.22 million addresses, generating .8 million in aggregate deal value. The average deal size was roughly 122,250 addresses — skewed upward by a handful of large ARIN block trades.
Which RIR region commanded the highest per-IP prices this quarter?
APNIC led at .19 per address on average, a premium of roughly 7.5% over the global mean. This is consistent with chronic supply scarcity in the Asia-Pacific region, where free-pool exhaustion occurred years ahead of other registries.
Why are ARIN blocks cheaper than RIPE and APNIC blocks if ARIN dominates transaction volume?
ARIN averaged .27 per IP versus .97 for RIPE and .19 for APNIC. The discount reflects deeper supply: ARIN accounted for 57.5% of transaction volume and nearly 82% of total IPs traded this quarter. Liquidity compresses spreads and keeps prices competitive.
Is the IPv4 market trending up or down heading into the second half of 2025?
Down, modestly. Prices declined approximately 0.95% quarter-over-quarter. Our forecast model — which we consider reliable — projects the monthly average drifting to .59 near-term and .94 by December 2025. This is a slow grind lower, not a collapse.
What mistakes should buyers avoid in the current soft-pricing environment?
The most common error is overpaying for small blocks on the assumption that scarcity premiums are universal. With 153 transactions closing below K this quarter, liquidity in the /24 segment is robust — there is no reason to accept a + ask when the median sits at . Buyers should also avoid skipping proper WHOIS and blacklist due diligence to chase a perceived bargain.
What are the risks of buying IPv4 addresses at if prices are forecast to fall to ~ by year-end?
The implied downside is roughly 7% over six months — meaningful but hardly catastrophic. The bigger risk is opportunity cost: if you lease instead at .59/month per IP, breakeven versus buying doesn't arrive for 49.5 months. For anyone with a deployment horizon beyond four years, buying still wins on a total-cost basis despite the price decline forecast.
At current rates, is it better to buy or lease IPv4 space?
Buy, if your planning horizon exceeds roughly 4.1 years. At .02 per IP purchase price versus .5859/month lease cost, the breakeven sits at 49.5 months. Leasing yields the lessor approximately 24.2% annually, which tells you who captures most of the value in a rental arrangement.
What does the lease market look like in Q2 2025?
Based on 44 observed lease transactions, monthly rates average .59 per IP — or about 0 per month for a /24 block. Lease data is concentrated in the RIPE region. Annual lease cost works out to roughly .03 per IP, which represents a 24.2% yield on the current purchase price.
How did RIPE NCC transfers compare to ARIN transfers this quarter?
RIPE logged 1,136 total transfers versus 838 for ARIN, making RIPE the busiest registry by transfer count despite trailing ARIN in priced deal volume. This gap suggests a high volume of intra-organizational or policy-driven transfers in the RIPE region that don't carry a market price tag.
Were there any large deals — above million — in Q2 2025?
Yes, 10 transactions exceeded million, collectively accounting for .7 million — a staggering 92% of total market value on just 4.6% of deals. This concentration underscores that the IPv4 market remains a barbell: many small /24 trades and a few whale-sized portfolio moves.
What was the most commonly traded prefix size?
The /24 block (256 addresses) was the most popular, with 73 transactions — roughly one-third of all deals. This is the smallest independently routable block on the public internet, making it the entry-level unit for organizations needing their own address space.
Is LACNIC a viable source of IPv4 supply?
Barely. Only 8 transactions totaling 2,048 addresses (,968 in value) cleared through LACNIC this quarter. Average pricing of .79 is competitive, but the thin liquidity makes it unreliable as a primary sourcing channel. Treat it as opportunistic.
Why was there zero AFRINIC transaction activity in Q2 2025?
AFRINIC recorded no priced transactions and zero transfers. Ongoing governance instability, policy uncertainty around inter-RIR transfers, and limited commercial demand within the region continue to render the AFRINIC market effectively dormant.
What risks do sellers face if they delay monetizing IPv4 assets?
With prices forecast to slide toward .94 by year-end 2025 — down roughly 7% from today's .02 average — every quarter of delay erodes realizable value. On a /16 block (65,536 addresses), that projected decline translates to approximately 6,000 in lost proceeds. Sellers sitting on unused space should view the current price level as a window, not a floor.
How long does a typical IPv4 transfer take to complete?
Timelines vary by registry. ARIN transfers typically close in 2–4 weeks once buyer and seller are aligned; RIPE transfers can complete in as few as 5–10 business days given their streamlined process. APNIC transfers tend to run 3–6 weeks due to additional due diligence requirements.
How does the 30-month transfer history inform current pricing?
Over the trailing 30 months, approximately 25,227 transfers were recorded across 1,974 total transfer events. RIPE accounted for 58.4% and ARIN for 41.6% of the transfer volume. Activity peaked in December 2024, consistent with year-end corporate budget cycles — a pattern we expect to repeat.
What is the deal-size distribution telling us about market participants?
The market is bifurcated. 153 deals (70%) were sub-K transactions — small operators and resellers trading /24s and /23s. At the other extreme, 10 deals above M accounted for 92% of dollar volume. The mid-market (K–0K, 50 deals) is active but increasingly squeezed between retail and institutional players.
Has IPv6 adoption materially reduced IPv4 demand in 2025?
Not yet in any measurable way at the transaction level. Q2 2025 saw 219 deals and .8 million in volume — this is not a market in structural decline. IPv6 is gradually reducing incremental demand growth, which contributes to the modest price softening, but wholesale substitution remains years away for most enterprises.
What should a buyer budget for a /24 block in Q2 2025?
At the market-wide median of per IP, a /24 (256 addresses) costs approximately ,424. RIPE /24s ran slightly higher at roughly ,680 (median /IP), while ARIN blocks were more accessible at around ,168 (median /IP). Add broker fees and transfer costs of 0–,500 depending on the registry.
What drove the price ceiling to per IP this quarter?
The high-water mark appeared in the ARIN region, likely on a small, clean block with favorable geolocation attributes or an expedited closing timeline. APNIC peaked at , and RIPE at . Premium pricing typically attaches to blocks with no blacklist history and desirable /24 sizing.
What are the risks of purchasing IPv4 addresses from secondary brokers without proper due diligence?
Significant. Blocks can carry blacklist contamination, disputed ownership, or encumbrances from prior holders. At per IP, a tainted /22 represents a ,700 problem. Always verify RIR registration, conduct Spamhaus and UCEProtect checks, and use an escrow mechanism — the few hundred dollars in diligence costs are trivial relative to the asset value.
Is the sub- end of the price range a signal of distressed selling?
Likely. The .80 floor price this quarter — recorded in the ARIN region — sits 39% below the market average. Blocks at that level typically involve large legacy holdings where the seller prioritizes speed over price, or address space with geolocation or reputation issues that warrant a discount.
How reliable is the year-end price forecast of .94?
We flag this forecast as reliable based on model confidence metrics. The projected decline from .02 to .94 implies a 7.2% erosion over roughly six months — a pace consistent with the gradual supply-demand rebalancing we've observed. That said, a large institutional liquidation or a sudden regulatory shift at any major RIR could accelerate or reverse the trajectory.
What mistakes do first-time IPv4 investors make when entering the market?
Three recurring errors: overweighting the smallest block sizes where per-IP premiums are steepest, ignoring the 24.2% implied lease yield that makes buy-and-lease a viable income strategy, and treating all RIR regions as interchangeable when APNIC commands an 10% premium over ARIN. The market rewards specificity — know your registry, your block quality, and your exit timeline.