16 min read
This report analyzes the IPv4 transfer market for April 2026, based on completed IPv4Center marketplace transactions and official RIR transfer records.
Executive Summary
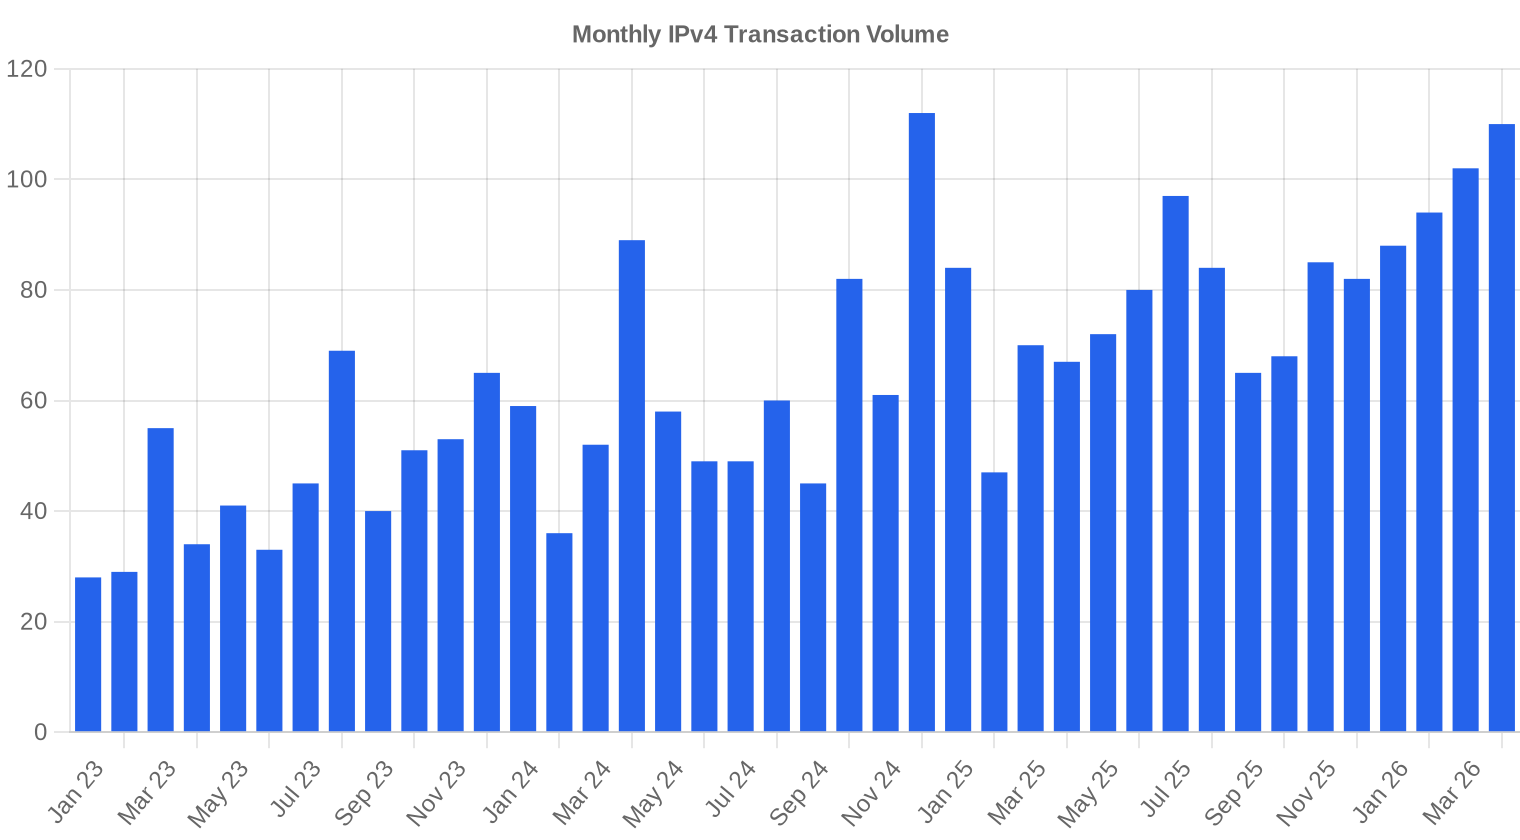
The IPv4 transfer market posted 110 transactions in April 2026, moving 677,632 addresses at a weighted average of $19.56 per IP — a 5.5% increase from March but still 34.9% below April 2025 levels. Total deal value reached $8.82 million on a median price of $20/IP. Transaction count climbed 7.8% month-over-month, though the broader trend line remains firmly negative on a year-over-year basis. RIPE accounted for the majority of deal flow at 52.7% of volume, while LACNIC commanded the highest per-IP prices at $24.50 — a 25.3% premium to the market average that continues to reflect acute scarcity in the Latin American registry.Market Overview
| Transactions | 110 |
| IP Addresses Traded | 677,632 |
| Estimated Market Value | $8,821,254 |
| Average Price / IP | $19.56 |
| Median Price / IP | $20.00 |
| RIR Transfers | 748 |
Year-over-Year Comparison
| Metric | This period | A year earlier (April 2025) | Change |
|---|---|---|---|
| Transactions | 110 | 67 | +64.2% |
| IP Addresses Traded | 677,632 | 479,744 | +41.2% |
| Estimated Market Value | $8,821,254 | $11,060,573 | -20.2% |
| Average Price / IP | $19.56 | $30.03 | -34.9% |
| RIR Transfers | 748 | 836 | -10.5% |
Price Dynamics
The spread between the cheapest and most expensive IPs traded in April was wide: $10 at the floor to $34 at the ceiling, a $24 range that signals continued segmentation by block quality, size, and registry. The 5.5% bounce from March's average looks like a dead-cat move inside a persistent downtrend — prices are tracking a -1.73% month-on-month regression line, and the year-over-year decline of 34.9% is the kind of number that redefines market structure. The median holding at $20 while the average sits at $19.56 suggests a slight leftward skew in the distribution, with a handful of sub-$15 bulk trades pulling the weighted figure down. The March-to-April uptick was driven partly by smaller deal sizes — average deal size collapsed to 80,193 IPs from 158,102 in March — which tend to carry higher per-IP pricing. This is not a recovery; it is compositional noise.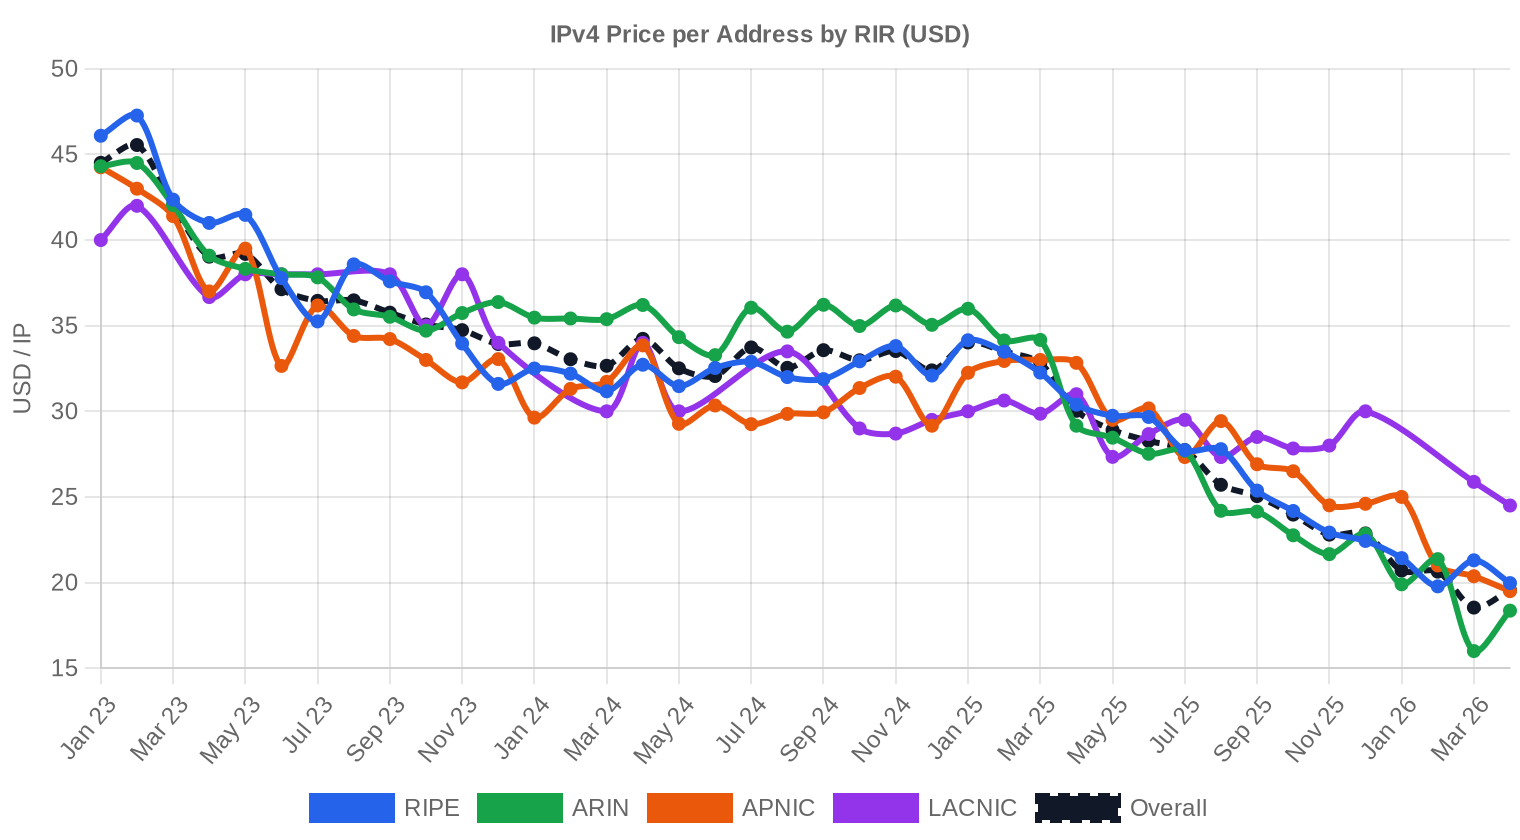
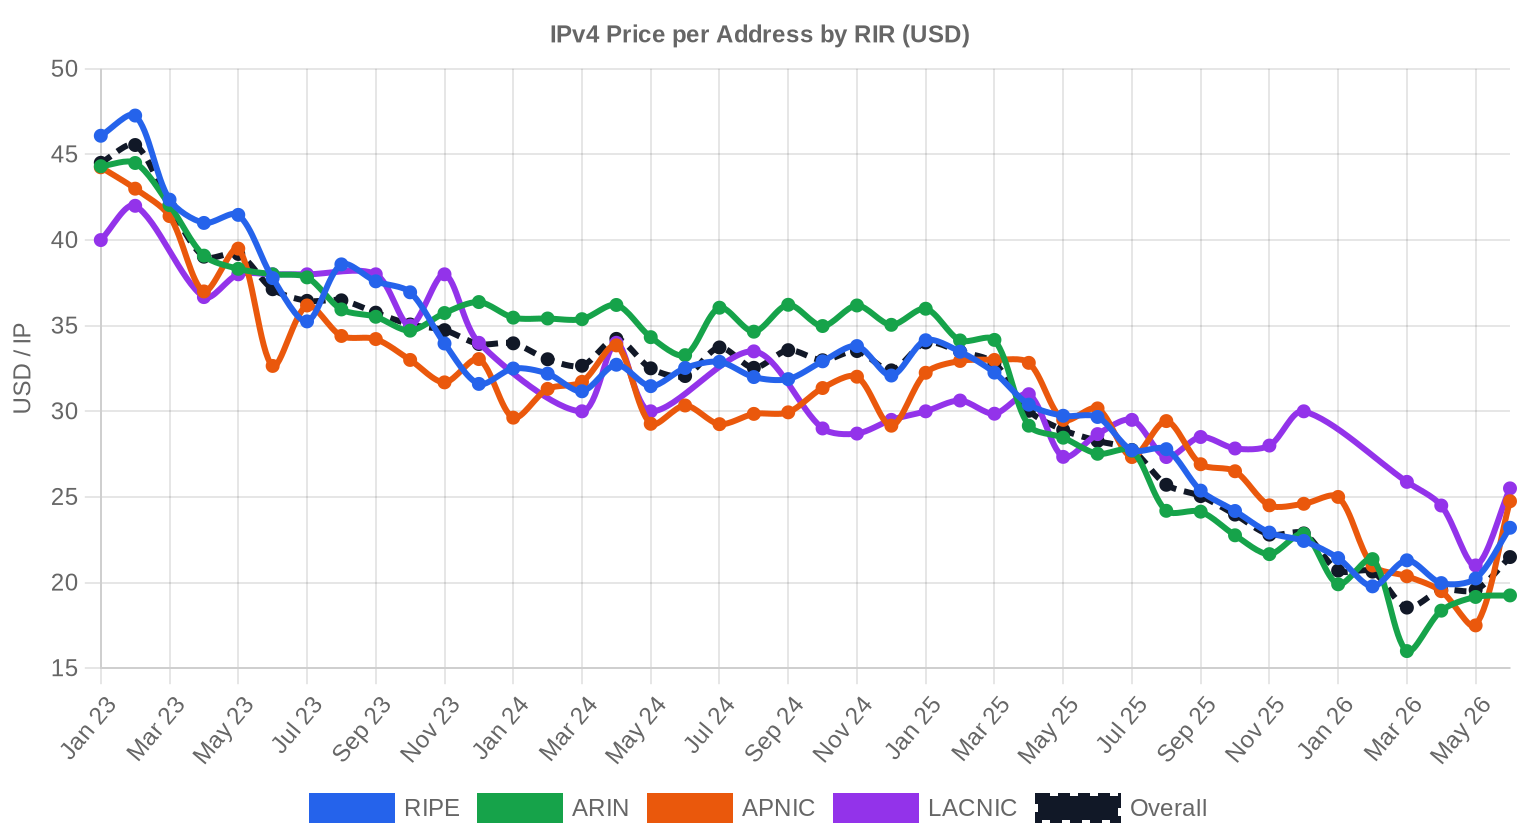
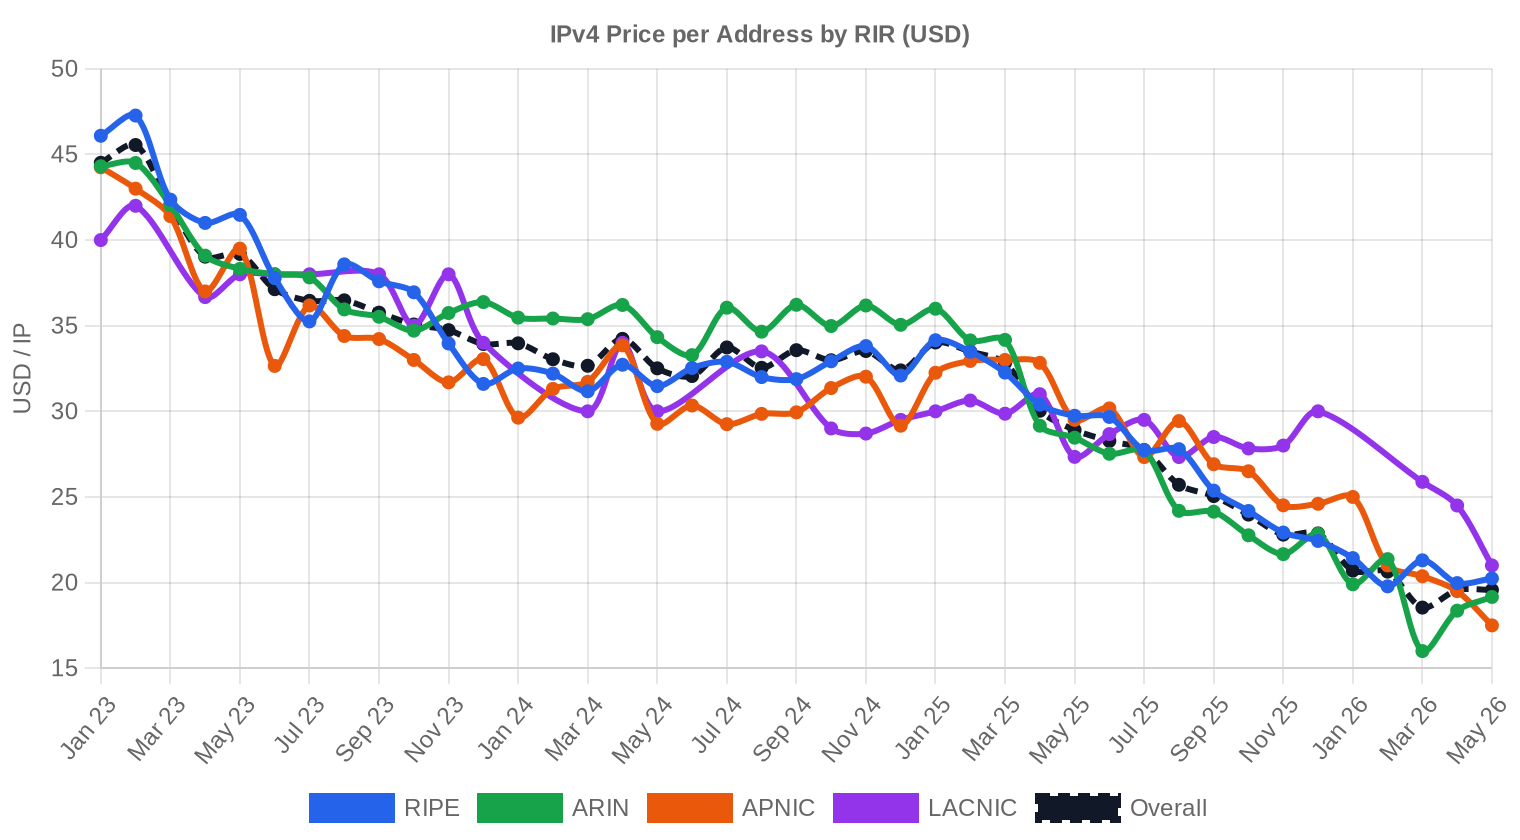
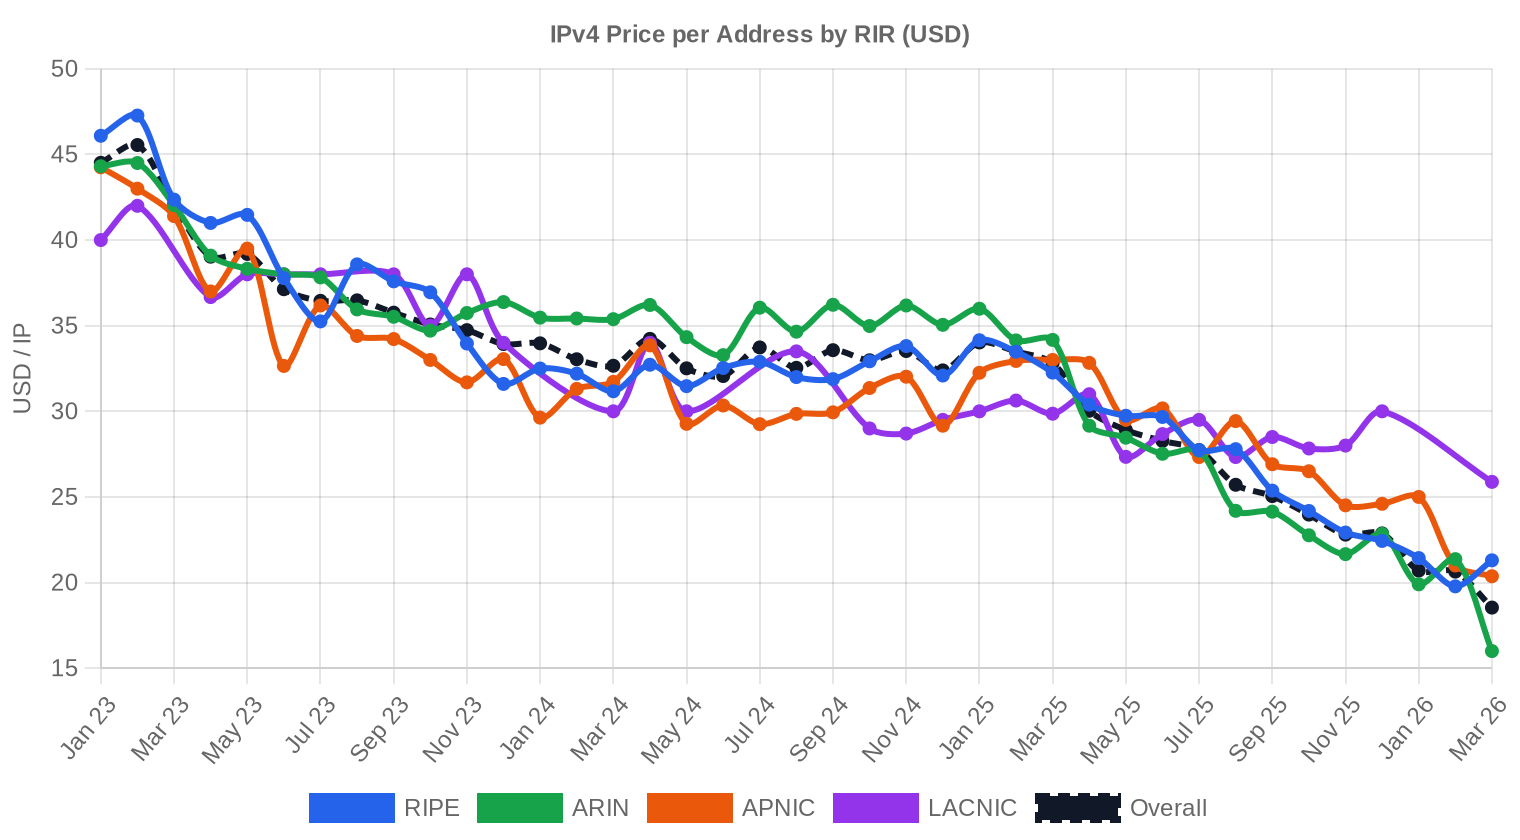
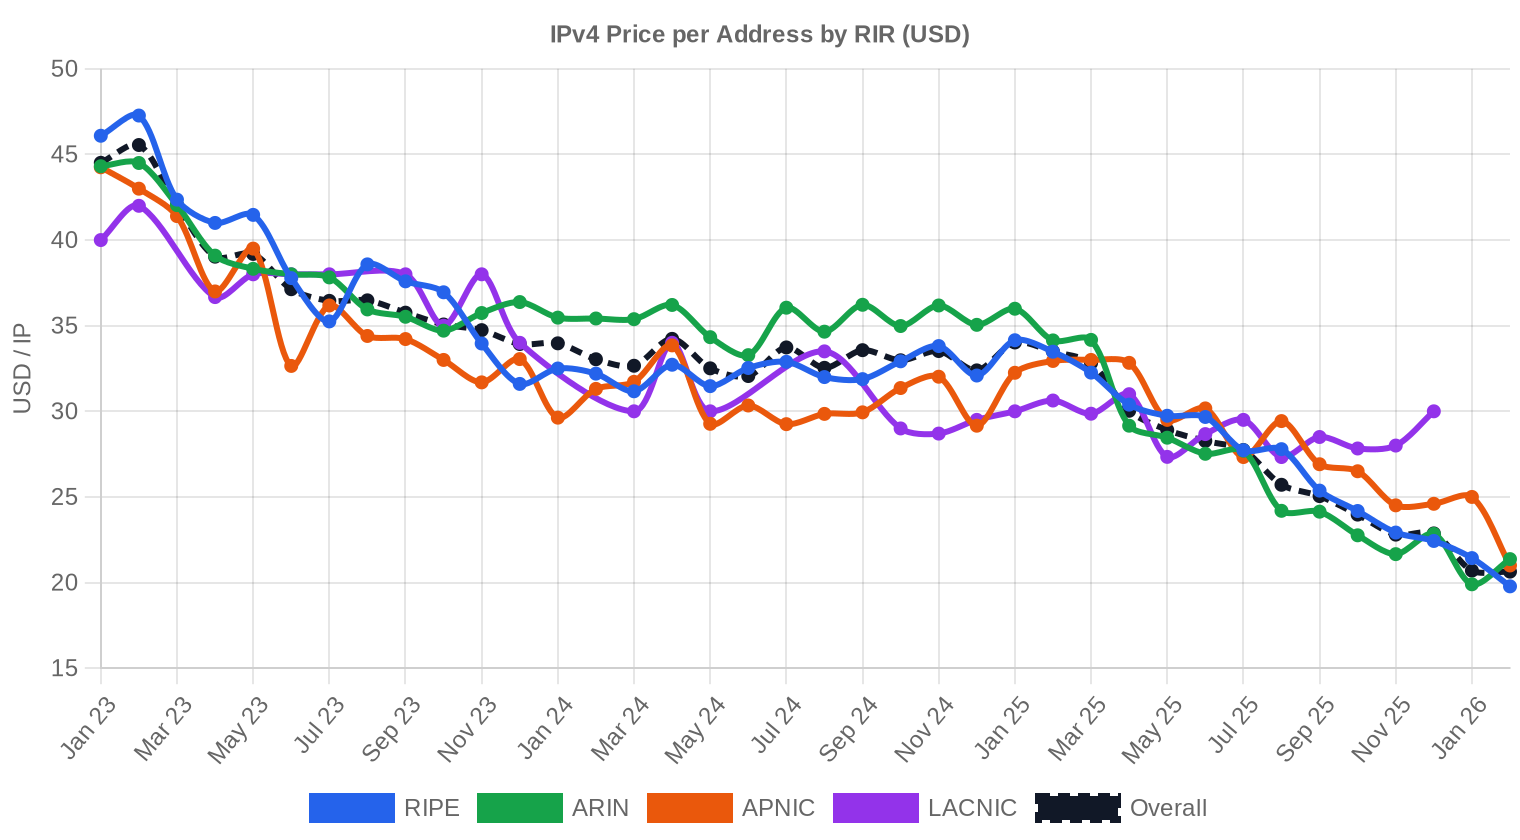
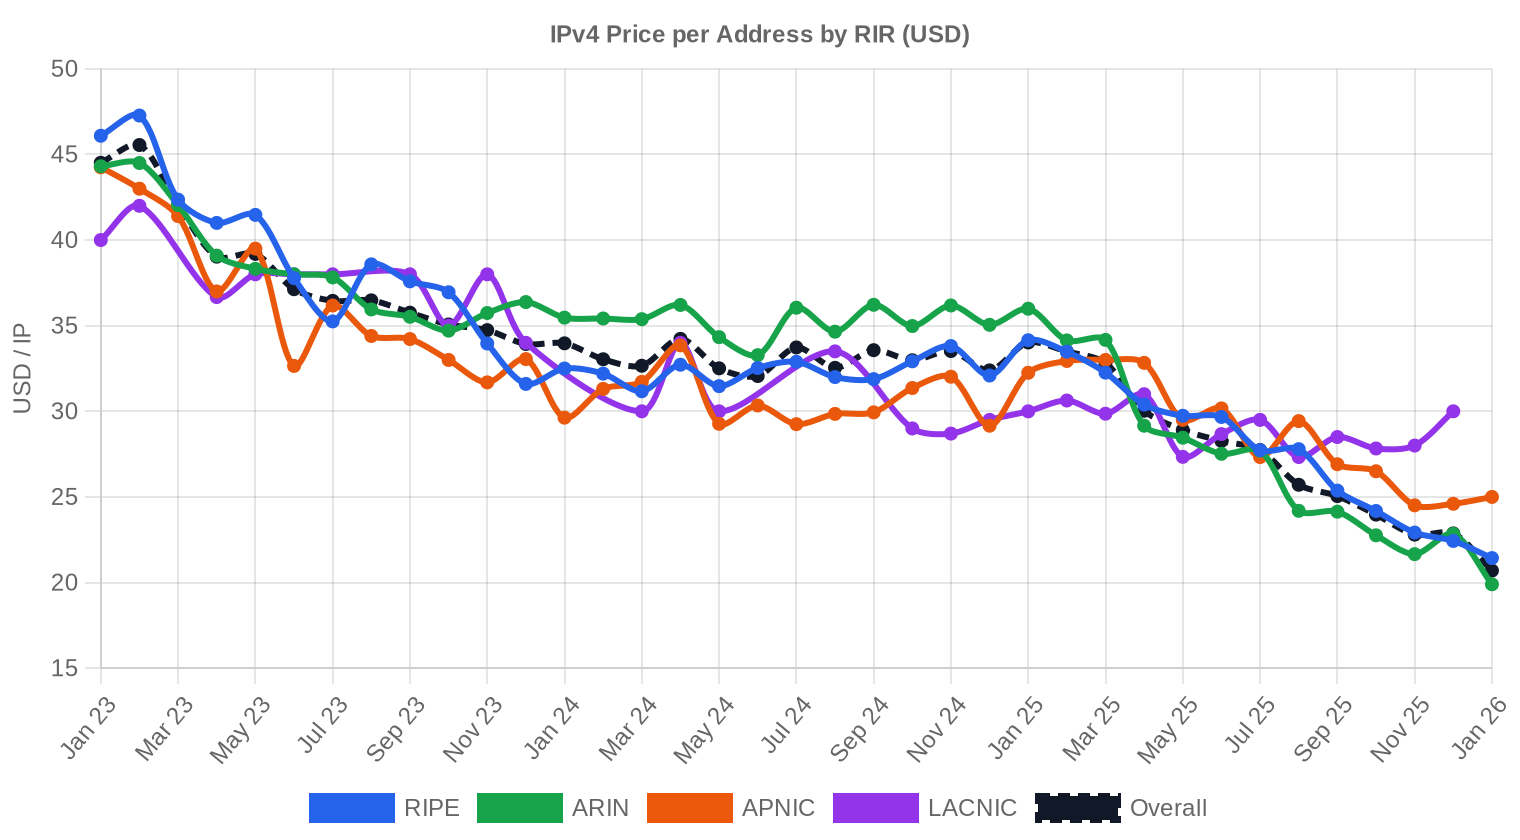
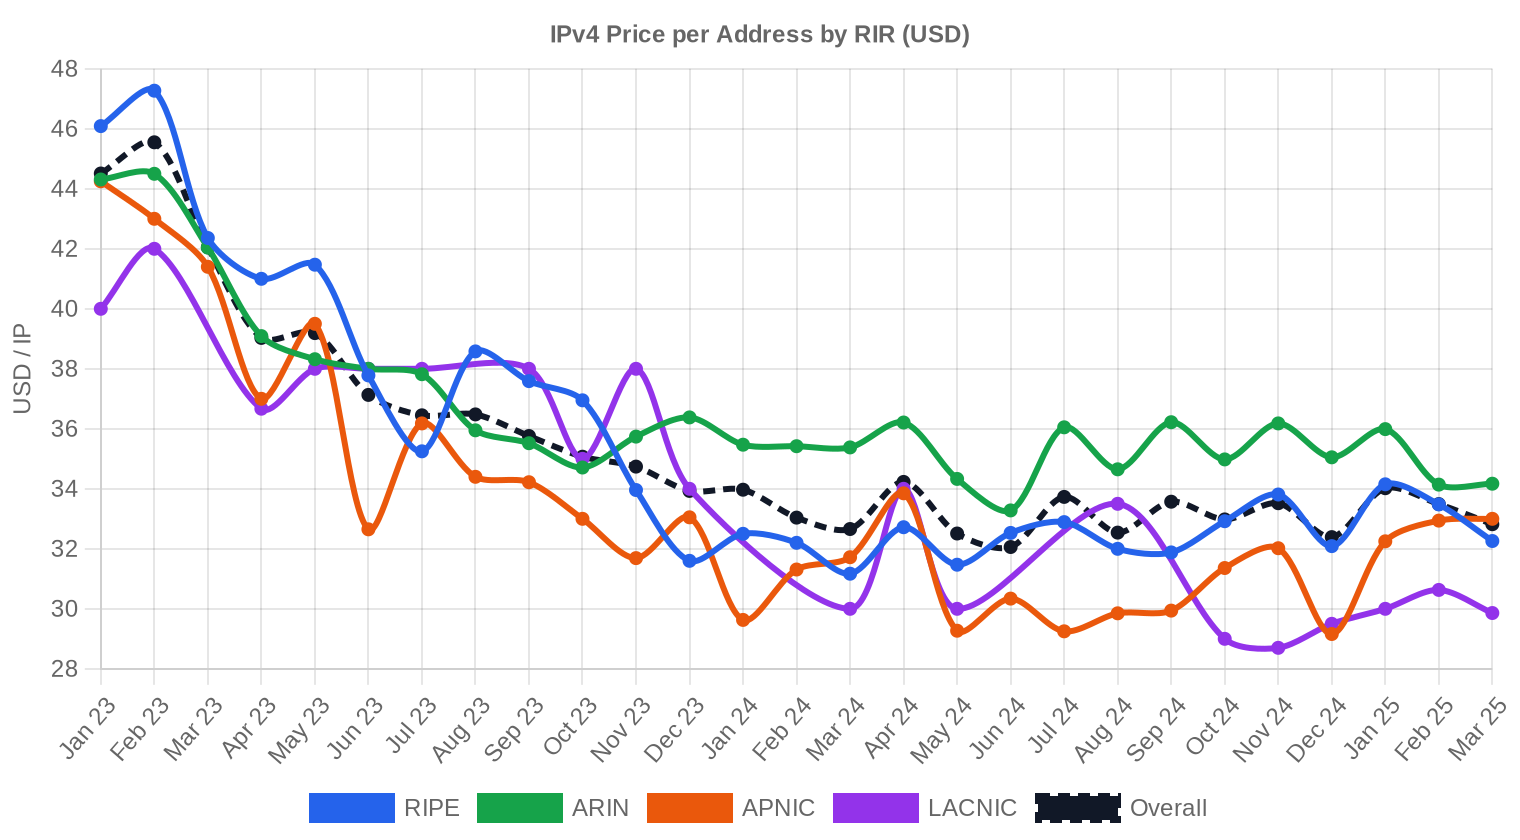
Pricing by RIR
RIPE continues to dominate deal flow, and the pricing gap between registries is narrowing — a trend we have been tracking for several quarters. ARIN's average of $18.36 is now just $1.61 below RIPE's $19.97, a convergence that would have been hard to imagine two years ago when ARIN blocks routinely commanded a $5-8 premium. LACNIC's $24.50 average stands out as an outlier, 25.3% above the market mean, driven by structural undersupply in a region where legacy block holders rarely sell.RIPE: $19.97/IP across 58 transactions (58.2% of volume). Median $20. Range $10–$27.
ARIN: $18.36/IP across 40 transactions (36.5% of volume). Median $18. Range $10–$34 — that $34 high was a single small-block trade, not representative of bulk pricing.
APNIC: $19.50/IP across 7 transactions (4.2% of volume). Median $19. Tight range of $16–$25 suggests a thin but orderly market.
LACNIC: $24.50/IP across 5 transactions (1.2% of volume). Median $26. The premium here is real and persistent — this is the most supply-constrained registry in the system.
AFRINIC: No recorded transactions. The moratorium on transfers and ongoing governance issues continue to make this registry effectively untradeable.
| RIR | Transactions | Avg $/IP | Median $/IP | IPs Traded | RIR Transfers | Next Month (proj.) | Year-End (proj.) |
|---|---|---|---|---|---|---|---|
| RIPE | 58 | $19.97 | $20.00 | 394,496 | 503 | $19.50 | $17.50 |
| ARIN | 40 | $18.36 | $18.00 | 247,040 | 245 | $17.50 | $15.50 |
| APNIC | 7 | $19.50 | $19.00 | 28,160 | 0 | $18.50 | $16.00 |
| LACNIC | 5 | $24.50 | $26.00 | 7,936 | 0 | $25.50 | $24.00 |
Transaction Volume

Supply & Block Sizes
/24 blocks were the most frequently traded prefix size in April, accounting for 27 of 110 transactions. This is consistent with the long-term pattern: buyers in the sub-$50K segment — which represented 83 of 110 deals — default to /24s because they are the smallest independently routable unit and the easiest to onboard. The concentration at the small end of the block spectrum also helps explain why per-IP averages bounced relative to March, since /24 pricing carries a well-documented per-IP premium over /20s and /16s.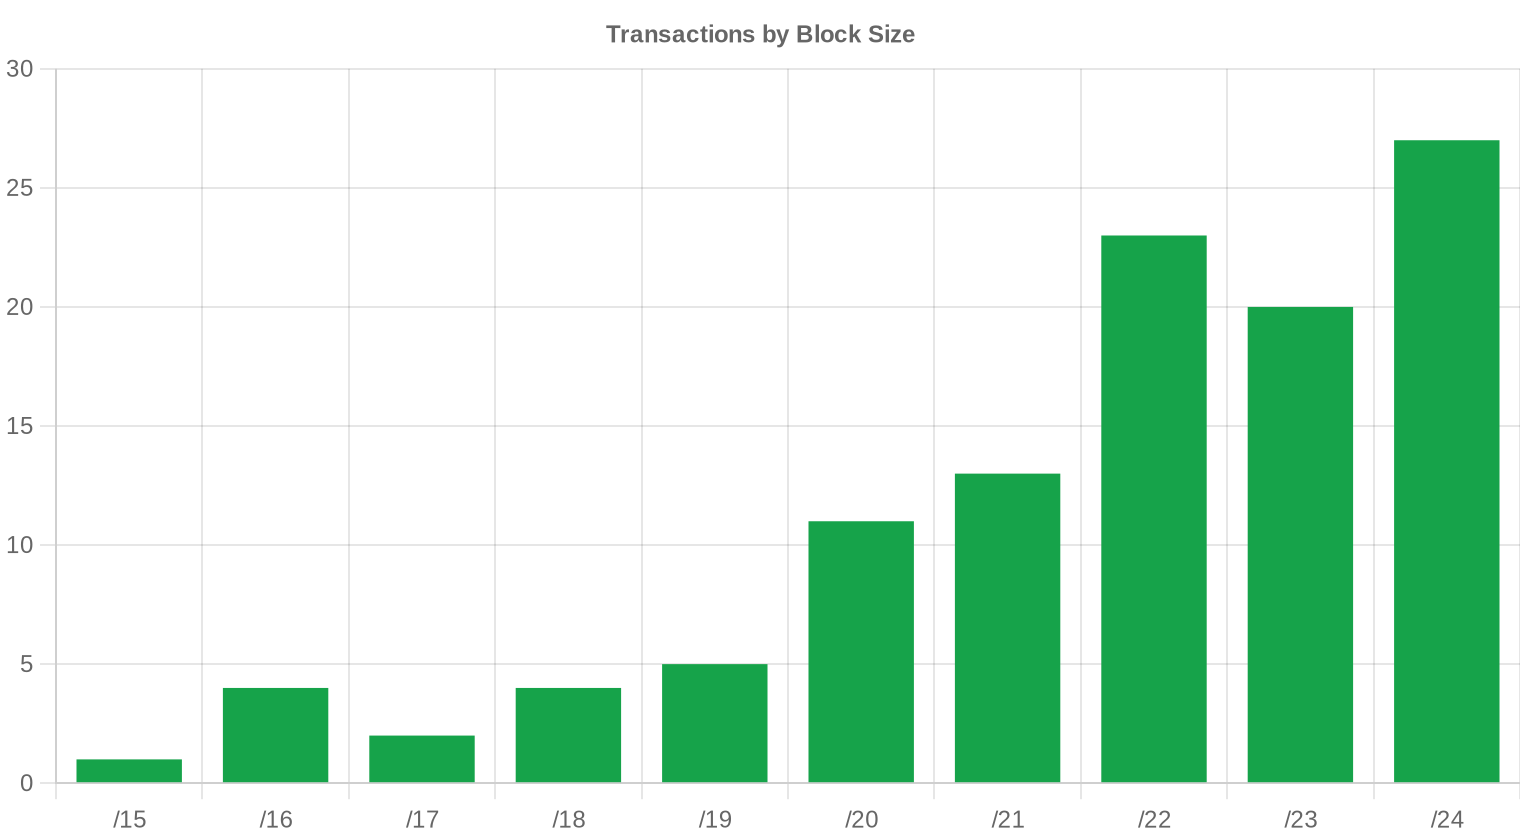
Geographic Activity
The United States led country-level activity with 34 transactions, followed by the United Kingdom at 10 and Sweden at 8. Canada (7) and the Netherlands (5) rounded out the top five. The U.S. share at roughly 31% of deals is consistent with historical norms, though the presence of Sweden in the top three — ahead of Germany, which managed just one transaction — is atypical and likely reflects a handful of Nordic ISP consolidations.Registry Transfer Activity
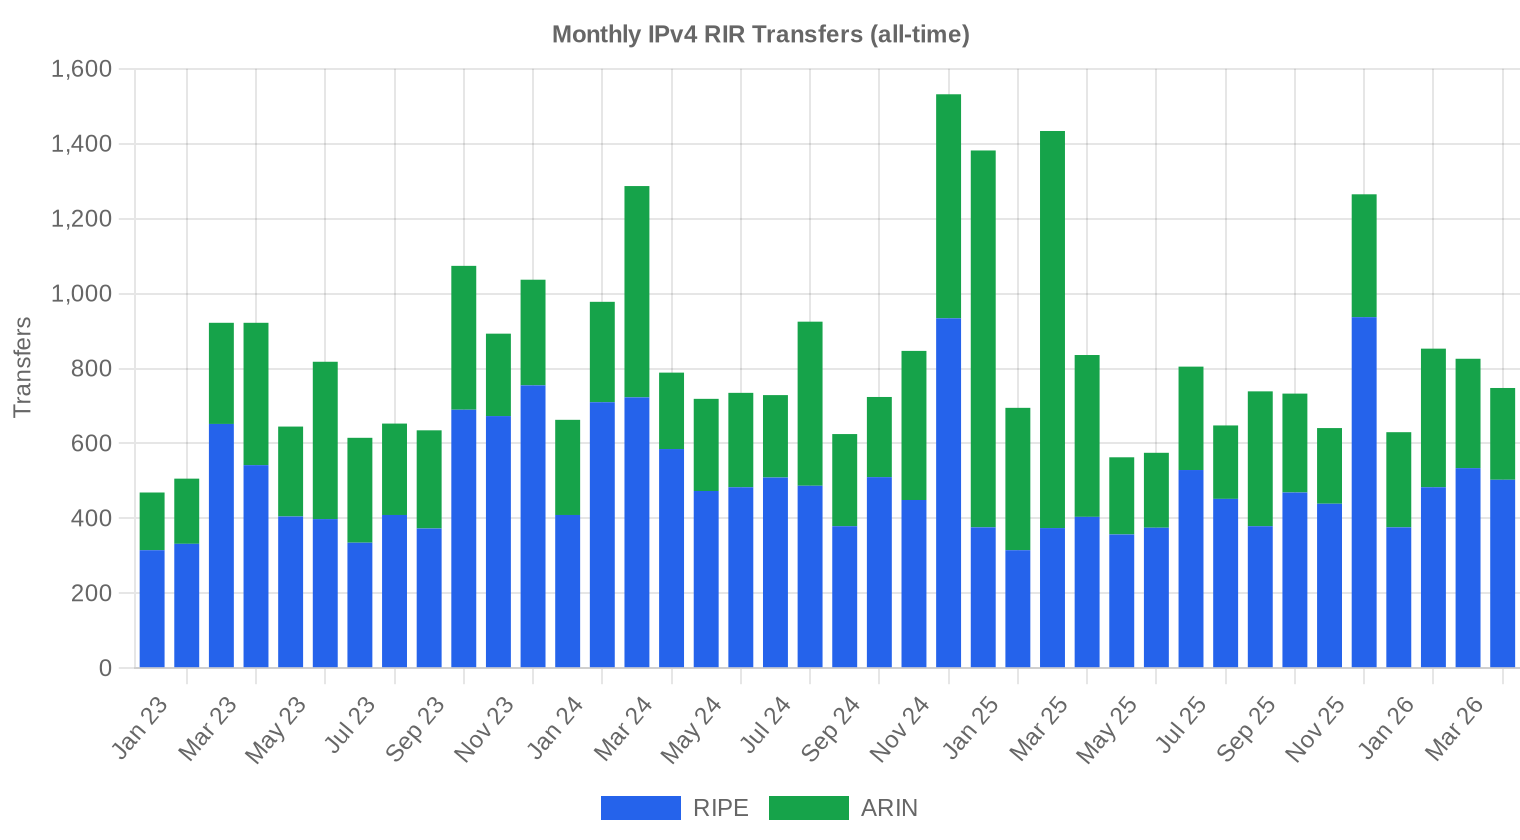
RIR-recorded transfers totaled 748 in April, with RIPE accounting for 503 (67.2%) and ARIN contributing 245 (32.8%). Neither APNIC, LACNIC, nor AFRINIC recorded any inter-party transfers in their registries during the period. The gap between our 110 priced transactions and the 748 total transfers reflects the usual mix of intra-organization moves, policy-based transfers, and deals where pricing was not disclosed.Long-Run Transfer Trends
Over the 40-month observation window, cumulative recorded transfers have reached 33,115. RIPE has accounted for 59.9% and ARIN for 40.1% of that total — APNIC, LACNIC, and AFRINIC are essentially rounding errors in the transfer statistics. The peak month for transfer activity was December 2024, which aligned with year-end tax planning and the last wave of pre-depreciation bulk selling. Monthly volumes have trended lower since, consistent with the broader price decline.| RIR | RIR Transfers |
|---|---|
| RIPE | 19,832 |
| ARIN | 13,283 |
| RIR Transfers | 33,115 |
Outlook & Forecast
Forecasting each block-size band and RIR separately with our AI model:
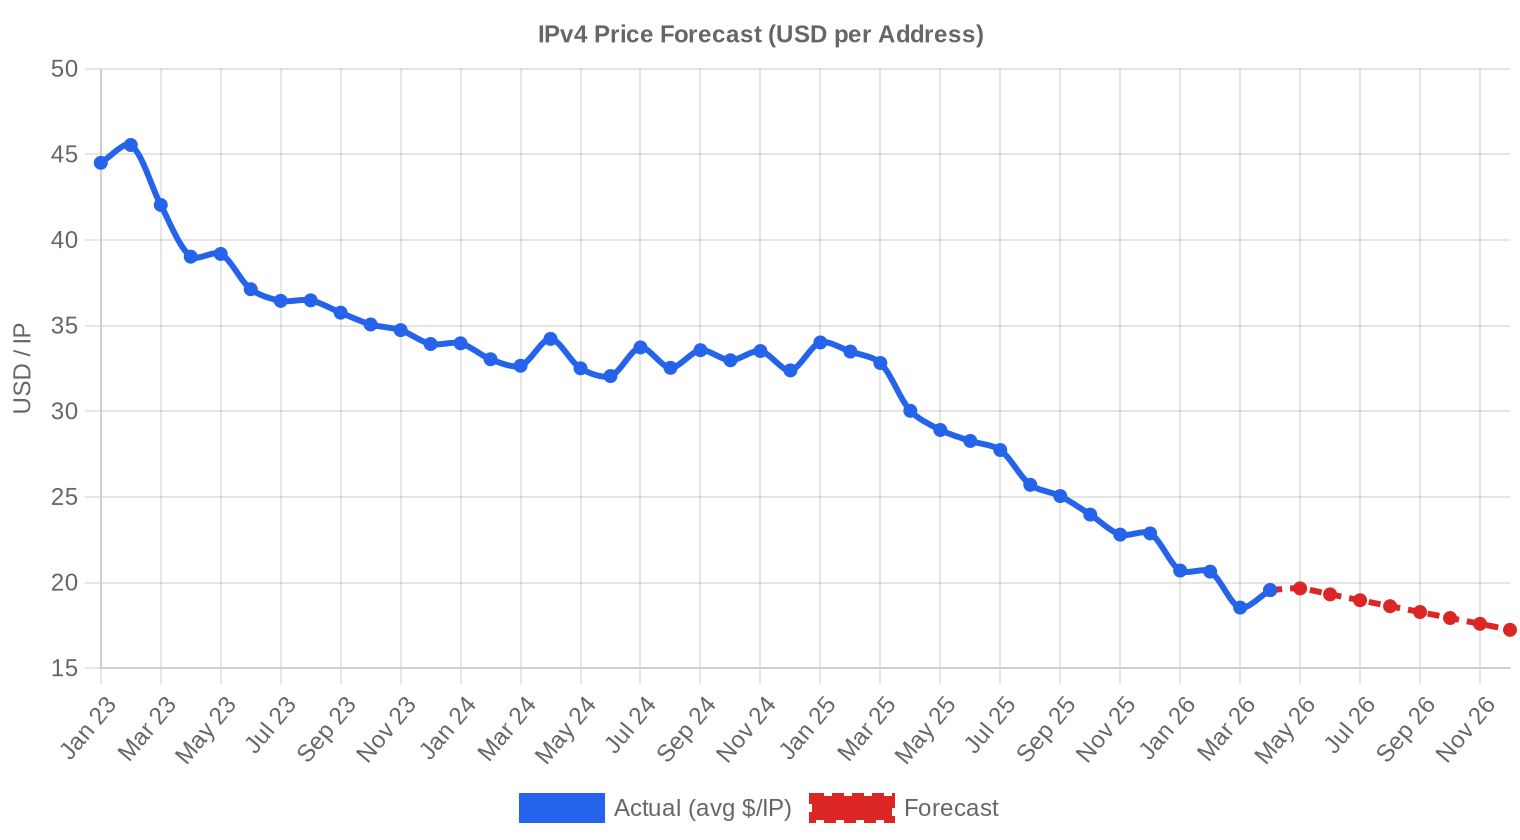
The overall average price per IP is projected to reach $17.24 by December 2026, with a next-month estimate of $18.70 per IP.
- RIPE: projected at $19.50 per IP next month, trending toward $17.50 by December 2026.
- ARIN: projected at $17.50 per IP next month, trending toward $15.50 by December 2026.
- APNIC: projected at $18.50 per IP next month, trending toward $16.00 by December 2026.
- LACNIC: projected at $25.50 per IP next month, trending toward $24.00 by December 2026.
- AFRINIC: insufficient data for a reliable forecast.
Forecast by Block Size
| Block | Current $/IP | Next Month | Year-End | Confidence |
|---|---|---|---|---|
| /24 | $23.00 | $23.00 (0.0%) | $21.00 (-8.7%) | medium |
| /23 | $21.00 | $20.50 (-2.4%) | $19.00 (-9.5%) | medium |
| /22 | $18.00 | $17.50 (-2.8%) | $16.50 (-8.3%) | medium |
| /21 | $17.88 | $17.50 (-2.1%) | $15.50 (-13.3%) | medium |
| /20 | $16.00 | $15.50 (-3.1%) | $14.50 (-9.4%) | medium |
| /19 | $13.72 | $13.50 (-1.6%) | $12.50 (-8.9%) | low |
| /18-/16 | $12.75 | $12.50 (-2.0%) | $11.50 (-9.8%) | low |
| /15-up | $10.00 | $9.50 (-5.0%) | $9.00 (-10.0%) | low |
Editor's Take: Buy vs. Lease
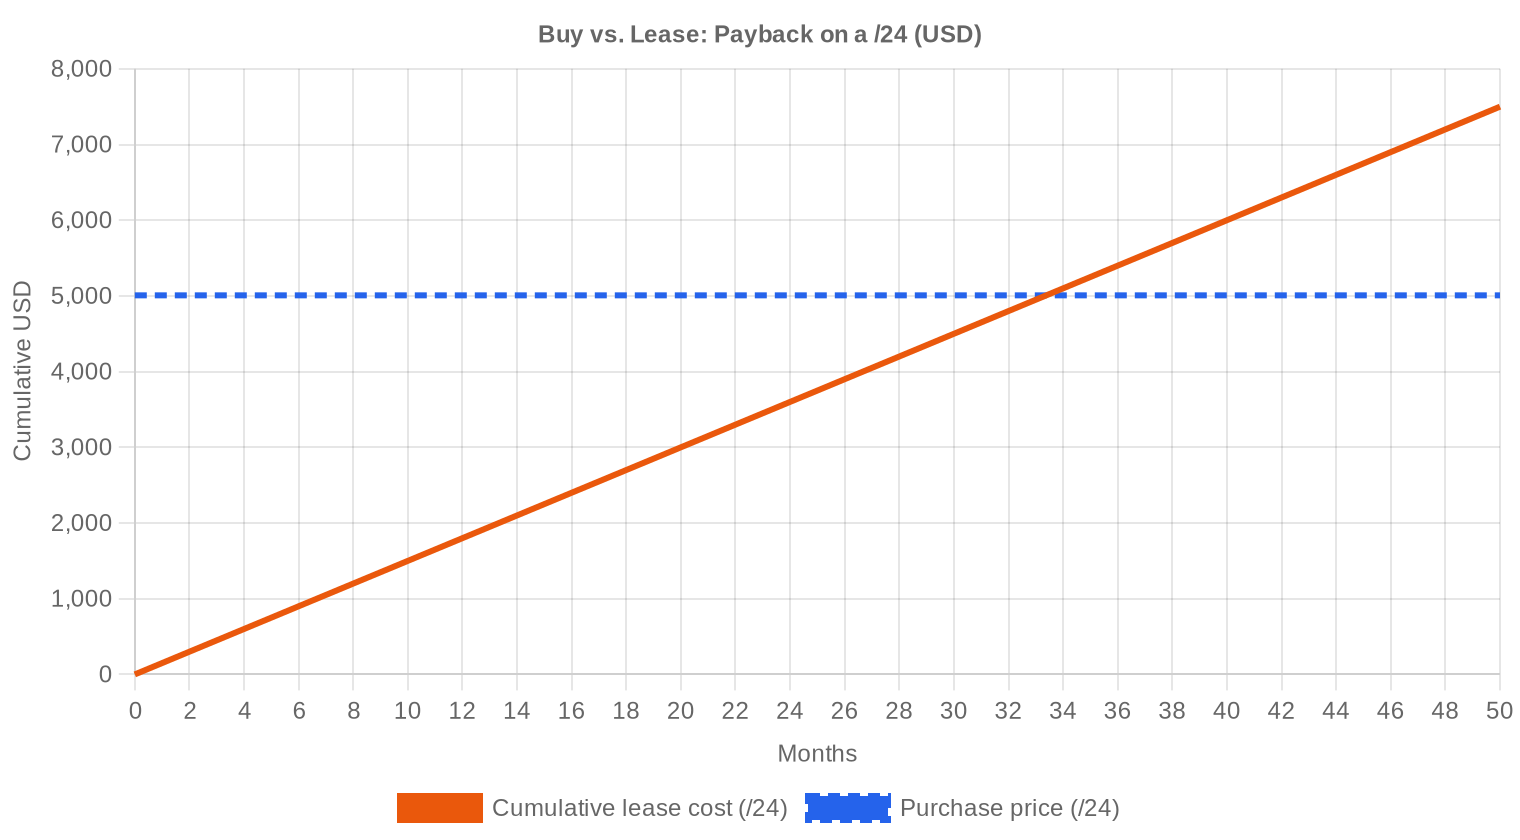
The buy-versus-lease calculus continues to favor outright purchase for any organization with a planning horizon beyond three years. At current pricing, a /24 costs roughly $5,007 to buy. Leasing the same block runs $150/month or $1,800 annually. That puts the breakeven at 33.4 months — just under 2.8 years. For the lessor, the implied annual yield is 35.9%, which is extraordinary by any fixed-income standard and explains why lease supply remains ample. But for the lessee, those economics are punishing over a multi-year horizon. If you know you need the space for three or more years, buy it now and lock in a price that our models suggest will be lower in six months anyway. The one exception: organizations facing near-term uncertainty about their address requirements should lease for flexibility, even at the yield penalty.| /24 Purchase price | $5,007 |
| /24 Lease price | $150 / mo |
| Payback period | 33.4 mo (2.8 yr) |
| Gross annual yield | 35.9% |
What This Means for You
Buyers: You are in a favorable position. Prices are 35% below where they were a year ago and the forecast points lower still. The ARIN-RIPE spread has compressed to roughly $1.60/IP, so registry arbitrage is largely played out — buy on block quality and cleanliness rather than chasing registry discounts.Sellers: The window for $25+ pricing on standard RIPE and ARIN blocks has closed outside of small /24 lots. If you are holding inventory acquired above $20, every month of delay adds to the mark-to-market loss. Consider accelerating dispositions, particularly for /20 and larger blocks where per-IP discounts are deepening.
Leasers: At $0.59/IP/month, lease rates have been slow to adjust downward relative to the purchase price decline. This creates a short-term opportunity for lessors, but the 35.9% implied yield is unsustainable if buy-side prices keep falling — expect lease rate compression in the second half of 2026.
Block Holders: If you hold clean, seasoned blocks and are not actively using them, the combination of falling sale prices and still-elevated lease yields makes leasing the better monetization strategy for the next 12–18 months. Revisit the sell decision once the price curve flattens.
Browse verified IPv4 blocksSell IPv4 →
List your blocks with managed transferLease IPv4 →
Flexible short-term capacityLease Out IPv4 →
Turn idle blocks into recurring revenue
IPv4 Pricing by Block Size
Per-IP premiums for /24 blocks remain significant — we estimate 30-40% above the per-IP cost of a /20 at current market levels. A clean /24 in RIPE is trading around $20-22/IP, while /20s and larger are clearing in the $16-18 range. The /16 market is thin; the five deals above $1M in April collectively totaled $7.69M, and those buyers are typically negotiating bespoke terms that do not map cleanly onto per-IP benchmarks.| Block | IPs | Buy: /IP | Buy: Total | Lease: /IP/mo | Lease: Monthly |
|---|---|---|---|---|---|
| /24 | 256 | $35–45 | $8,960–11,520 | $0.38–0.50 | $97–128 |
| /22 | 1,024 | $28–38 | $28,672–38,912 | $0.33–0.45 | $338–461 |
| /20 | 4,096 | $22–32 | $90,112–131,072 | $0.30–0.40 | $1,229–1,638 |
| /18 | 16,384 | $20–30 | $327,680–491,520 | $0.30–0.38 | $4,915–6,226 |
| /16 | 65,536 | $18–28 | $1,179,648–1,835,008 | $0.30–0.35 | $19,661–22,938 |
IPv4 Price History: 2011–2026
IPv4 addresses first acquired secondary market value after IANA exhaustion in February 2011, trading at $5-7/IP in the early years. Prices peaked in the $50-60 range during late 2021 and early 2022, driven by pandemic-era cloud expansion and a FOMO-driven buying cycle. AWS's decision to charge $0.005/hour for public IPv4 addresses — effective February 2024 — accelerated the return of underutilized blocks to market, contributing to the sustained price decline that has brought us to $19.56 today. The market has now bifurcated: small, clean blocks retain a quality premium, while large legacy blocks are repricing toward utility value.| Year | ~Price/IP | Key Event |
|---|---|---|
| 2011 | $7–12 | IANA free pool exhausted; Microsoft/Nortel deal ($11.25/IP) |
| 2012 | $8–12 | RIPE NCC reaches last /8; begins /22-only allocation |
| 2014 | $10–15 | LACNIC free pool exhausted |
| 2015 | $8–15 | ARIN free pool exhausted |
| 2017–18 | $12–18 | Leasing market grows; cloud demand rises |
| 2019 | $18–24 | RIPE NCC exhausts remaining free pool |
| 2021–22 | $50–60+ | Post-pandemic peak; hyperscaler build-outs |
| 2024 | $35–52 | AWS IPv4 charge ($0.005/IP/hr); large block correction |
| 2025–26 | $18–45 | Market bifurcation; /16s below $20 for first time since 2019 |
Market Structure: Who Is Buying & Selling
The buy side in April was dominated by mid-size ISPs, regional cloud operators, and hosting companies — the infrastructure layer that still runs on IPv4 and cannot migrate to IPv6 without breaking customer connectivity. The sell side continues to be fed by legacy corporate holders, PE-backed portfolio companies monetizing non-core assets, and a growing cohort of speculative investors who bought at $35+ and are now cutting losses. Bankruptcy-related liquidations have ticked up but remain a small fraction of total volume.IPv4 vs. Other Asset Classes
At a 35.9% implied annual lease yield, IPv4 addresses continue to outperform virtually every traditional asset class on a current-income basis. Ten-year Treasuries are yielding roughly 4.3%, investment-grade corporate bonds around 5.5%, and even high-yield is in the 7-8% range. The catch is capital depreciation: the address block itself is declining in value at roughly 2% per month on a trend basis, which eats into total return. Net of price depreciation, the effective yield is still in the low-to-mid twenties — competitive with distressed real estate, but with the caveat of a shrinking underlying asset value.| Asset Class | Typical Yield | Liquidity | Primary Risk |
|---|---|---|---|
| IPv4 | 35.9% | Moderate | IPv6 adoption, block quality |
| Commercial Real Estate | 5–8% | Low | Vacancy, rate cycle |
| Investment-Grade Bonds | 4–5% | High | Duration, credit risk |
| S&P 500 | ~1,3% | High | Market volatility |
| Money Market / T-Bills | ~4–5% | High | Rate cycle changes |
IPv6 Adoption & Why IPv4 Remains Essential
IPv6 adoption continues its glacial advance — Google's public data shows roughly 45% of its traffic arriving over IPv6 as of early 2026, a number that has barely moved in the past year. The problem is not technology but incentive: the cost of maintaining dual-stack is lower than the cost of breaking legacy IPv4-only applications and services. IPv4 and IPv6 will coexist for the remainder of this decade at minimum, and the transfer market will remain active throughout.AI & Cloud Infrastructure Demand
AI infrastructure continues to generate IPv4 demand, though the impact is more concentrated than headlines suggest. Large training clusters and inference farms need routable address space for API endpoints, model serving, and data ingestion pipelines. The GPU cloud buildout — particularly by second-tier providers who lack the address holdings of hyperscalers — has added incremental buying pressure in the /22 to /20 range. This demand is real but insufficient to offset the broader supply-side pressures pushing prices lower.What Determines IPv4 Block Value
Block valuation remains a function of five variables: blacklist cleanliness, allocation age, RIR of origin, prefix size, and transferability. A RIPE /22 with no Spamhaus listings and a 10-year allocation history will trade at a meaningful premium to a freshly transferred ARIN /22 with a spotty reputation. LACNIC blocks command a structural premium due to transfer restrictions and thin supply, while AFRINIC blocks are effectively illiquid.Sell vs. Lease: A Decision Framework
For holders sitting on clean, mid-size blocks (/22 to /20), the math currently favors leasing. With sale prices trending toward $17/IP by year-end and lease rates still at $0.59/IP/month, you recover the current sale price in under three years while retaining the asset. Selling makes sense for holders who need immediate liquidity, who believe prices have further to fall (a reasonable view), or who hold blocks with reputation issues that make leasing difficult.| /24 Purchase price | $5,007 |
| /24 Lease price | $150 / mo |
| Payback period | 33.4 mo (2.8 yr) |
| Gross annual yield | 35.9% |
RIPE NCC 24-Month Transfer Restriction
RIPE NCC's 24-month holding requirement before re-transfer continues to act as a supply brake, preventing rapid flipping and keeping a portion of recently acquired inventory off the market. This rule effectively creates a two-year lockup period that institutional buyers must factor into their return calculations. The policy has modestly supported RIPE pricing relative to ARIN, where no comparable holding period exists, though the gap has narrowed to $1.61/IP as we noted above.Deal Size Distribution
April's deal distribution was heavily skewed toward small transactions: 83 of 110 deals (75.5%) fell below $50K, generating $1.32M in total value. The 16 mid-size deals ($50K–$250K) contributed $1.68M, while 6 deals in the $250K–$1M band added $2.56M. The five largest transactions — each above $1M — accounted for $7.69M, or 87.2% of total market value, confirming that this remains a market where a handful of whale trades drive the economics. Average deal size collapsed 49.3% from March's 158,102 IPs to 80,193 IPs, and is down 51.4% from April 2025's 165,083.Top Trading Countries
U.S. buyers and sellers were involved in 34 of 110 transactions, consistent with the country's dominant share of legacy allocations and ongoing infrastructure investment. The UK's 10 deals reflect continued post-Brexit digital infrastructure build, while Sweden's 8 transactions appear concentrated among a small number of Nordic operators. Canada (7 deals) and the Netherlands (5) round out a top five that collectively accounts for 58% of all activity.BEAD Broadband Program Impact
The $42.45 billion BEAD broadband program is moving from planning into execution phase, and the implications for IPv4 demand are starting to materialize. Rural ISPs and new-build fiber operators qualifying for BEAD grants will need routable address space — typically /22s and /20s — and many lack existing allocations. We expect BEAD-related demand to become visible in transaction data by late 2026, potentially creating a floor under mid-size block pricing even as the broader market trends lower.Hyperscaler IPv4 Holdings
Amazon, Microsoft, and Google collectively hold an estimated 150-200 million IPv4 addresses — enough to supply the entire transfer market for years at current transaction volumes. Amazon's public IPv4 charging policy has already catalyzed returns of underutilized space to the market, and any similar moves by Microsoft or Google would add significant supply pressure. These holdings act as a shadow inventory that caps the upside for IPv4 prices, even if near-term demand from AI and BEAD picks up.Macroeconomic Conditions & Market Impact
Enterprise IT budget growth has decelerated into the low single digits for 2026, which damps discretionary IPv4 purchasing by corporates who might otherwise stockpile addresses. Interest rates remain elevated, raising the hurdle rate for speculative IPv4 inventory — holding $1M in address blocks at a 5% cost of capital means you need $50K/year in appreciation or lease income just to break even. The net effect is a buyer's market, and that dynamic is unlikely to reverse until either rates come down or a supply shock materializes.Model Update & Calibration
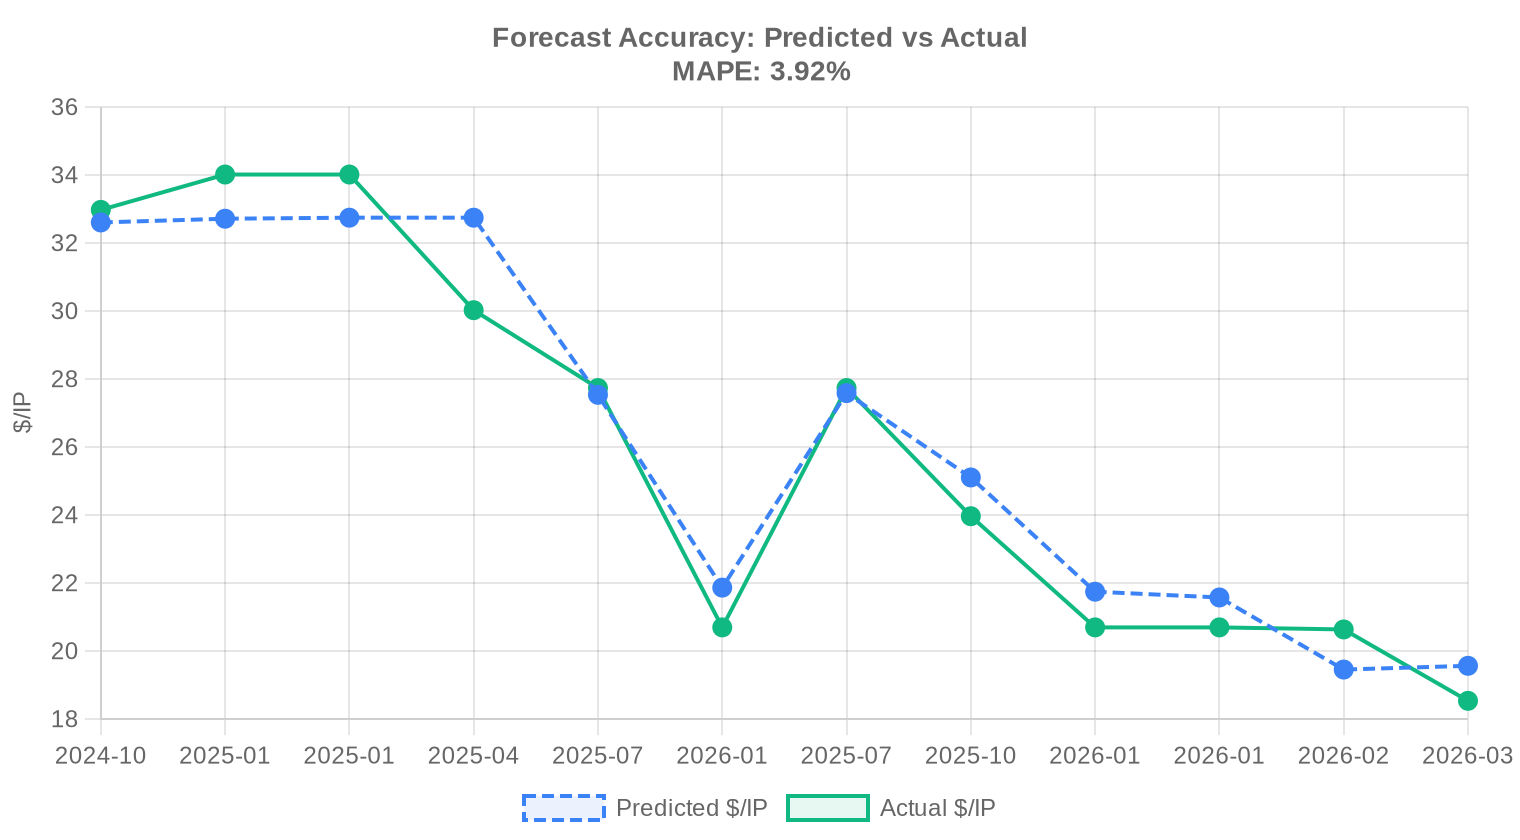
We reviewed our past projections against actual market outcomes and recalibrated the model for this report. The updated model places more weight on recent price movements using exponential decay, dynamically adjusts prediction bands to reflect current market conditions, and corrects for any systematic bias detected in earlier forecasts. The predicted-vs-actual comparison chart below shows how closely our past estimates tracked reality.
| Report Period | Target Month | Predicted | Actual | Deviation |
|---|---|---|---|---|
| 2025-Q2 | 2025-07 | $28 | $28 | -1% |
| 2025-Q3 | 2025-10 | $25 | $24 | +5% |
| 2025-H2 | 2026-01 | $22 | $21 | +5% |
| 2025-Q4 | 2026-01 | $22 | $21 | +4% |
| 2026-01 | 2026-02 | $19 | $21 | -6% |
| 2026-02 | 2026-03 | $20 | $19 | +6% |
Methodology
Figures are based on completed IPv4Center marketplace transactions and RIR transfer statistics. Prices are in US dollars per IP address. Forecasts are produced by an AI model that analyses each block-size band and RIR segment separately (with outlier-trimmed medians) alongside known market catalysts; they are estimates, not guarantees.
Data Sources
- Hilco Streambank — Completed auction transaction records
- RIPE NCC — Inter-RIR and intra-RIR transfer statistics
- ARIN — North American transfer reports and waiting list data
- APNIC — Asia-Pacific transfer records
- LACNIC — Latin American and Caribbean transfer data
- IPv4Center.com — Proprietary marketplace transaction and lease pricing data
This report is generated automatically for informational purposes only and does not constitute financial advice.
Frequently Asked Questions
What was the average price per IPv4 address in April 2026?
The market-wide average landed at .56 per IP, with a median of . That 2% gap between mean and median suggests a relatively tight distribution, though outliers on both ends — at the floor, at the ceiling — remind us the market is anything but homogeneous.
How many IPv4 transfers were recorded in April 2026, and what was the total value?
We tracked 110 sale transactions encompassing roughly 677,632 addresses for a combined value of .82 million. Separately, 748 total transfers (including intra-organization and administrative moves) were logged across all RIRs, with RIPE accounting for 503 of those.
Why is RIPE still dominating transfer volume, and should buyers care?
RIPE accounted for 52.7% of transacted IPs in April — 58 deals totaling 394,496 addresses at an average of .97. Liquidity begets liquidity. For buyers, the practical implication is tighter bid-ask spreads and faster deal execution in the RIPE region relative to thinner markets like LACNIC or APNIC.
Why are LACNIC blocks so expensive compared to other RIRs?
LACNIC posted the highest average at .50 per IP — a 25% premium over the global mean — on just 5 transactions covering 7,936 addresses. Scarcity drives the spread: Latin American supply is chronically thin, and cross-RIR transfers into LACNIC territory remain procedurally difficult. The median of suggests most deals priced even higher.
How did ARIN pricing compare to RIPE in April 2026?
ARIN averaged .36 per IP across 40 transactions, roughly 8% below RIPE's .97 average. The ARIN median of versus RIPE's reinforces the discount. Paradoxically, ARIN posted the month's single highest per-IP price at , likely a small block with strategic value.
What was the most commonly traded prefix size in April?
The /24 (256 addresses) was the most frequently transacted block size, with 27 deals — roughly a quarter of all transactions. This is consistent with the long-standing pattern of smaller operators acquiring minimum-viable BGP-routable blocks for deployment.
What does the average deal size of ~80,000 IPs tell us about buyer composition?
An average deal size of 80,193 IPs is large — roughly equivalent to a /15 block. While /24 trades were the most frequent, a handful of outsized transactions pulled the mean up dramatically. Five deals exceeded million for a combined .69 million, confirming that institutional and infrastructure-scale buyers continue to anchor the market.
Is the IPv4 market trending up or down right now?
Down. April's data shows a 1.73% month-over-month decline in average pricing. Our forecast model, which we rate as reliable, projects further erosion to approximately .70 in May and .24 by December 2026. The trajectory is gradual, not a cliff — but the direction is unambiguous.
What mistakes should buyers avoid in a declining price environment?
The cardinal sin is panic-buying large blocks at premium prices to 'lock in' supply. With pricing projected to fall to .24 by year-end, a buyer acquiring a /16 today at per IP would overpay by roughly 0,000 versus a December purchase. Unless operational urgency demands immediate deployment, patience is the rational strategy.
What are the risks of waiting too long to buy IPv4 addresses?
While the trend favors buyers, supply is finite and lumpy. Large institutional acquisitions can temporarily drain available inventory in a given RIR, creating localized price spikes. We saw ARIN's max price hit this month — nearly double the median — likely reflecting competitive bidding on a desirable block. Forecast models project averages, not guarantees.
Should I buy or lease IPv4 space at current rates?
Buy. At current lease rates of .59 per IP per month (0/month for a /24) and a purchase price of .56 per IP, the breakeven is just 33.4 months — under 3 years. The implied annual yield on owned space is 35.9%. Unless you need addresses for fewer than 33 months, acquisition is the superior economic choice.
What is the current lease rate for IPv4 addresses, and how is it determined?
Based on 44 observed lease transactions, the going rate is approximately .59 per IP per month, or .03 annually. For a /24 block, that translates to 0/month. Most lease pricing data derives from the RIPE region, where the secondary lease market is most mature. Rates in other RIRs may vary but comparable data is sparse.
How does the 35.9% implied yield on IPv4 ownership compare to other infrastructure assets?
It is exceptionally high. Data center REITs yield 3-5%, cell tower leases 6-8%. A 35.9% annual yield on a depreciating digital asset reflects the unusual economics of a market where lease demand remains robust even as purchase prices soften. The risk, of course, is that lease rates follow purchase prices downward.
Which countries were the most active buyers in April 2026?
The United States led decisively with 34 transactions, followed by the United Kingdom (10) and Sweden (8). Canada placed fourth with 7 deals, and the Netherlands rounded out the top five at 5. The geographic distribution underscores the continued dominance of North American and Western European infrastructure demand.
What are the risks of buying LACNIC or APNIC blocks specifically?
Liquidity risk is the primary concern. LACNIC saw just 5 deals and APNIC only 7 in April, versus 58 for RIPE. Thin markets mean wider spreads, longer time-to-close, and potential difficulty reselling. APNIC's inter-RIR transfer restrictions add procedural complexity. These blocks may suit operators with region-specific needs but are poor choices for speculative inventory.
How long does a typical IPv4 transfer take to complete?
Timeline varies by RIR. ARIN transfers typically close in 15-30 business days given their structured pre-approval process. RIPE transfers can move faster — often 10-20 business days — owing to a lighter-touch policy framework. APNIC and LACNIC transfers are less predictable, often stretching to 45+ days due to additional compliance reviews.
Why hasn't IPv6 adoption killed the IPv4 market yet?
Because IPv6 adoption, while growing, remains incomplete in precisely the markets that matter most — enterprise, cloud edge, and IoT gateway deployments where legacy compatibility is non-negotiable. As long as significant portions of the internet remain IPv4-only or dual-stack, operators need routable IPv4 space. The declining price trend, however, suggests the market is beginning to price in the long-run inevitability of transition.
What is the projected average IPv4 price by December 2026?
Our model projects .24 per IP by year-end, implying an additional ~12% decline from April's .56 average. We assess this forecast as reliable. The trajectory suggests a market finding its post-peak equilibrium rather than a disorderly selloff.
What drove the -per-IP floor price observed in April?
Sub-market pricing at /IP — roughly half the median — typically reflects blocks with reputational baggage (spam listings, prior abuse), awkward subnet sizes, or sellers prioritizing speed over price maximization. Both RIPE and ARIN recorded transactions at this floor. Buyers should conduct thorough blocklist and Spamhaus checks before acquiring bargain-priced inventory.
What mistakes do sellers commonly make in the current market?
Overpricing relative to the trend is the most frequent error. Sellers anchoring to 2024-era valuations will find their blocks languishing while the market moves away from them. With prices projected to fall another 12% by year-end, listing today at is rational; waiting six months hoping for is not. The other common mistake is neglecting to clean up abuse records before listing, which can slash achievable price by 30-50%.
How concentrated is the market by deal size?
Highly. The 5 largest transactions (> M each) accounted for .69 million — a staggering 87% of total market value — while representing just 4.5% of deal count. At the other end, 83 sub-K deals contributed only .32 million. The IPv4 market, like most asset markets, follows a power law.
Are there any AFRINIC transfers happening?
Effectively zero. AFRINIC recorded no transactions, no transferred IPs, and no transfer activity of any kind in April 2026. Ongoing governance challenges and policy uncertainty have rendered the AFRINIC transfer market dormant. Buyers seeking African-region space are largely working through RIPE allocations or private arrangements outside the formal registry system.
What is the total historical transfer volume across the major registries?
Over the trailing 40-month window through April 2026, we count approximately 33,115 total transfers. RIPE commands 59.9% of cumulative volume, with ARIN at 40.1%. APNIC, LACNIC, and AFRINIC register negligible shares. The December 2024 peak month remains the high-water mark for monthly transfer activity.
Is there any risk that RIR policy changes could disrupt the transfer market?
Always. RIR transfer policies are set by community consensus and can shift. APNIC's existing inter-RIR transfer restrictions already constrain liquidity. Any move by RIPE or ARIN to tighten needs-based justification requirements, impose holding periods, or restrict speculative acquisitions could materially impact pricing and volume. Policy risk is the market's perpetual background hum.
For a company needing a single /24, what should they realistically budget?
At April 2026 median pricing, a /24 (256 IPs) runs approximately ,007 at purchase — call it ,000 in round numbers. Add transfer fees (0-0 depending on RIR), broker commissions if applicable (5-10%), and due-diligence costs. All-in, budget ,500-,000 for a clean RIPE or ARIN /24. Alternatively, lease at 0/month, but that only makes sense if your need horizon is under 33 months.