16 min read
This report analyzes the IPv4 transfer market for 2024, based on completed IPv4Center marketplace transactions and official RIR transfer records.
Executive Summary
The IPv4 transfer market in 2024 processed 752 transactions covering 1,818,624 addresses for a combined value of $60.6 million. The weighted average price landed at $33.09 per IP — down 12.2% from 2023 — while the median held at $32. Transaction volume surged 38.5% year-over-year, a sharp acceleration that signals active portfolio restructuring rather than a cooling market. The pricing floor sat at $26 per IP and the ceiling hit $50.12, producing a $24.12 spread that reflects persistent segmentation between bulk institutional trades and retail /24 pickups. RIPE-region blocks accounted for 41.2% of deal flow, but ARIN addresses continued to command a per-IP premium.Market Overview
| Transactions | 752 |
| IP Addresses Traded | 1,818,624 |
| Estimated Market Value | $60,628,036 |
| Average Price / IP | $33.09 |
| Median Price / IP | $32.00 |
| RIR Transfers | 10,553 |
Year-over-Year Comparison
| Metric | This period | A year earlier (2023) | Change |
|---|---|---|---|
| Transactions | 752 | 543 | +38.5% |
| IP Addresses Traded | 1,818,624 | 1,661,696 | +9.4% |
| Estimated Market Value | $60,628,036 | $69,968,916 | -13.4% |
| Average Price / IP | $33.09 | $37.68 | -12.2% |
| RIR Transfers | 10,553 | 9,189 | +14.8% |
Price Dynamics
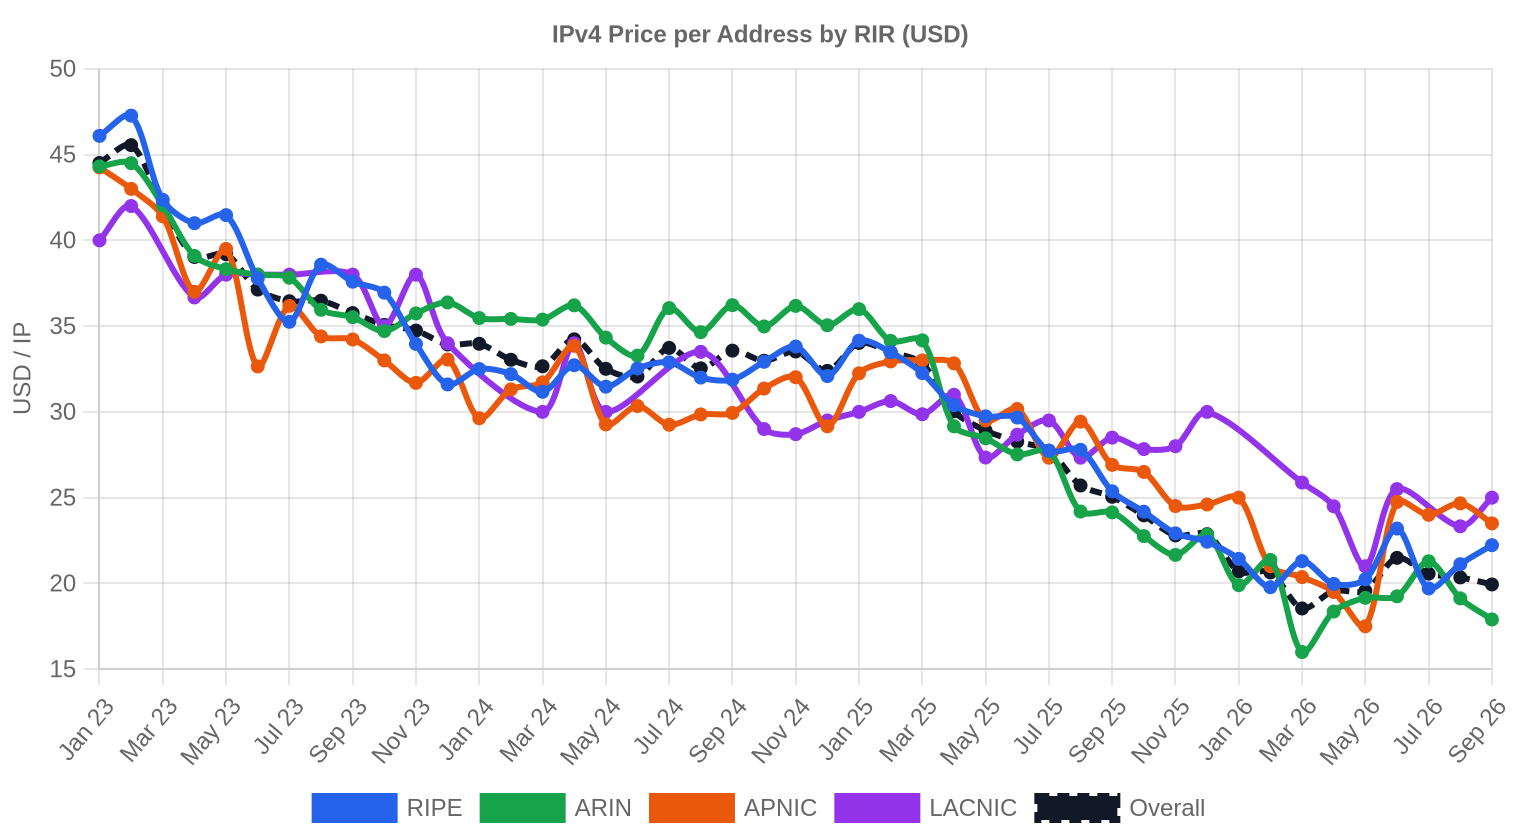
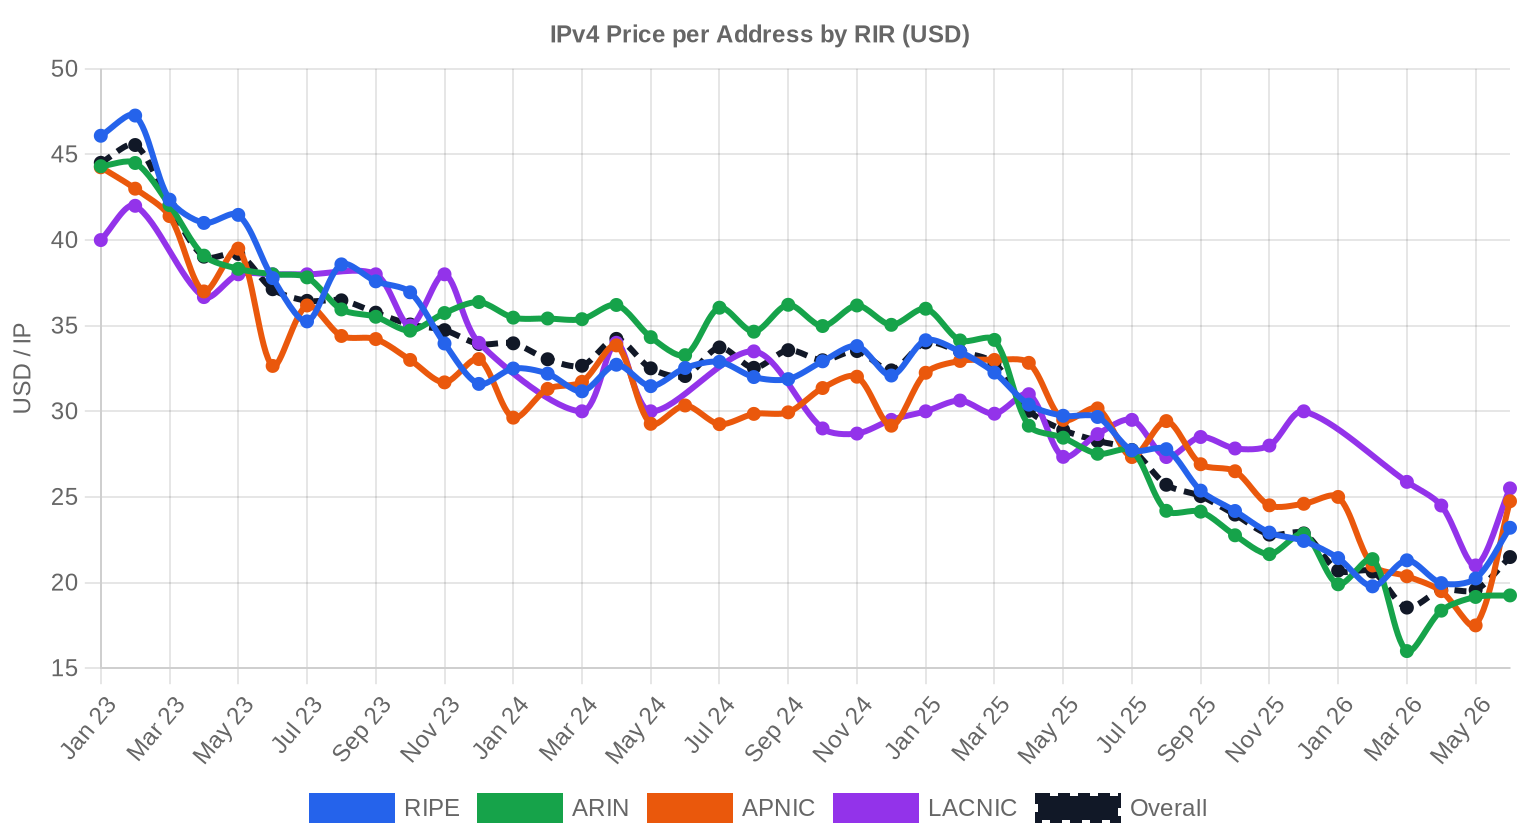
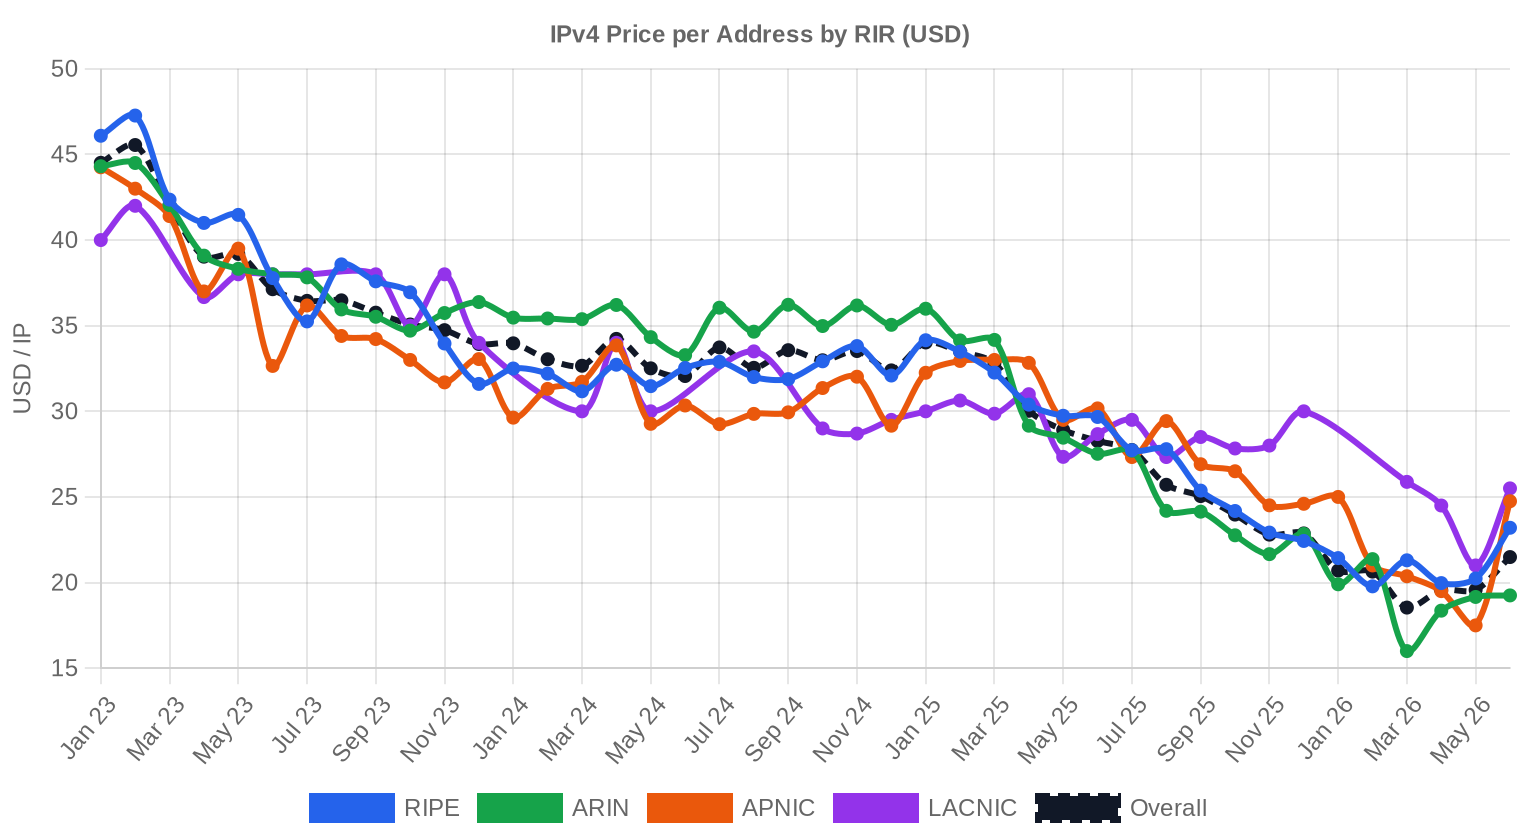
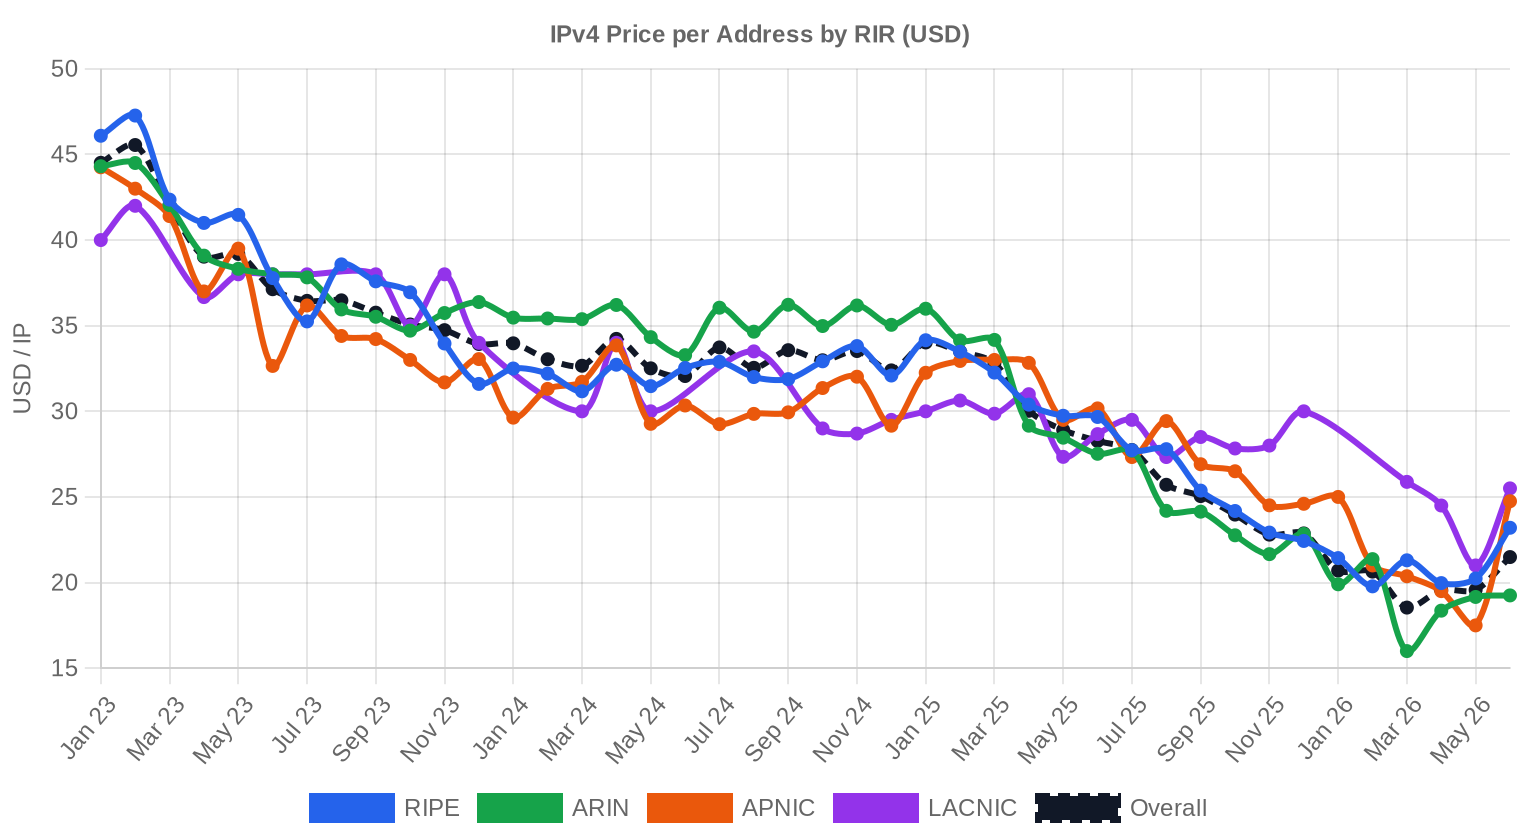
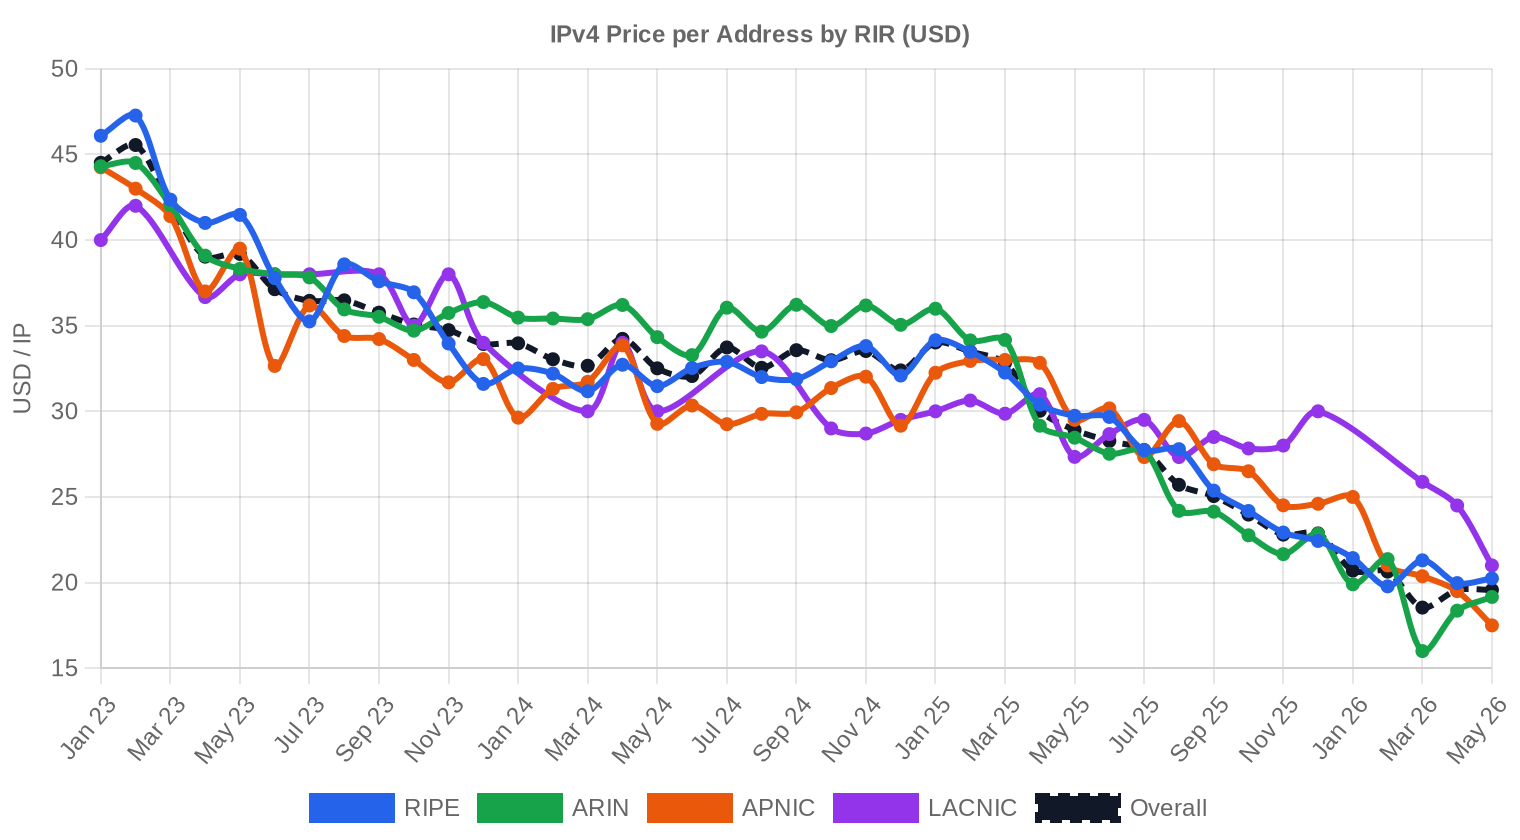
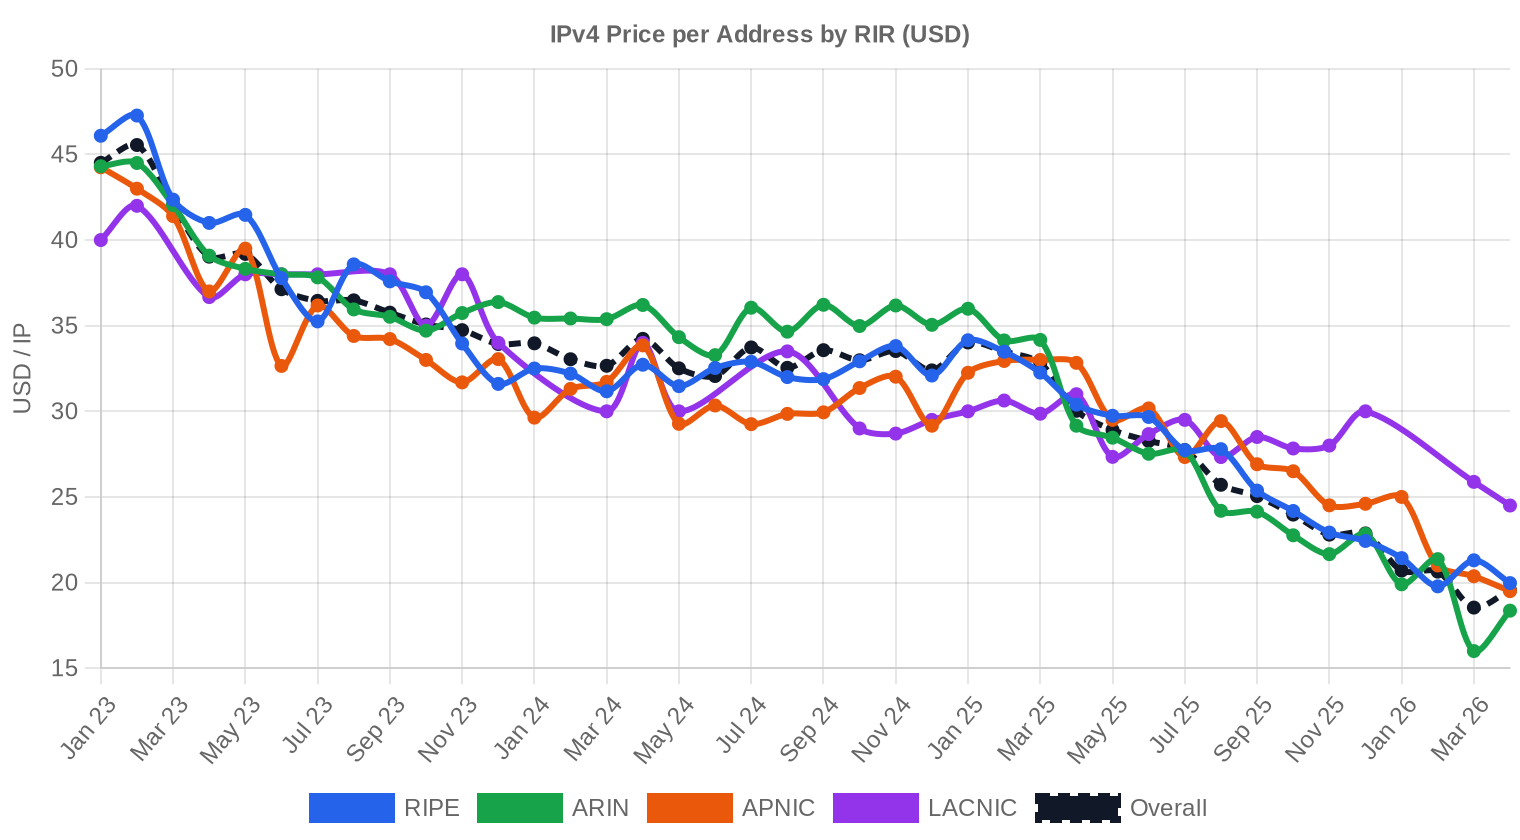
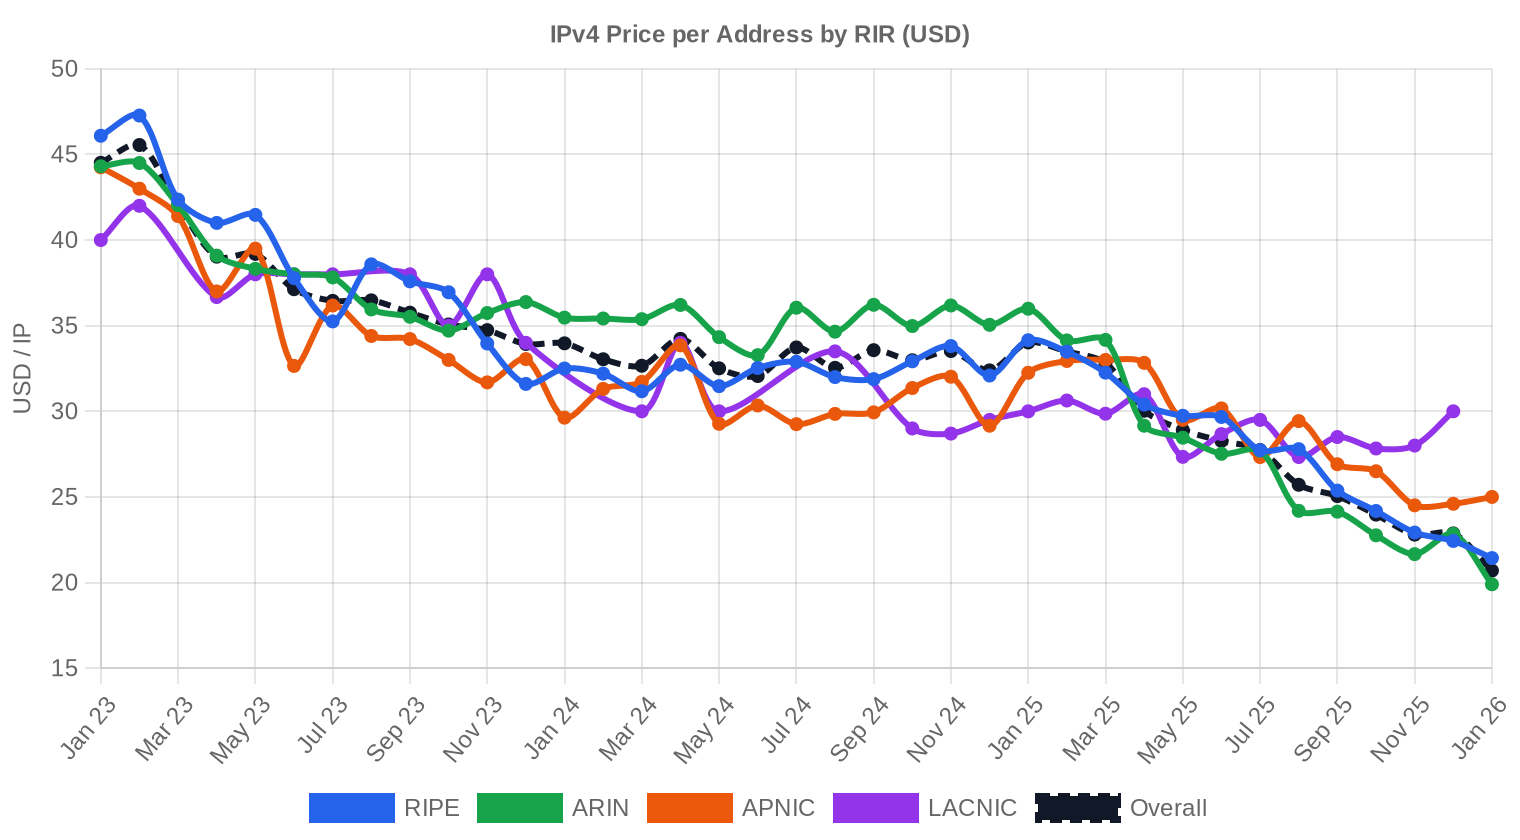
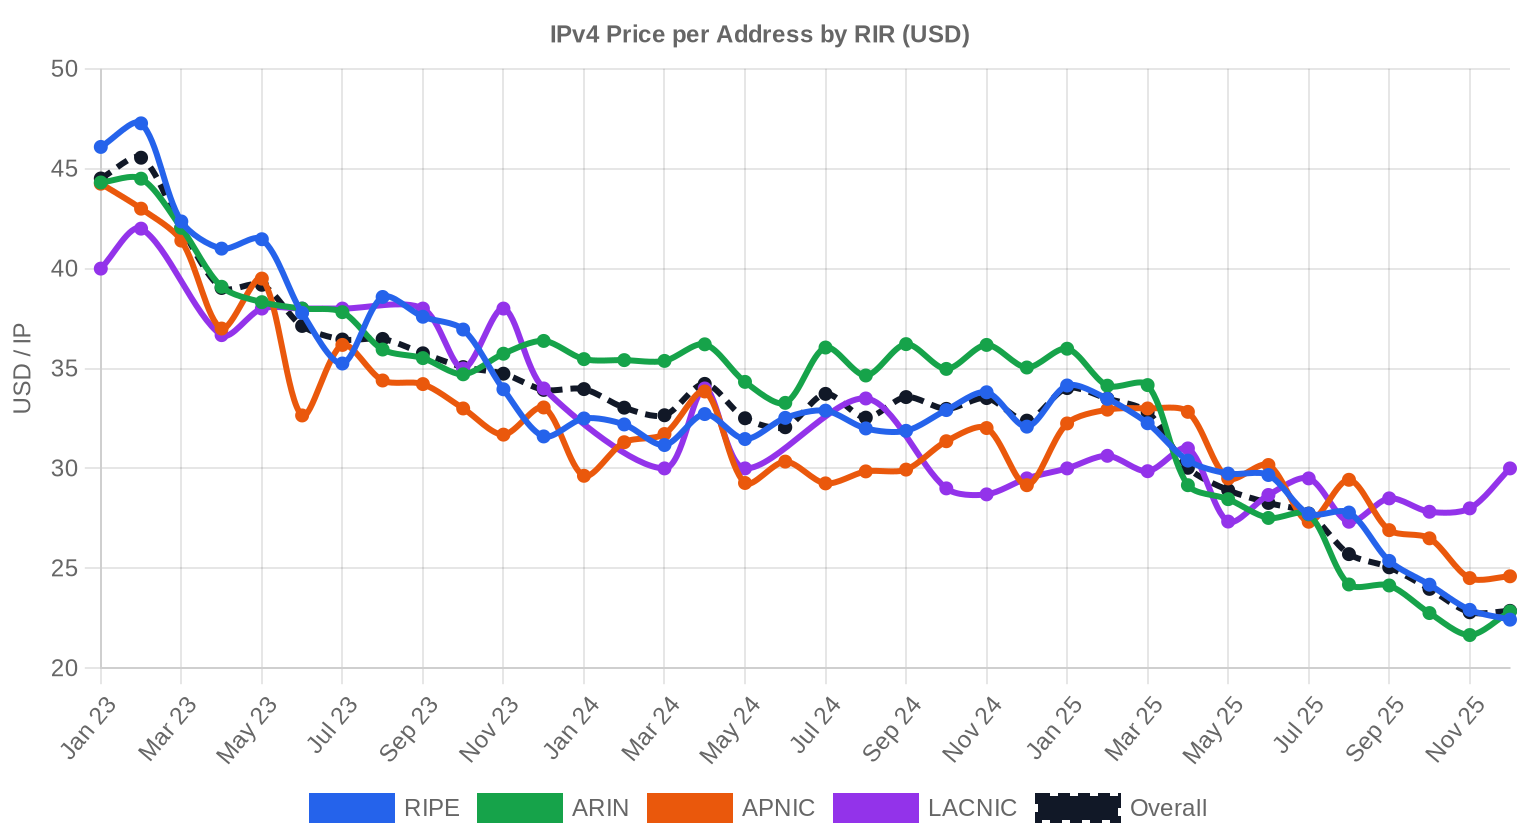
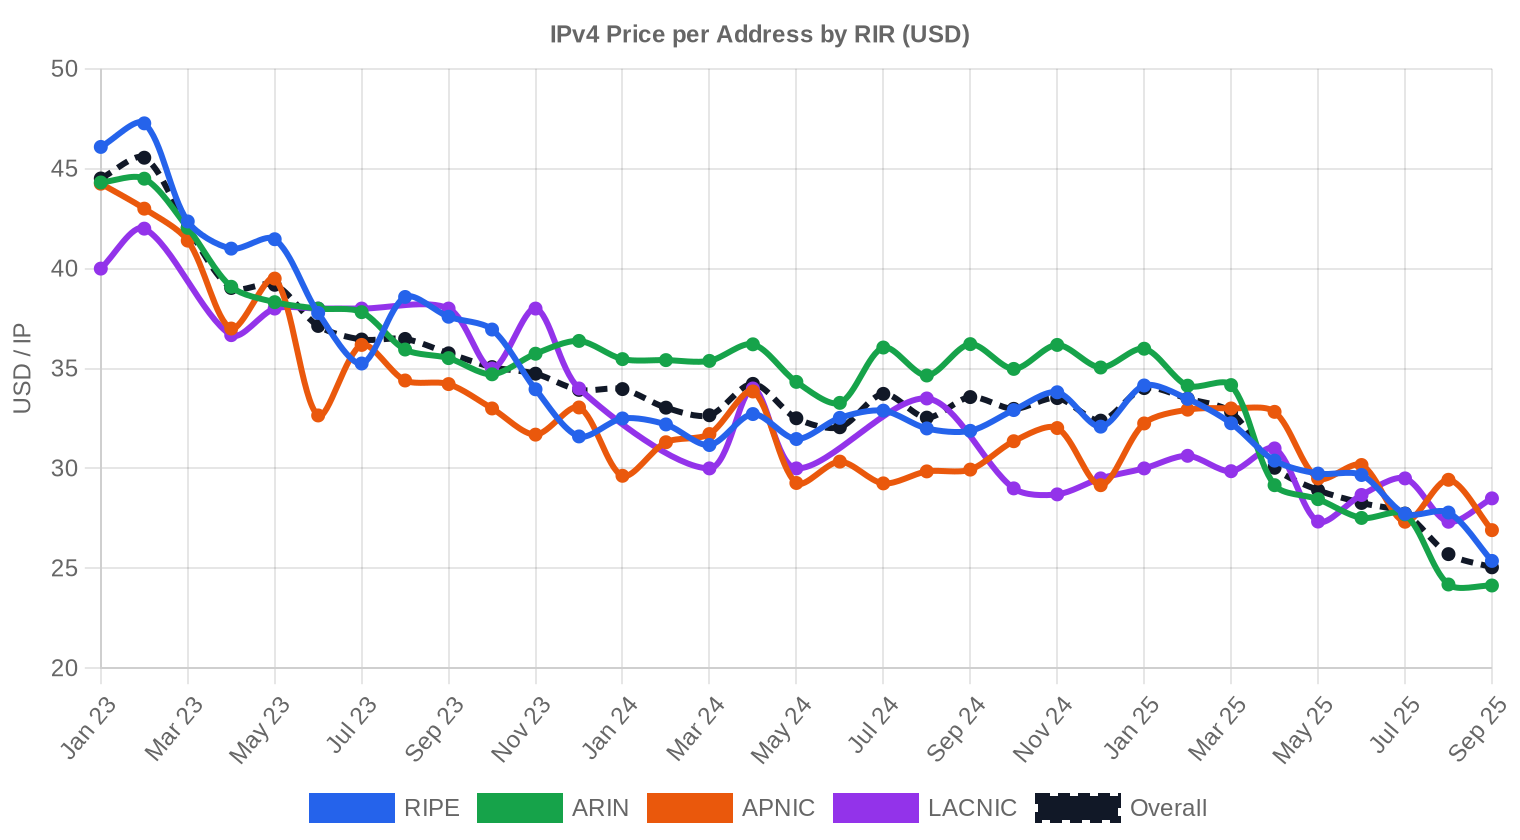
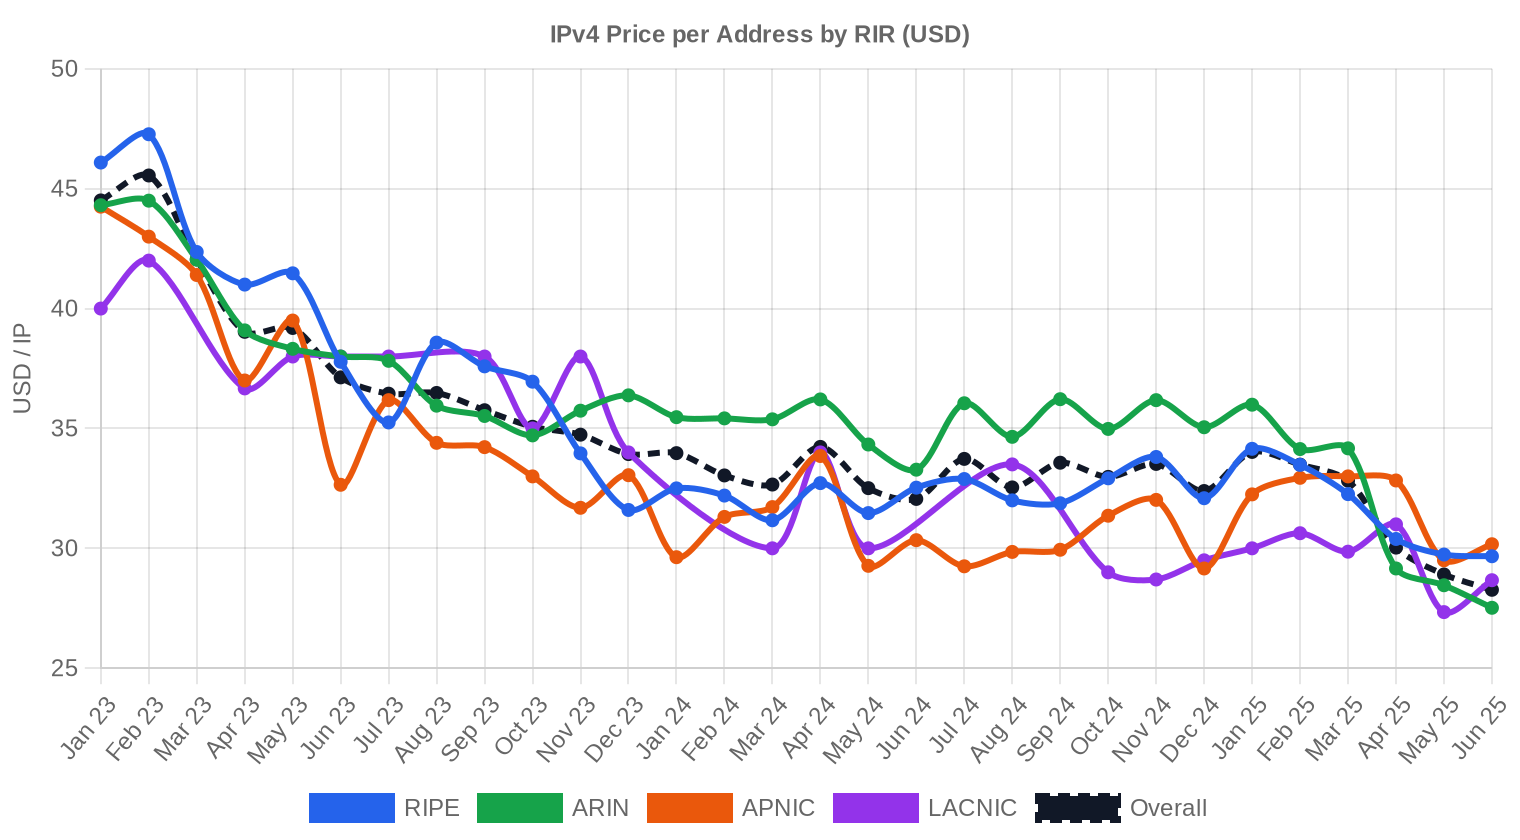
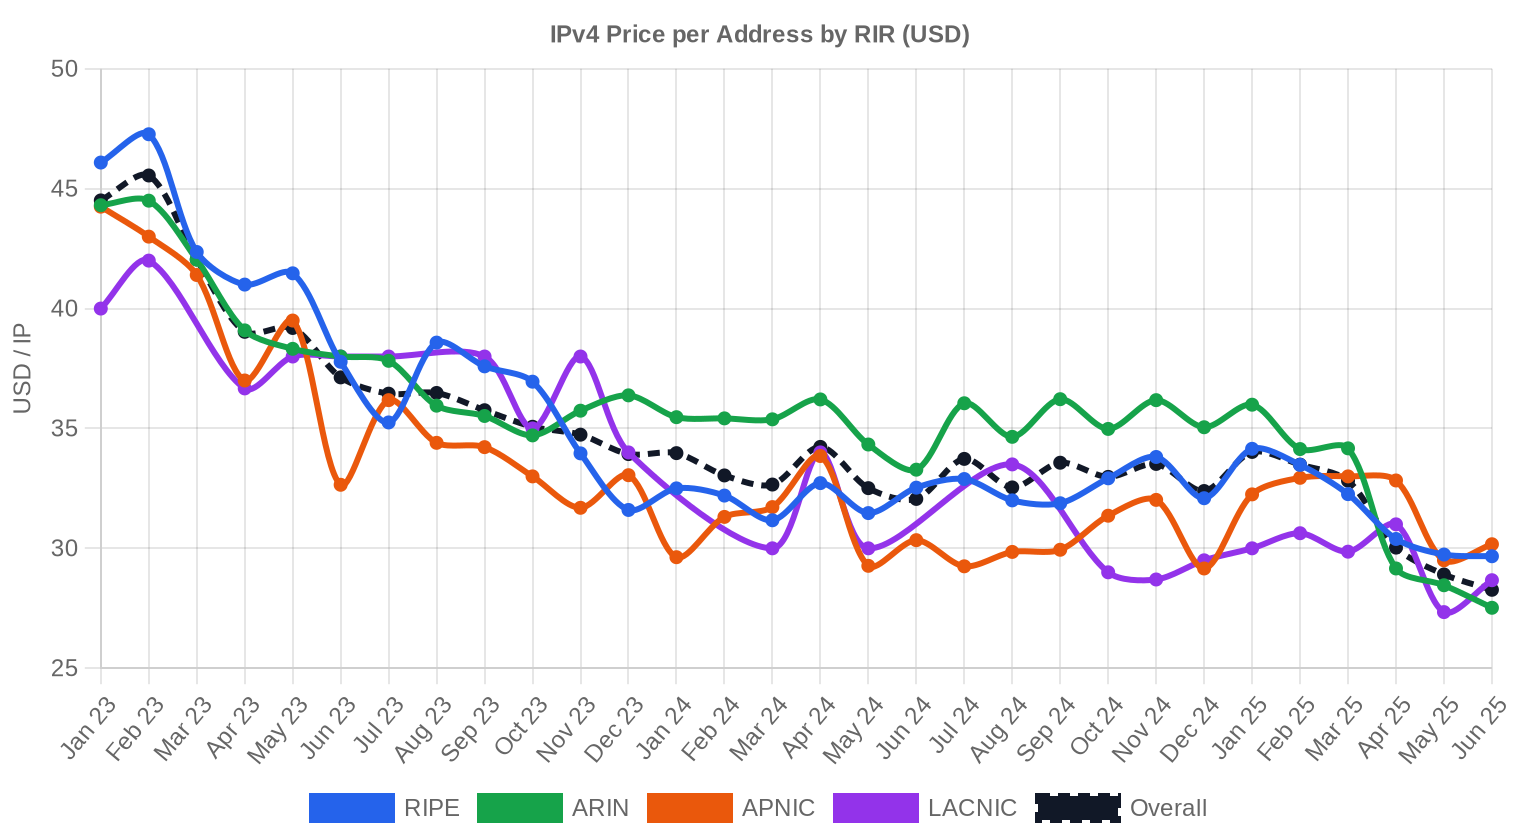
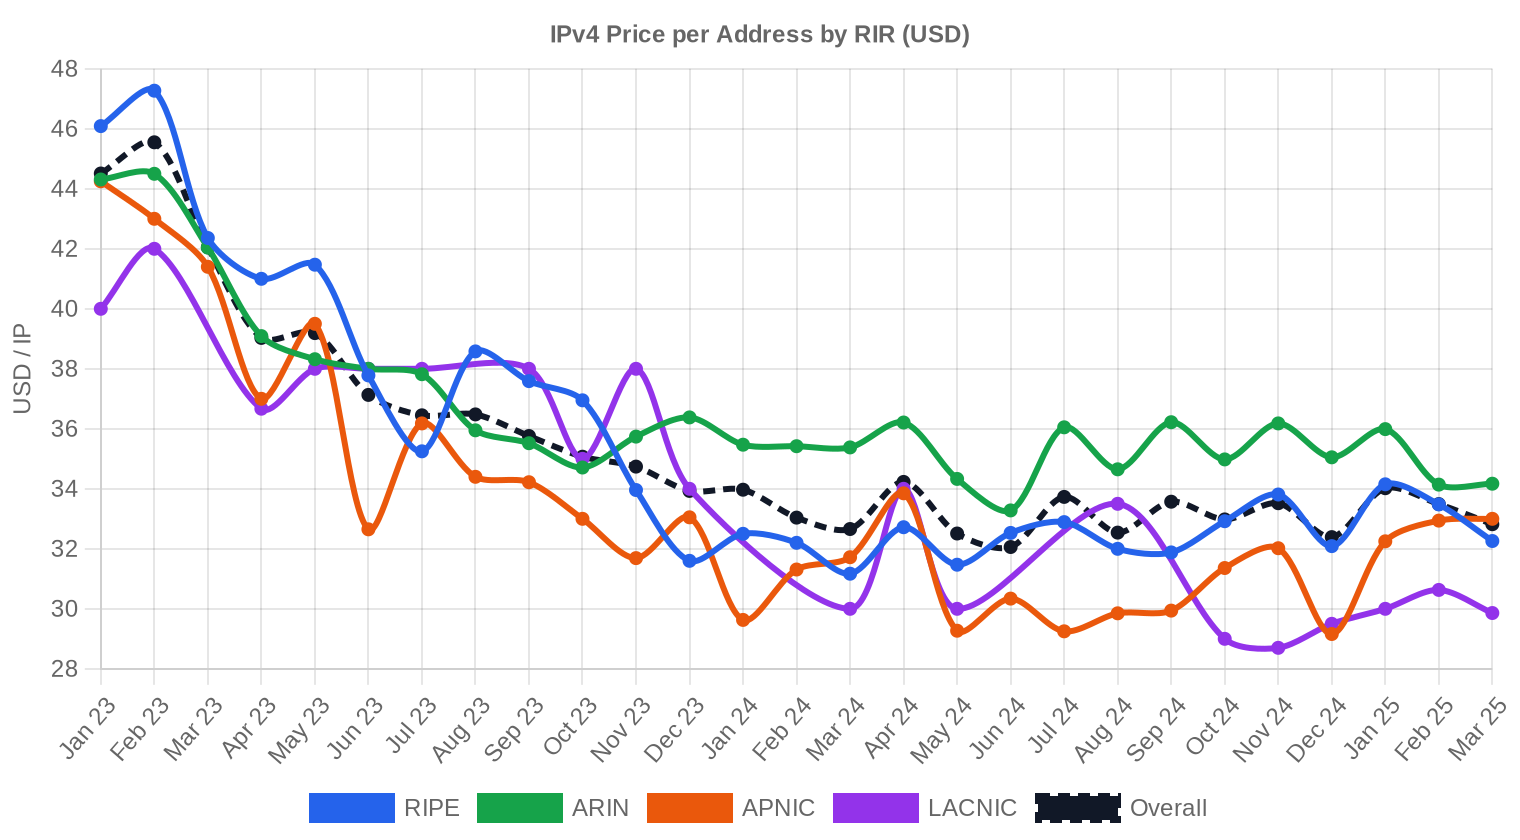
The 12.2% year-over-year decline in average pricing is the headline number, but it requires context: average deal size contracted from 128,856 IPs in 2023 to 80,622 IPs in 2024 — a 37.4% drop — which means more small-block trades pulled the average down mechanically even as larger blocks repriced lower. The $26 floor represents aggressive bulk deals in APNIC and LACNIC territory, while the $50.12 ceiling came from a single APNIC transaction likely involving a clean, well-documented /24 or small block with premium routing history. The regression trend across the year showed a very modest 0.43% upward slope, suggesting the market found its footing in H2 after the price reset absorbed most of the AWS public IPv4 charge impact that began rippling through in mid-2023. The median of $32 — just $1.09 below the average — indicates a relatively normal distribution with limited skew from outlier transactions.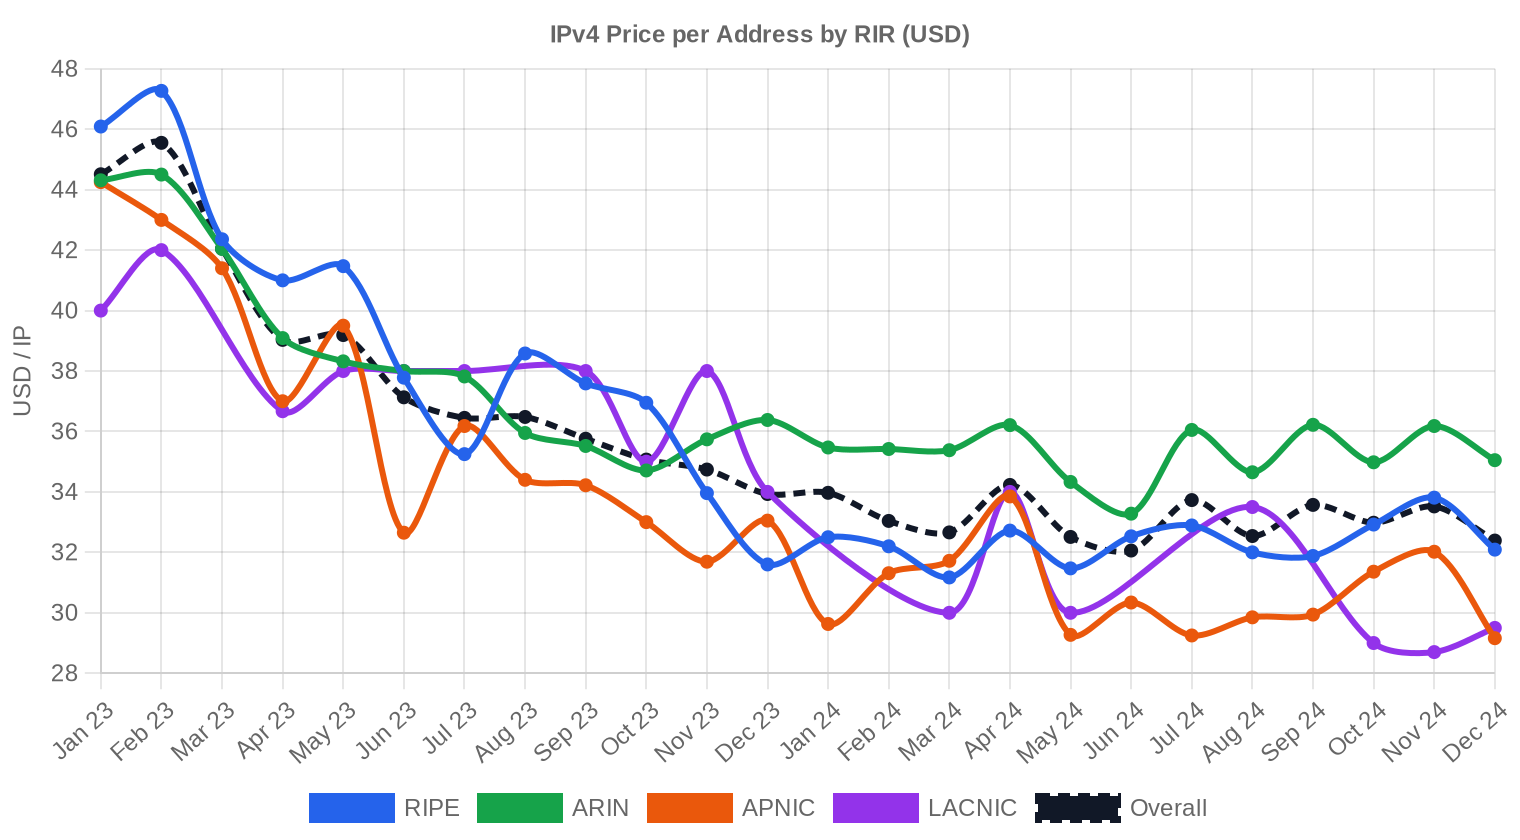
Pricing by RIR
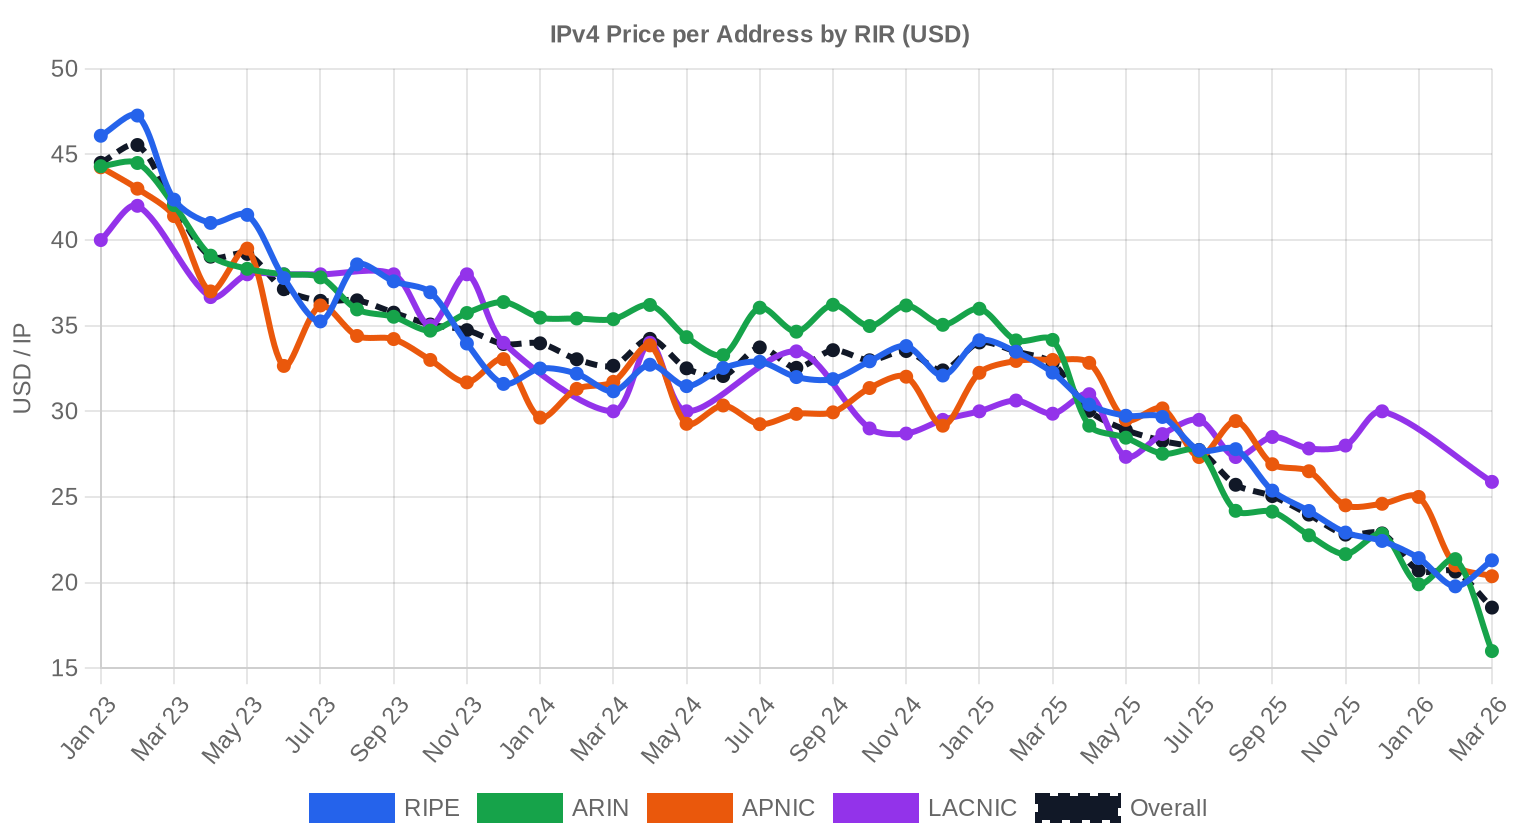
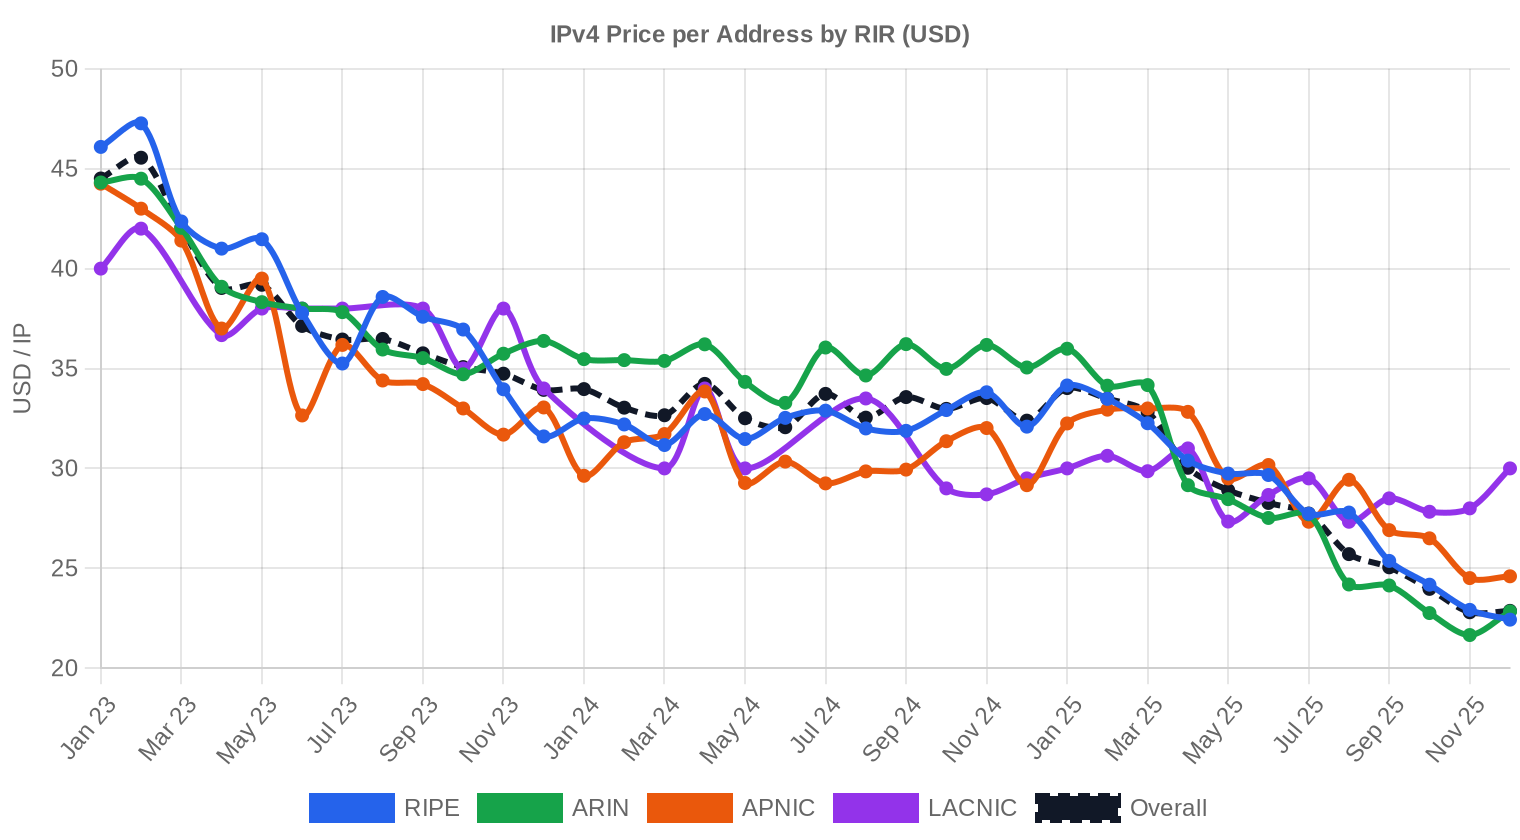
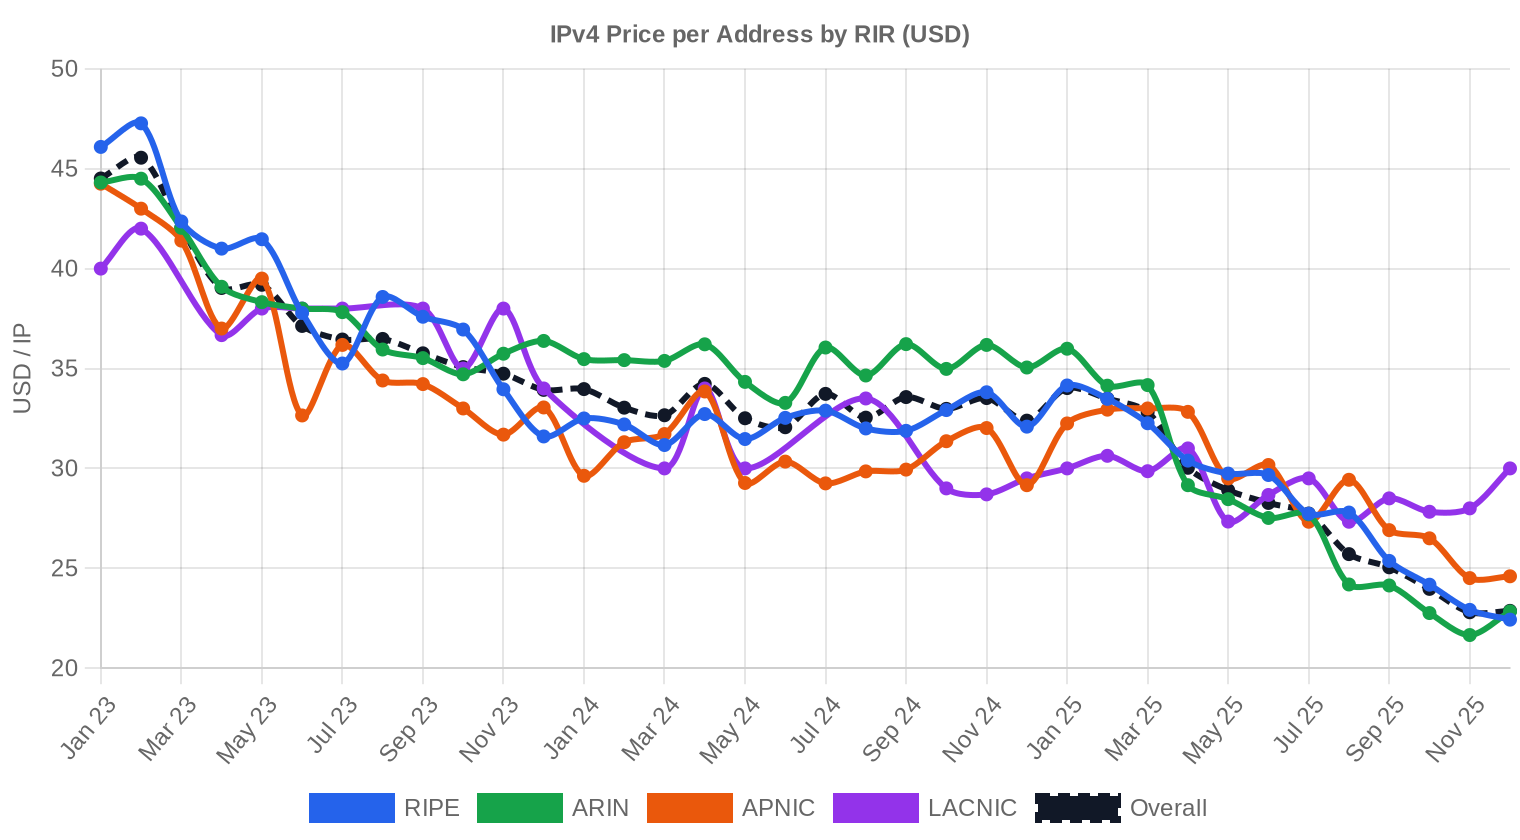
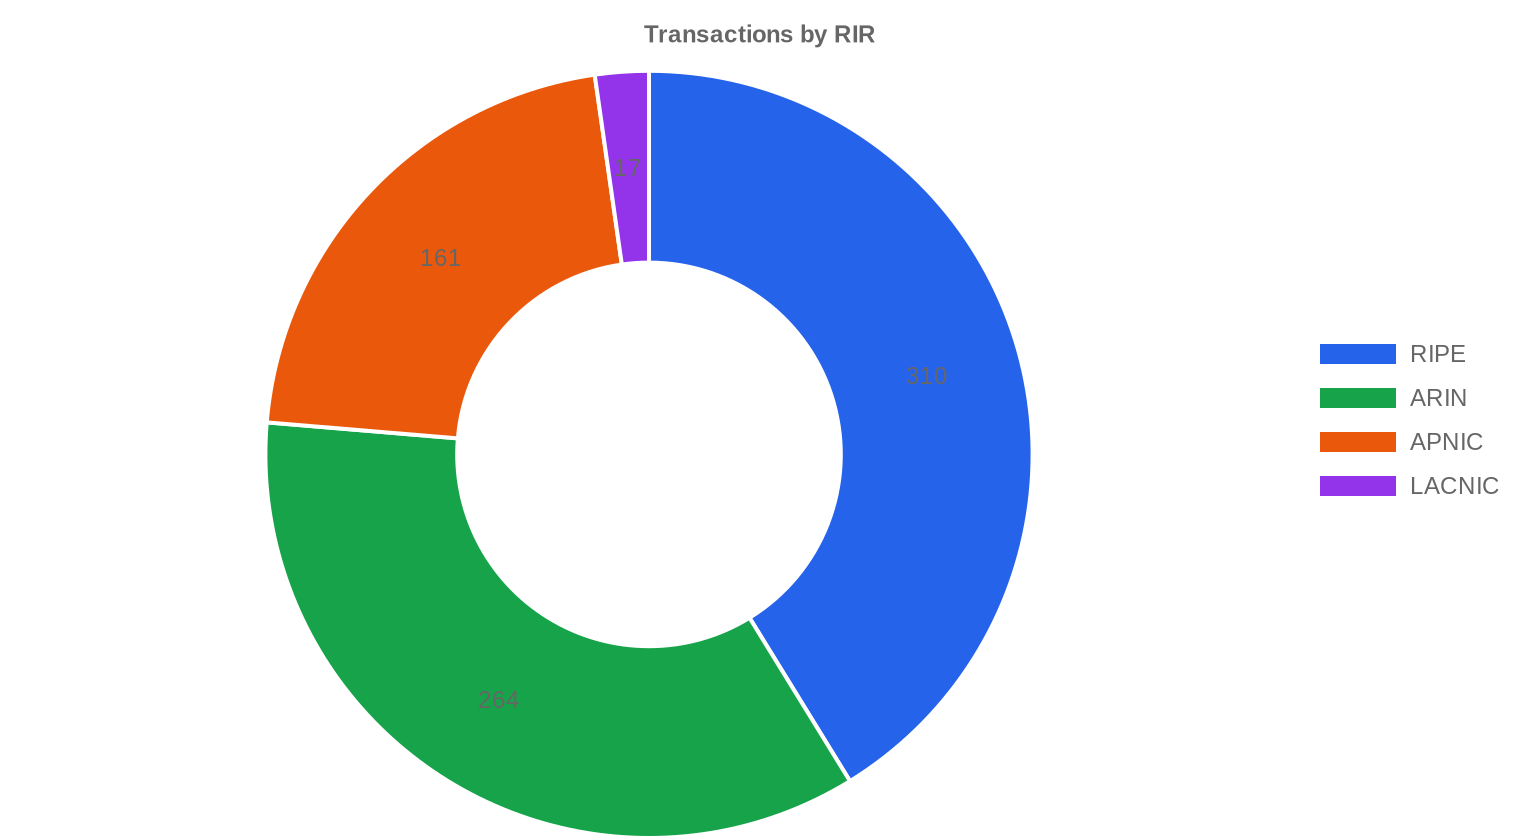
ARIN addresses remain the most expensive IPv4 real estate on the planet, averaging $35.29 per IP across 264 transactions — a $2.95 premium over RIPE and a full $4.01 above APNIC. That gap is widening, not shrinking, driven by U.S. regulatory clarity on transfers and the relative ease of ARIN's process for domestic buyers. RIPE blocks averaged $32.34 per IP across 310 transactions, making the European registry the volume leader at 41.2% of all deals. APNIC came in at $31.28 across 161 transactions — cheap on a per-IP basis but the region produced the single highest recorded price at $50.12, reflecting acute scarcity for clean blocks in specific Asian markets. LACNIC remains a footnote: 17 transactions, $29.91 average, and a narrow $26.50–$38.00 range that reflects the thin liquidity in Latin American address space.RIPE: $32.34 per IP across 310 transactions (41.2% of volume).
ARIN: $35.29 per IP across 264 transactions (35.1% of volume).
APNIC: $31.28 per IP across 161 transactions (21.4% of volume).
LACNIC: $29.91 per IP across 17 transactions (2.3% of volume).
AFRINIC: Zero recorded market transactions due to ongoing governance issues.
| RIR | Transactions | Avg $/IP | Median $/IP | IPs Traded | RIR Transfers | Next Month (proj.) | Year-End (proj.) |
|---|---|---|---|---|---|---|---|
| RIPE | 310 | $32.34 | $32.00 | 745,216 | 6,651 | $32.00 | $33.00 |
| ARIN | 264 | $35.29 | $35.00 | 685,056 | 3,902 | $35.00 | $36.00 |
| APNIC | 161 | $31.28 | $31.00 | 358,144 | 0 | $30.00 | $30.00 |
| LACNIC | 17 | $29.91 | $30.00 | 30,208 | 0 | $29.00 | $28.00 |
Transaction Volume
Supply & Block Sizes
The /24 block (256 IPs) dominated 2024 trading with 288 transactions — 38.3% of all deals — confirming the continued fragmentation of available supply. Buyers gravitate toward /24s because they represent the minimum independently routable block, making them the entry-level unit for organizations that need their own address space without committing to six-figure outlays. This concentration at the small end of the spectrum is consistent with the shrinking average deal size and suggests institutional sellers are increasingly breaking up legacy /16 and /17 holdings to maximize per-IP revenue.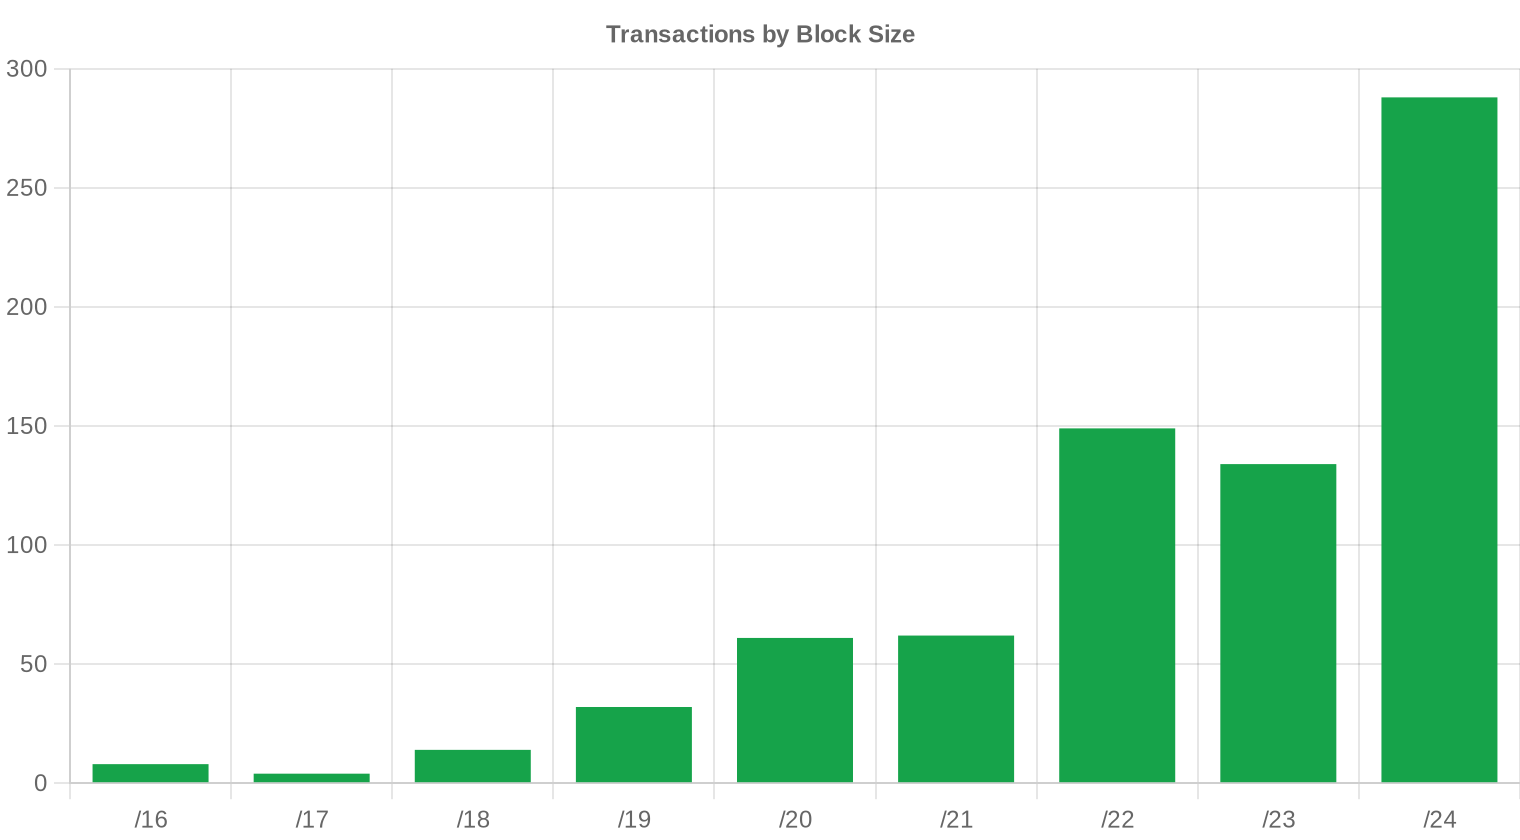
Geographic Activity
Country-level granularity was not available in the 2024 dataset aggregation, though RIR distribution serves as a regional proxy. The RIPE/ARIN duopoly accounted for 76.3% of all transactions, reflecting the depth of secondary market infrastructure in Europe and North America. APNIC's 21.4% share is substantial and growing — driven by ISP expansion in India, Southeast Asia, and Australian cloud deployments.Registry Transfer Activity
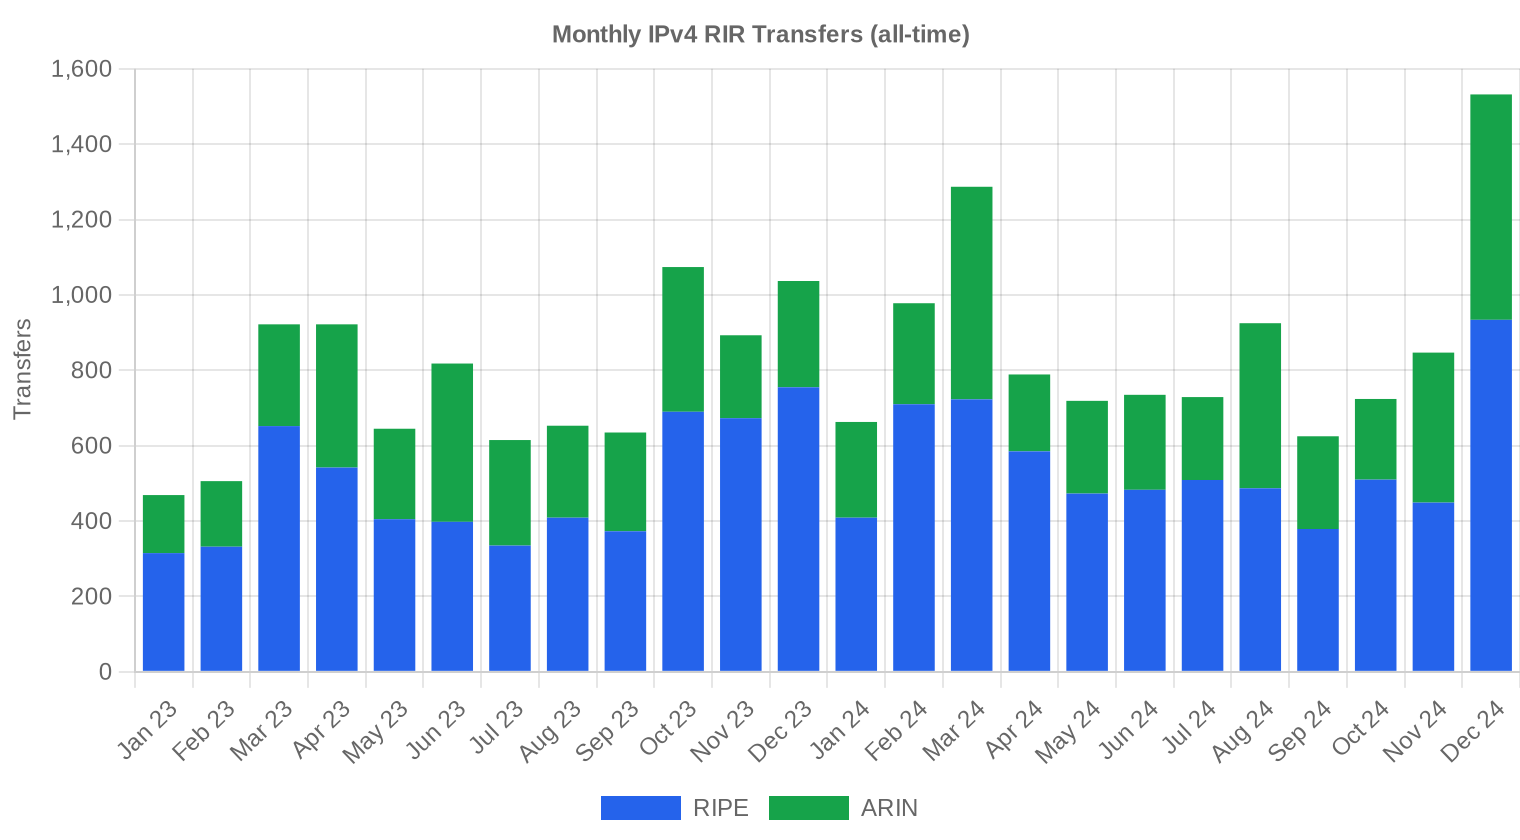
Official RIR transfer records logged 10,553 transfers across all registries in 2024 — a figure that includes both market transactions and intra-organization movements. RIPE led with 6,651 transfers (63% of the total), a reflection of Europe's active address management culture and the sheer number of LIR-to-LIR movements within the RIPE service region. ARIN recorded 3,902 transfers, handling 36.5% of the registry-level activity.Long-Run Transfer Trends
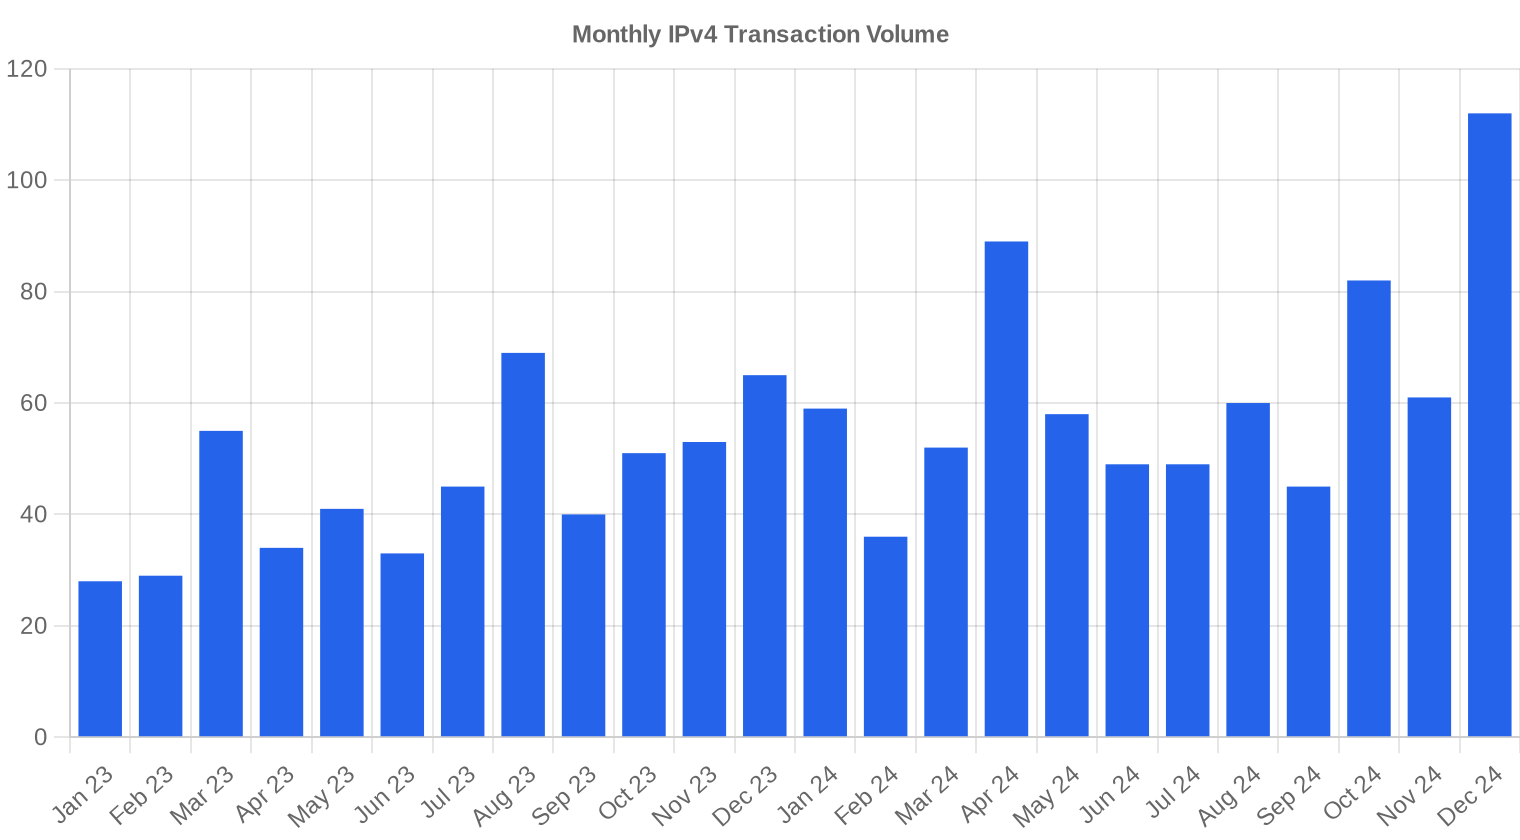
Over the trailing 24 months, the transfer monitoring window captured 19,742 total RIR transfers — a dataset large enough to identify structural patterns. December 2024 marked the peak month for transfer activity, consistent with year-end budget cycles and organizations rushing to close deals before fiscal year cutoffs. The sustained high volume through H2 2024 suggests the 38.5% transaction surge was not a single-quarter anomaly but a genuine acceleration in market velocity.| RIR | RIR Transfers |
|---|---|
| RIPE | 12,530 |
| ARIN | 7,212 |
| RIR Transfers | 19,742 |
Outlook & Forecast
Forecasting each block-size band and RIR separately with our AI model:
The overall average price per IP is projected to reach $33.67 by December 2025, with a next-month estimate of $32.59 per IP.
2024 year-end expectation: $32.00 · 2025 year-end expectation: $33.67 per IP.
- RIPE: projected at $32.00 per IP next month, trending toward $33.00 by December 2025.
- ARIN: projected at $35.00 per IP next month, trending toward $36.00 by December 2025.
- APNIC: projected at $30.00 per IP next month, trending toward $30.00 by December 2025.
- LACNIC: projected at $29.00 per IP next month, trending toward $28.00 by December 2025.
- AFRINIC: insufficient data for a reliable forecast.

Forecast by Block Size
| Block | Current $/IP | Next Month | Year-End | Confidence |
|---|---|---|---|---|
| /24 | $32.00 | $33.00 (+3.1%) | $34.00 (+6.3%) | medium |
| /23 | $32.00 | $32.00 (0.0%) | $33.00 (+3.1%) | medium |
| /22 | $32.00 | $32.00 (0.0%) | $33.00 (+3.1%) | medium |
| /21 | $32.00 | $32.00 (0.0%) | $33.00 (+3.1%) | medium |
| /20 | $33.00 | $33.00 (0.0%) | $35.00 (+6.1%) | low |
| /19 | $35.00 | $35.00 (0.0%) | $36.00 (+2.9%) | low |
| /18-/16 | $31.00 | $31.00 (0.0%) | $32.00 (+3.2%) | low |
| /15-up | $51.50 | $50.00 (-2.9%) | $50.00 (-2.9%) | low |
Editor's Take: Buy vs. Lease
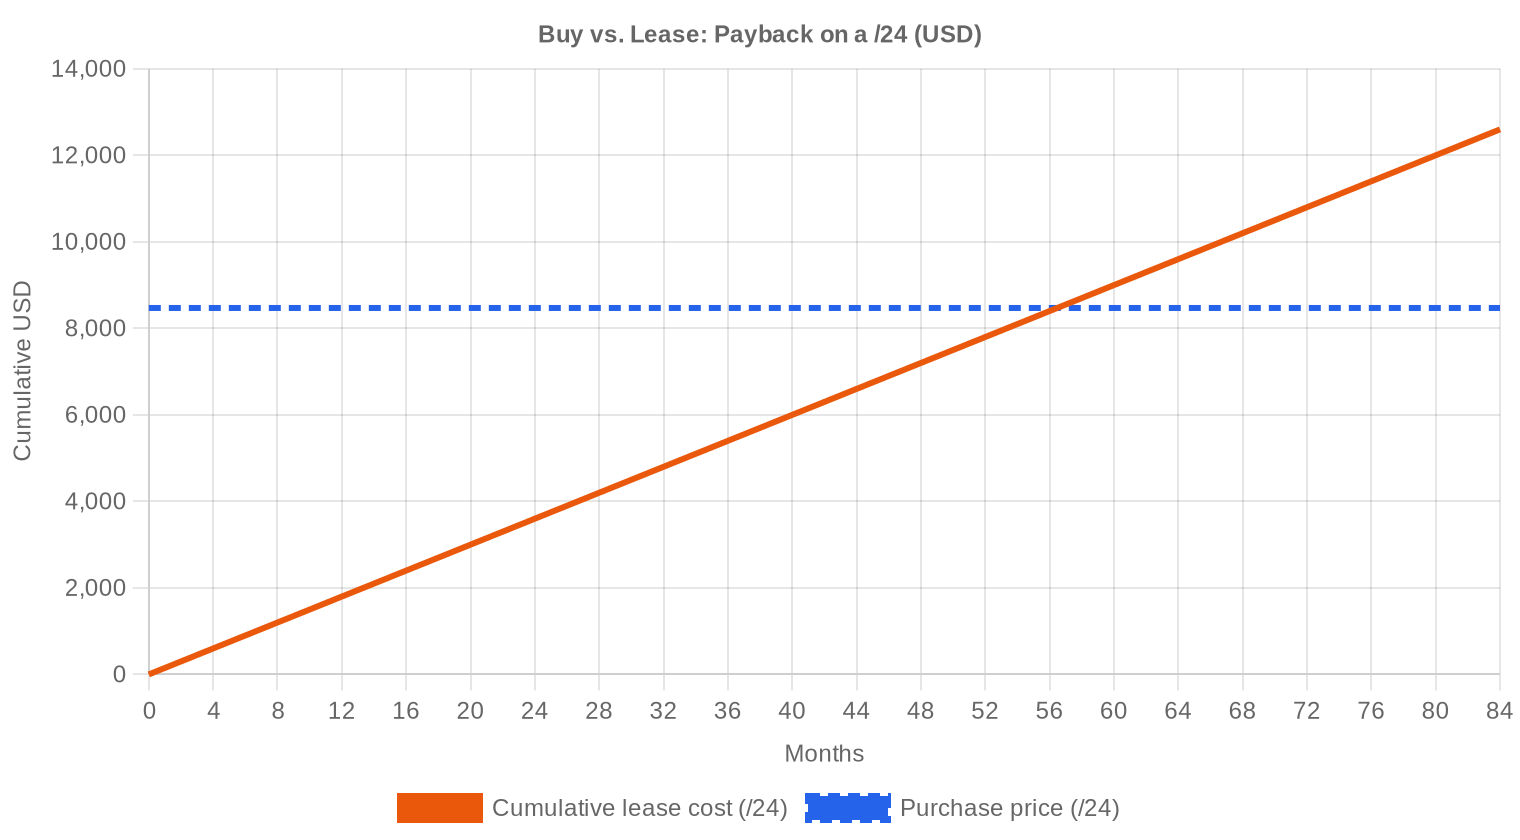
The buy-versus-lease math tilted decisively toward purchasing in 2024. At $33.09 per IP purchase price and a lease rate of $0.5859 per IP per month, the breakeven payback period is 56.5 months — roughly 4.7 years. That makes ownership the clear winner for any organization with a planning horizon beyond five years. The implied annual yield for a block holder leasing out addresses is 21.2%, which is extraordinary by any asset class standard and explains why institutional capital continues to flow into the space. For a /24 specifically, the math works out to $8,471 to buy versus $150 per month to lease — meaning the purchase pays for itself in under five years while the lessee spends $9,000 over that same period with nothing to show for it. Our recommendation: buy if you have the capital and expect to hold addresses for more than four years; lease only as a bridge while navigating a transfer.| /24 Purchase price | $8,471 |
| /24 Lease price | $150 / mo |
| Payback period | 56.5 mo (4.7 yr) |
| Gross annual yield | 21.2% |
What This Means for You
Buyers: The 12.2% price decline from 2023 created a better entry point, but don't wait for $25. The floor has held at $26 across all RIRs and the regression trend turned positive in H2 2024. If you need addresses, the current $32–$35 range represents fair value with limited downside risk.Sellers: The 38.5% surge in transaction volume means there are more buyers in the market than at any point since the 2021–2022 peak. Fragmentation pays — breaking a /16 into /24s will yield a per-IP premium of 15–25% over bulk pricing, though the transaction costs multiply. Consider phased liquidation rather than a single block sale.
Leasers: At $0.59 per IP monthly, leasing remains viable for short-term projects, testing deployments, or organizations awaiting transfer approval. But the 56.5-month breakeven is a hard ceiling on when leasing stops making financial sense.
Block Holders: A 21.2% annual yield on leased-out addresses makes IPv4 one of the highest-yielding digital assets available. If you're sitting on unused space, you're leaving money on the table every month you delay monetization.
Browse verified IPv4 blocksSell IPv4 →
List your blocks with managed transferLease IPv4 →
Flexible short-term capacityLease Out IPv4 →
Turn idle blocks into recurring revenue
IPv4 Pricing by Block Size
The /24 premium remains the defining feature of IPv4 pricing. At 288 transactions, /24s traded at effective per-IP prices near the top of each RIR's range — often $38–$50 per IP — while /16 blocks and larger moved at $26–$32 per IP, reflecting the standard bulk discount. The per-IP gap between a /24 and a /16 can run 40–60%, a spread that has widened over the past two years as small-block demand outpaces supply. Mid-range blocks (/20 through /18) sit in a sweet spot for ISPs and mid-market enterprises, typically pricing within $1–$2 of the market average.| Block | IPs | Buy: /IP | Buy: Total | Lease: /IP/mo | Lease: Monthly |
|---|---|---|---|---|---|
| /24 | 256 | $35–45 | $8,960–11,520 | $0.38–0.50 | $97–128 |
| /22 | 1,024 | $28–38 | $28,672–38,912 | $0.33–0.45 | $338–461 |
| /20 | 4,096 | $22–32 | $90,112–131,072 | $0.30–0.40 | $1,229–1,638 |
| /18 | 16,384 | $20–30 | $327,680–491,520 | $0.30–0.38 | $4,915–6,226 |
| /16 | 65,536 | $18–28 | $1,179,648–1,835,008 | $0.30–0.35 | $19,661–22,938 |
IPv4 Price History: 2011–2026
When IANA exhausted its free pool in February 2011, the concept of an IPv4 market barely existed — early trades closed at $7–$10 per IP. Prices climbed steadily through the 2010s, peaking in the $55–$60 range during the 2021–2022 frenzy driven by pandemic-era cloud expansion and speculative accumulation. The introduction of AWS's public IPv4 charge in February 2024 ($0.005/hour, roughly $3.60/month per IP) triggered a structural repricing by encouraging organizations to release unused Elastic IPs, adding supply to the market and compressing transfer prices. The current $33.09 average represents a normalization — roughly halfway between the 2019 pre-COVID floor and the 2022 peak — with a bifurcation emerging between premium ARIN/RIPE space and discount APNIC/LACNIC blocks.| Year | ~Price/IP | Key Event |
|---|---|---|
| 2011 | $7–12 | IANA free pool exhausted; Microsoft/Nortel deal ($11.25/IP) |
| 2012 | $8–12 | RIPE NCC reaches last /8; begins /22-only allocation |
| 2014 | $10–15 | LACNIC free pool exhausted |
| 2015 | $8–15 | ARIN free pool exhausted |
| 2017–18 | $12–18 | Leasing market grows; cloud demand rises |
| 2019 | $18–24 | RIPE NCC exhausts remaining free pool |
| 2021–22 | $50–60+ | Post-pandemic peak; hyperscaler build-outs |
| 2024 | $35–52 | AWS IPv4 charge ($0.005/IP/hr); large block correction |
| 2025–26 | $18–45 | Market bifurcation; /16s below $20 for first time since 2019 |
Market Structure: Who Is Buying & Selling
The buy side in 2024 was dominated by mid-tier cloud providers, regional ISPs expanding fixed-wireless and fiber footprints, and hosting companies scaling out infrastructure. AI-focused data center operators emerged as a new buyer category, though their volume remains difficult to isolate from general hosting demand. On the sell side, legacy corporate holders — universities, government agencies, and companies that received large allocations in the 1990s — continue to be the primary source of supply, supplemented by bankruptcy estates and M&A-driven divestitures.IPv4 vs. Other Asset Classes
At a 21.2% implied annual yield from leasing, IPv4 addresses outperform virtually every conventional asset class. U.S. 10-year Treasuries yielded roughly 4.3% at year-end 2024; commercial real estate cap rates averaged 6–8% depending on sector; the S&P 500 returned approximately 24% in 2024, but with vastly higher volatility. IPv4's yield comes with near-zero carrying costs (no property tax, no maintenance), minimal correlation to equity markets, and a demand profile underpinned by the fundamental architecture of the internet. The primary risk is value erosion from IPv6 adoption, but that transition has been moving at glacial speed for two decades.| Asset Class | Typical Yield | Liquidity | Primary Risk |
|---|---|---|---|
| IPv4 | 21.2% | Moderate | IPv6 adoption, block quality |
| Commercial Real Estate | 5–8% | Low | Vacancy, rate cycle |
| Investment-Grade Bonds | 4–5% | High | Duration, credit risk |
| S&P 500 | ~1,3% | High | Market volatility |
| Money Market / T-Bills | ~4–5% | High | Rate cycle changes |
IPv6 Adoption & Why IPv4 Remains Essential
Google's IPv6 adoption measurements plateaued around 43–45% of global traffic in 2024, and that number has barely moved in three years. Enterprise adoption trails consumer metrics significantly — most B2B applications, legacy systems, and carrier-grade NAT deployments remain IPv4-dependent. The coexistence period has already lasted 12 years and will extend for at least another decade, making IPv4 a depreciating but extremely slow-depreciating asset with strong near-term cash flow characteristics.AI & Cloud Infrastructure Demand
Every GPU cluster needs IP addresses for management planes, API endpoints, and data ingestion pipelines. The rapid expansion of AI training and inference infrastructure in 2024 — particularly by hyperscalers and well-funded AI startups building out private data centers — added a new source of demand that did not exist at scale three years ago. While individual AI deployments don't consume massive IP ranges, the aggregate buildout across hundreds of facilities is tightening supply for /22 through /20 blocks in ARIN and RIPE territory.What Determines IPv4 Block Value
Three factors drive the premium or discount on any given block: cleanliness (blacklist/spam history), RIR of registration (ARIN commands +$3–4/IP over APNIC), and block age — older allocations from the Class A/B era are perceived as more stable and less likely to carry routing baggage. Transferability matters too: AFRINIC blocks are effectively untradeable due to governance paralysis, while LACNIC's thin market means buyers face liquidity risk on resale. A clean /22 in ARIN with no blacklist hits and clear chain-of-custody documentation will fetch 20–30% above the market average.Sell vs. Lease: A Decision Framework
With the market down 12.2% year-over-year, holders who believe prices will stabilize (as our model suggests) should lean toward leasing — the 21.2% annual yield is simply too attractive to give up unless you need immediate liquidity. Selling makes sense if the block has compliance issues, if the holder lacks the infrastructure to manage lease relationships, or if the address space sits in a low-demand region (LACNIC, AFRINIC). The optimal strategy for large holders is a hybrid: lease the majority, sell individual /24s at premium per-IP pricing to capture the small-block premium.| /24 Purchase price | $8,471 |
| /24 Lease price | $150 / mo |
| Payback period | 56.5 mo (4.7 yr) |
| Gross annual yield | 21.2% |
RIPE NCC 24-Month Transfer Restriction
RIPE NCC's 24-month holding period — requiring that transferred blocks cannot be re-transferred for two years — acts as a supply lock that reduces secondary market velocity within the European registry. This rule directly supports pricing by preventing rapid speculative flipping, but it also creates a two-tier market where "seasoned" RIPE blocks (past the holding period) trade at a slight premium to recently transferred ones. Buyers planning for near-term resale should factor this holding cost into their acquisition models.Deal Size Distribution
The 2024 deal distribution skewed heavily small: 571 transactions (75.9%) fell under $50,000, accounting for just $9.8 million in total value. The mid-market ($50K–$250K) represented 123 deals worth $12.5 million, while 46 transactions in the $250K–$1M range generated $16.3 million. The 12 largest deals (over $1 million each) contributed $21.7 million — 35.8% of total market value from just 1.6% of transactions. This extreme concentration at the top is typical of asset markets and means a handful of large trades exert outsized influence on average pricing metrics.Top Trading Countries
RIR-level data serves as the best available geographic proxy for 2024. RIPE's 63.5% share of transfer registrations points to strong activity across Western Europe — Germany, the Netherlands, and the UK are traditionally the most active markets within that region. ARIN's 36.5% transfer share reflects steady U.S. demand driven by ISPs, hosting providers, and the early BEAD-related address accumulation by rural broadband operators.BEAD Broadband Program Impact
The $42.45 billion BEAD program is the single largest potential demand shock on the horizon. As states finalize subgrantee awards through 2025–2026, hundreds of small and mid-size ISPs will need IPv4 space to provision new subscribers on fixed-wireless and fiber networks. These operators typically need /20 through /18 blocks — exactly the mid-range supply that has tightened most over the past two years. We expect BEAD-driven demand to put measurable upward pressure on ARIN-region pricing starting in late 2025.Hyperscaler IPv4 Holdings
Amazon, Microsoft, and Google collectively hold an estimated 100+ million IPv4 addresses — enough to influence the market through buy or sell decisions. AWS's public IPv4 pricing introduced in 2024 generated an estimated $1–2 billion in annual revenue while prompting customers to release unused addresses, functionally increasing market supply. Any decision by a hyperscaler to divest even a portion of their holdings would depress prices significantly, but so far none have shown willingness to sell — these addresses are strategic infrastructure, not financial assets to them.Macroeconomic Conditions & Market Impact
Central bank rate cuts in late 2024 — the Fed dropped to 4.25–4.50% by December — lowered the opportunity cost of holding IPv4 as a non-yielding asset (though leasing changes that calculus). Enterprise IT budgets expanded modestly in 2024 after the austerity of 2023, which helps explain the 38.5% surge in transaction volume: more organizations had capex available for infrastructure buildout. If rate cuts continue into 2025 as expected, the incremental cost of financing IPv4 purchases drops further, which should support both volume and pricing.Model Update & Calibration
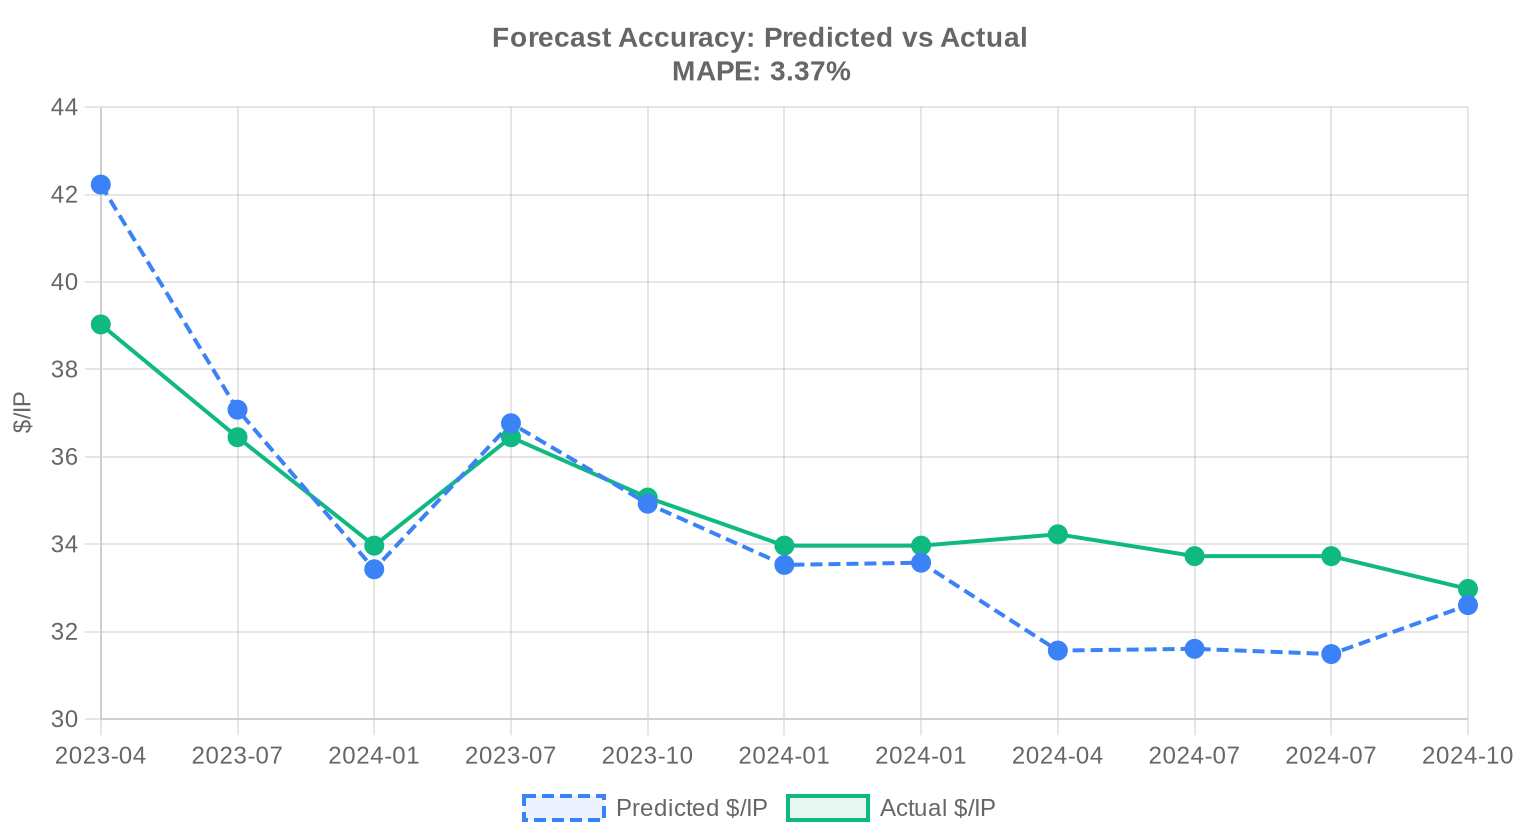
As part of our continuous improvement process, we backtested previous forecasts against realised prices and fine-tuned the model accordingly. Recent months now carry more influence than older data, and the confidence bands have been widened or narrowed based on how well they captured actual outcomes in the past. You can see the full backtest results in the table and chart below.
| Report Period | Target Month | Predicted | Actual | Deviation |
|---|---|---|---|---|
| 2023-H2 | 2024-01 | $34 | $34 | -1% |
| 2023-Q4 | 2024-01 | $34 | $34 | -1% |
| 2024-Q1 | 2024-04 | $32 | $34 | -8% |
| 2024-H1 | 2024-07 | $32 | $34 | -6% |
| 2024-Q2 | 2024-07 | $31 | $34 | -7% |
| 2024-Q3 | 2024-10 | $33 | $33 | -1% |
Methodology
Figures are based on completed IPv4Center marketplace transactions and RIR transfer statistics. Prices are in US dollars per IP address. Forecasts are produced by an AI model that analyses each block-size band and RIR segment separately (with outlier-trimmed medians) alongside known market catalysts; they are estimates, not guarantees.
Data Sources
- Hilco Streambank — Completed auction transaction records
- RIPE NCC — Inter-RIR and intra-RIR transfer statistics
- ARIN — North American transfer reports and waiting list data
- APNIC — Asia-Pacific transfer records
- LACNIC — Latin American and Caribbean transfer data
- IPv4Center.com — Proprietary marketplace transaction and lease pricing data
This report is generated automatically for informational purposes only and does not constitute financial advice.
Frequently Asked Questions
What was the average price per IPv4 address in 2024?
The global weighted average landed at .09 per address across 752 recorded transactions, with a median of . The spread between mean and median suggests a modest right-tail skew driven by premium ARIN blocks.
How much total capital changed hands in the IPv4 transfer market during 2024?
Aggregate transaction value reached approximately .6 million across 1.82 million addresses. Twelve deals alone exceeded million each, accounting for .7 million — roughly 36% of total market value from just 1.6% of transactions.
Why are ARIN blocks priced higher than RIPE or APNIC blocks?
ARIN addresses averaged .29 per IP in 2024, a .95 premium over RIPE (.34) and a .01 premium over APNIC (.28). This reflects stronger demand from North American enterprises, cleaner reputation histories, and more straightforward compliance requirements for U.S.-based buyers. ARIN's median of versus RIPE's confirms the premium is structural, not outlier-driven.
Which RIR region dominated transaction volume in 2024?
RIPE accounted for 41.2% of all priced transactions (310 of 752) and 63.5% of total registered transfers (6,651 of 10,553). The European registry remains the market's most liquid venue by a wide margin.
What was the price range observed across all deals in 2024?
The floor was per IP and the ceiling was .12, recorded in the APNIC region. That .12 spread — nearly a 2x multiple from low to high — underscores the importance of block size, cleanliness, and regional allocation in price discovery.
Is it cheaper to buy or lease IPv4 addresses at current 2024 rates?
At .09 per IP to buy versus .5859 per IP per month to lease, the breakeven horizon is roughly 56.5 months — just under 4.7 years. For any holding period beyond that threshold, outright purchase is the rational choice. The implied annual yield on a purchased-then-leased block is 21.2%, which makes buying and leasing out an attractive capital deployment.
What does the buy-vs-lease math look like for a /24 block specifically?
A /24 costs approximately ,471 to purchase outright. Leasing the same block runs about 0 per month, or ,800 annually. Breakeven arrives at roughly 56 months. If you need the space for five-plus years, buying is cheaper and builds an appreciating asset on your balance sheet.
What mistakes do first-time IPv4 buyers most commonly make?
Three recurring errors: paying ARIN-region prices for APNIC or LACNIC blocks (the discount should be 10–15%), neglecting to check blacklist and abuse-history status before closing, and underestimating transfer timelines — ARIN and RIPE transfers can take 4–8 weeks depending on documentation readiness. Overpaying by even per IP on a /16 is a 6,000 mistake.
What are the risks of buying IPv4 addresses in the current market environment?
The principal risk is long-term demand erosion from IPv6 adoption, though that transition continues to move at glacial speed. Nearer-term risks include regulatory changes at individual RIRs that could restrict transfers, and the possibility of paying peak prices if the market trend reverses. The 2024 average of .09 sits near all-time highs, so buyers should size positions carefully.
What are the risks of leasing rather than purchasing IPv4 space?
Leasing exposes tenants to annual rate escalation — at the current .59/IP/month, costs compound to .03 per IP annually with no equity accrual. If lease rates rise even modestly, the breakeven versus buying shortens further. Lessees also face counterparty risk: if the lessor's block is reclaimed or blacklisted, the operational disruption falls on the tenant.
How did /24 blocks perform as a segment in 2024?
The /24 was the most frequently traded prefix size, with 288 transactions — 38.3% of all deals. This reflects the /24 as the minimum globally routable prefix and the default entry point for smaller enterprises, hosting providers, and anti-abuse operations needing clean address space.
Were there any transactions in the AFRINIC region during 2024?
Zero. AFRINIC recorded no priced transactions and no registered transfers in our dataset. Ongoing governance instability and transfer-policy restrictions continue to render the African registry effectively illiquid for secondary-market purposes.
How active was LACNIC's transfer market in 2024?
Barely. Only 17 transactions were recorded in the LACNIC region, totaling roughly 30,208 addresses and 0,000 in value. The average price of .91 per IP was the lowest of any active RIR, reflecting thinner demand and less mature transfer infrastructure in Latin America.
What was the average deal size in 2024, and what does it signal?
The average transaction moved approximately 80,622 addresses — roughly a /15 equivalent. That's a substantial block size, suggesting institutional and infrastructure-scale buyers (cloud providers, telecoms, large hosting operations) remain the primary market participants rather than small enterprises.
How was the market distributed by deal value?
The long tail dominated by count: 571 transactions (76%) were under ,000, typical of /24 and small /23 trades. But the 12 deals exceeding million represented .7 million — 35.8% of total market value. This is a market with a retail body and an institutional head.
What is the 2025 year-end price forecast, and how confident should we be?
Our model projects .67 per IP by December 2025, implying modest 1.8% appreciation from the 2024 average of .09. The forecast is flagged as reliable, with near-term trajectory pointing to .59 as a next-period waypoint. The trend is gently up, consistent with slow supply depletion and sticky demand.
Is IPv6 adoption finally going to collapse IPv4 prices?
Not in any investable timeframe. Despite two decades of deployment, IPv6 has not meaningfully reduced enterprise demand for IPv4 space. The 2024 data shows a market that transacted .6 million at rising prices — hardly the profile of a distressed asset class. IPv6 is the long-run answer; IPv4 remains the medium-term reality.
What does the 21.2% implied annual yield mean for IPv4 as an asset class?
At a purchase price of .09 and lease income of .03 per IP per year, the gross yield is 21.2% — substantially above risk-free rates and most commercial real estate cap rates. Even after accounting for brokerage fees, transfer costs, and vacancy risk, the net yield remains compelling for capital allocators comfortable with the asset's illiquidity and regulatory tail risk.
How many total transfers — including non-priced transfers — occurred across all RIRs in 2024?
We recorded 10,553 total transfers, of which 752 had publicly reportable pricing. RIPE dominated with 6,651 transfers (63.5% share), followed by ARIN at 3,902 (36.5%). The gap between total transfers and priced transactions reflects intra-company reorganizations, mergers, and private deals that never surface in broker channels.
What should a buyer expect to pay for a clean /24 in the RIPE region today?
Based on 2024 data, a RIPE /24 should transact in the per IP range — roughly ,192 for the block. Premium blocks with pristine reputation and immediate availability may command the upper end toward per IP (,752), while blocks requiring remediation trade at discounts.
Why is there no AFRINIC activity, and should buyers avoid that region entirely?
AFRINIC has been mired in governance disputes and legal proceedings that have effectively frozen its transfer framework. Zero transactions in 2024 speaks for itself. Until the registry stabilizes its leadership and policy apparatus, we would advise institutional buyers to steer clear — the operational and legal uncertainty is not worth the potential discount.
How long does a typical IPv4 transfer take to complete?
Timeline varies by RIR. RIPE transfers generally close in 2–4 weeks given their streamlined process, which partly explains RIPE's dominance (310 transactions). ARIN transfers typically require 4–8 weeks due to needs-based justification requirements. APNIC falls somewhere in between. Buyers should budget at least 6 weeks for planning purposes.
What drove the 0.43% price increase observed in 2024?
The trend is up but tepid. A 0.43% gain suggests a market in equilibrium — supply depletion puts a floor under prices, but demand growth is restrained by incremental IPv6 adoption and more efficient address utilization (CGNAT, etc.). This is a mature market grinding higher, not a momentum trade.
Are mid-size deals (K–0K) a sweet spot for buyers?
Arguably yes. The 123 transactions in the K–0K band generated .5 million in aggregate value and represent the segment where institutional-quality blocks (/20 to /17 range) trade with reasonable liquidity. Below K, block sizes are too small for infrastructure-scale deployments; above M, the buyer pool thins dramatically and negotiation leverage shifts.
What happens to IPv4 prices if a major cloud provider dumps a large block onto the market?
A sudden large-block liquidation — say a /12 or larger — would temporarily depress prices, particularly in the relevant RIR. But the 2024 data shows 1.82 million IPs traded across the entire year; a single mega-block would be absorbed over quarters, not years. The market has enough structural demand from telecoms, hosting, and enterprise to digest supply shocks, albeit at temporarily lower clearing prices.