16 min read
This report analyzes the IPv4 transfer market for Second Half 2024, based on completed IPv4Center marketplace transactions and official RIR transfer records.
Executive Summary
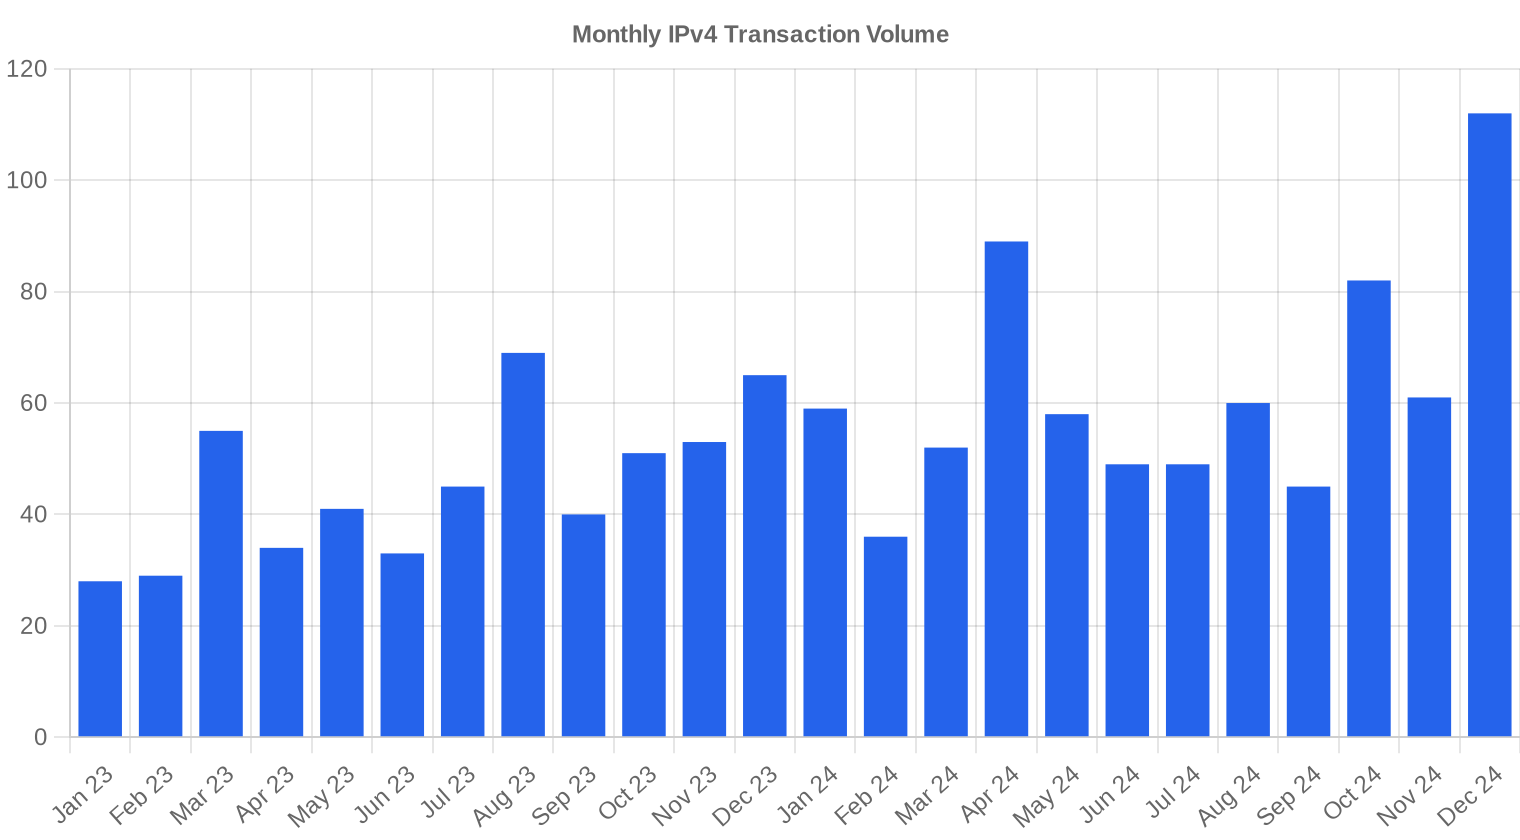
The second half of 2024 saw 409 transactions move 1,176,832 IPv4 addresses for a combined $38.8 million, placing the market-wide average at $32.99 per IP. That average is down $0.70 from H1 2024 and off 6.7% from H2 2023, when prices sat closer to $35.36. Transaction volume, however, jumped 19.2% versus the first half — a clear signal that buyers are absorbing more inventory at lower price points. The median held at $32, tight against the mean, which tells us the distribution is relatively clean with no outsized outliers pulling the tape. The broad trend is a market that has been repricing lower in an orderly fashion, with volume confirming that participants aren't sitting on their hands — they're leaning in at these levels.Market Overview
| Transactions | 409 |
| IP Addresses Traded | 1,176,832 |
| Estimated Market Value | $38,814,913 |
| Average Price / IP | $32.99 |
| Median Price / IP | $32.00 |
| RIR Transfers | 5,382 |
Year-over-Year Comparison
| Metric | This period | A year earlier (H2 2023) | Change |
|---|---|---|---|
| Transactions | 409 | 323 | +26.6% |
| IP Addresses Traded | 1,176,832 | 882,176 | +33.4% |
| Estimated Market Value | $38,814,913 | $33,578,734 | +15.6% |
| Average Price / IP | $32.99 | $35.37 | -6.7% |
| RIR Transfers | 5,382 | 4,907 | +9.7% |
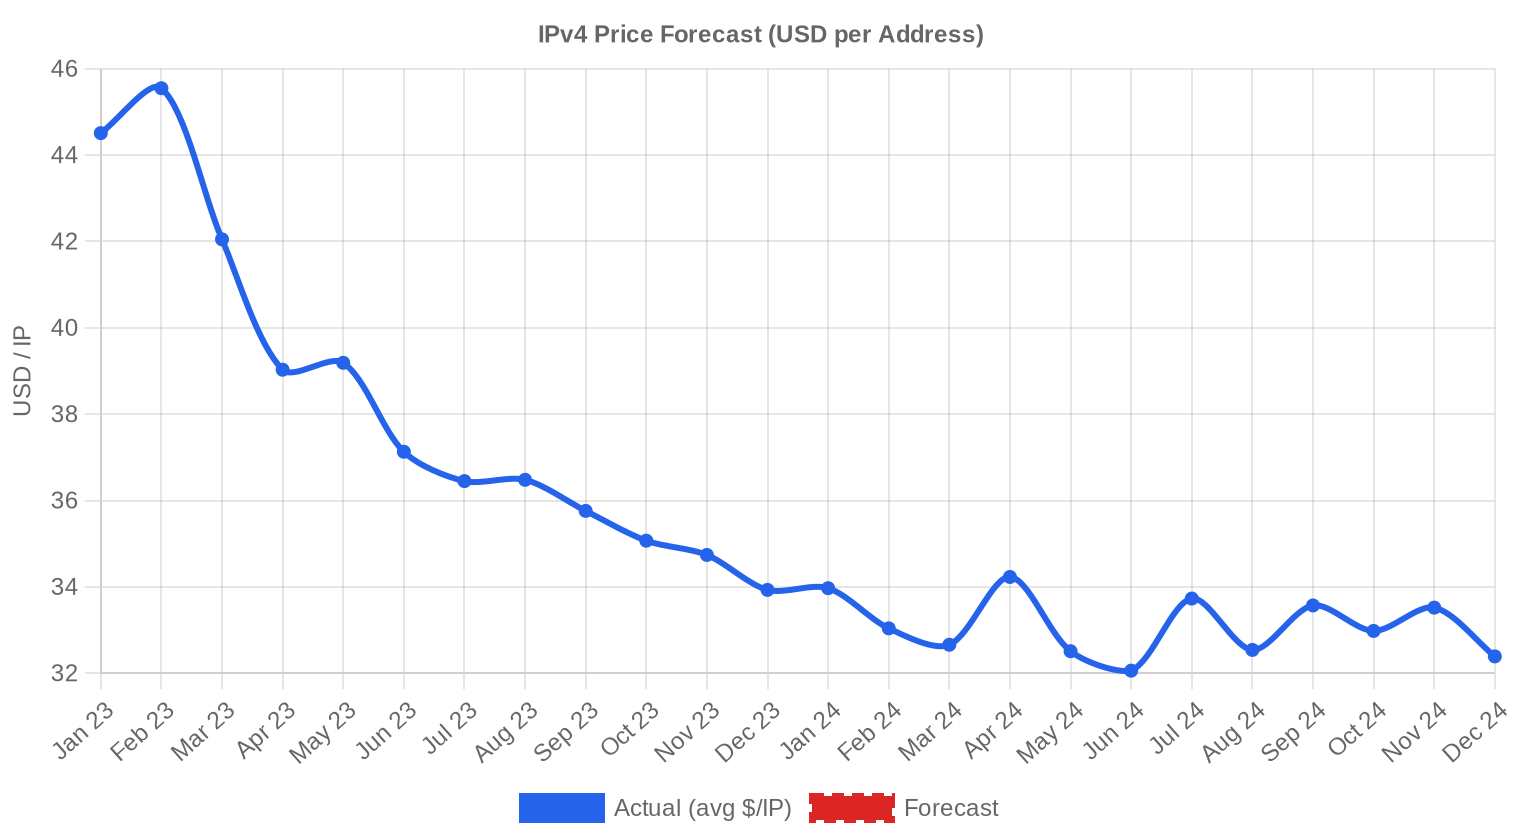
Price Dynamics
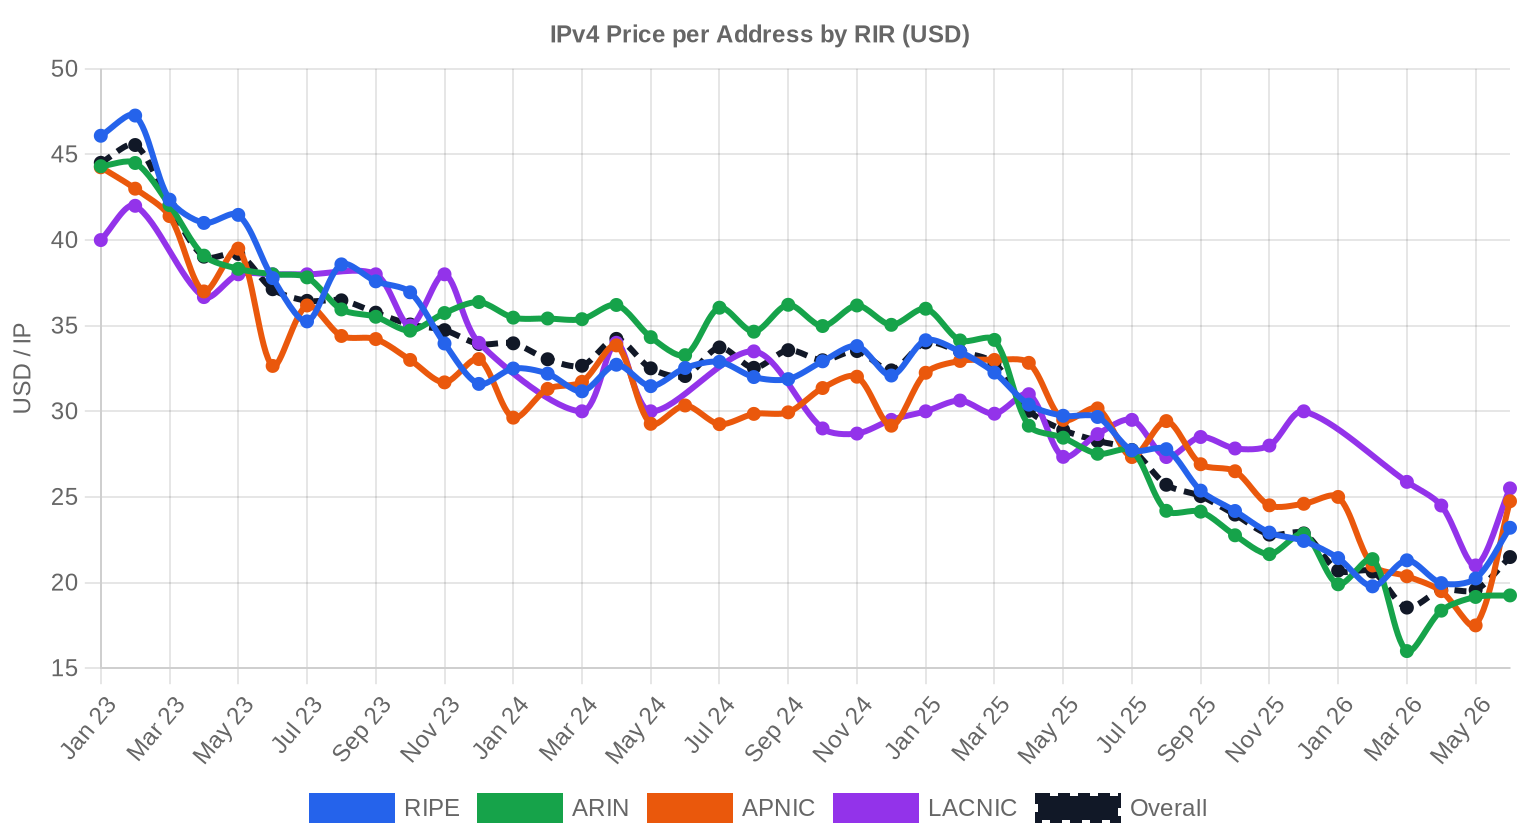
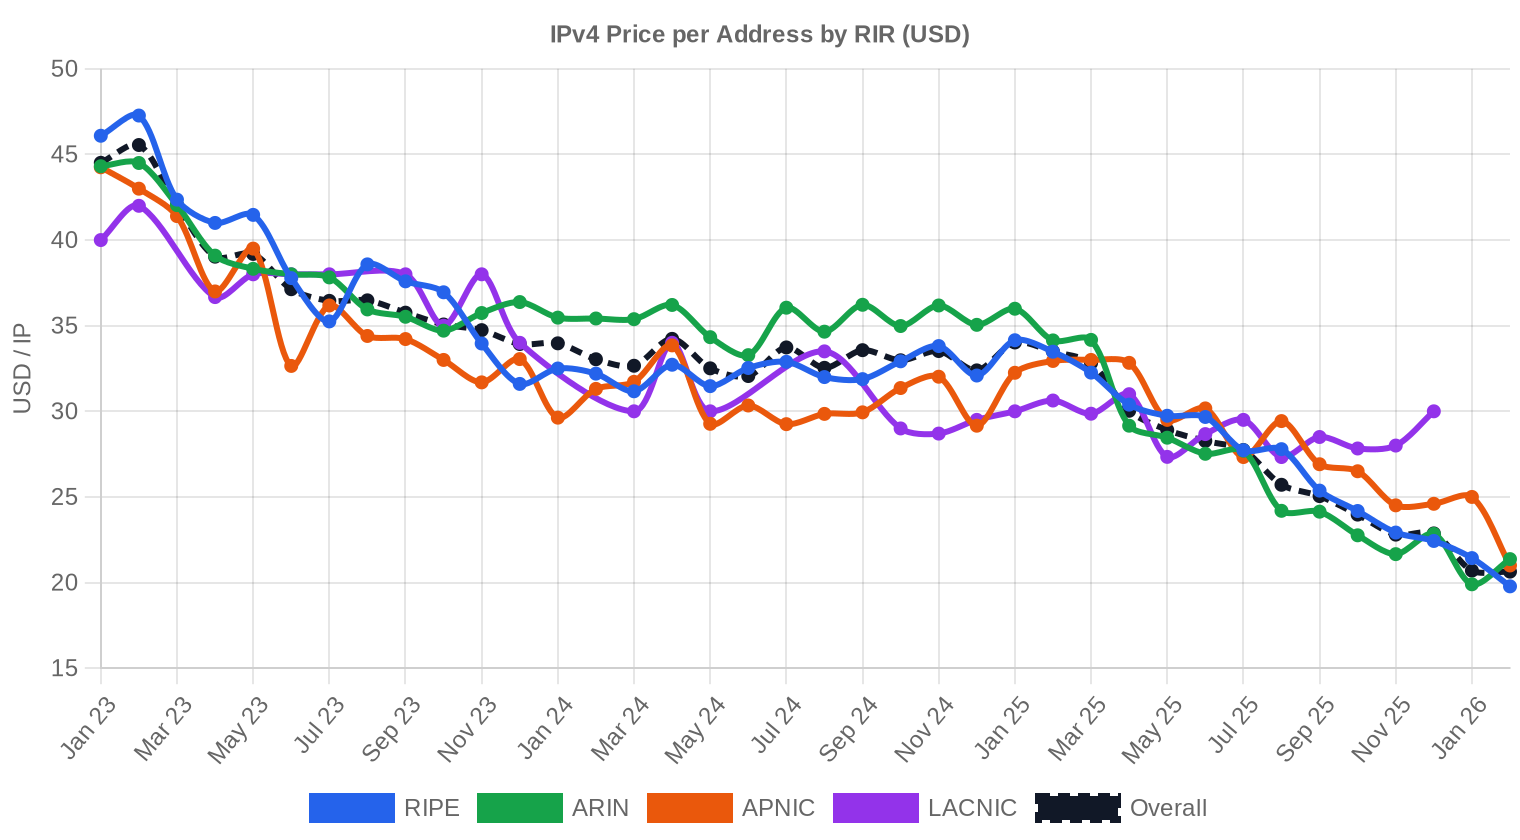
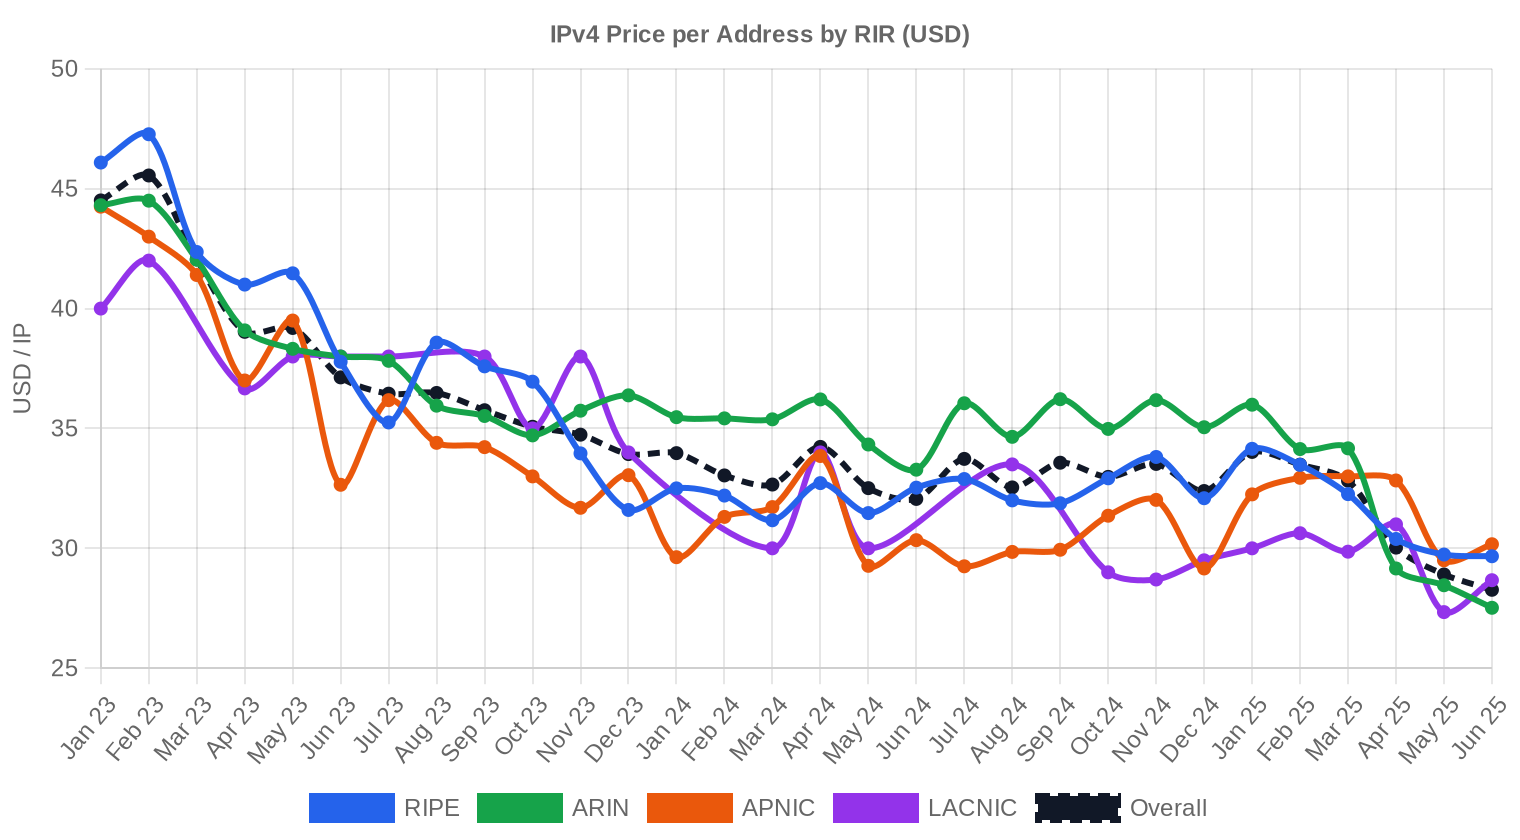
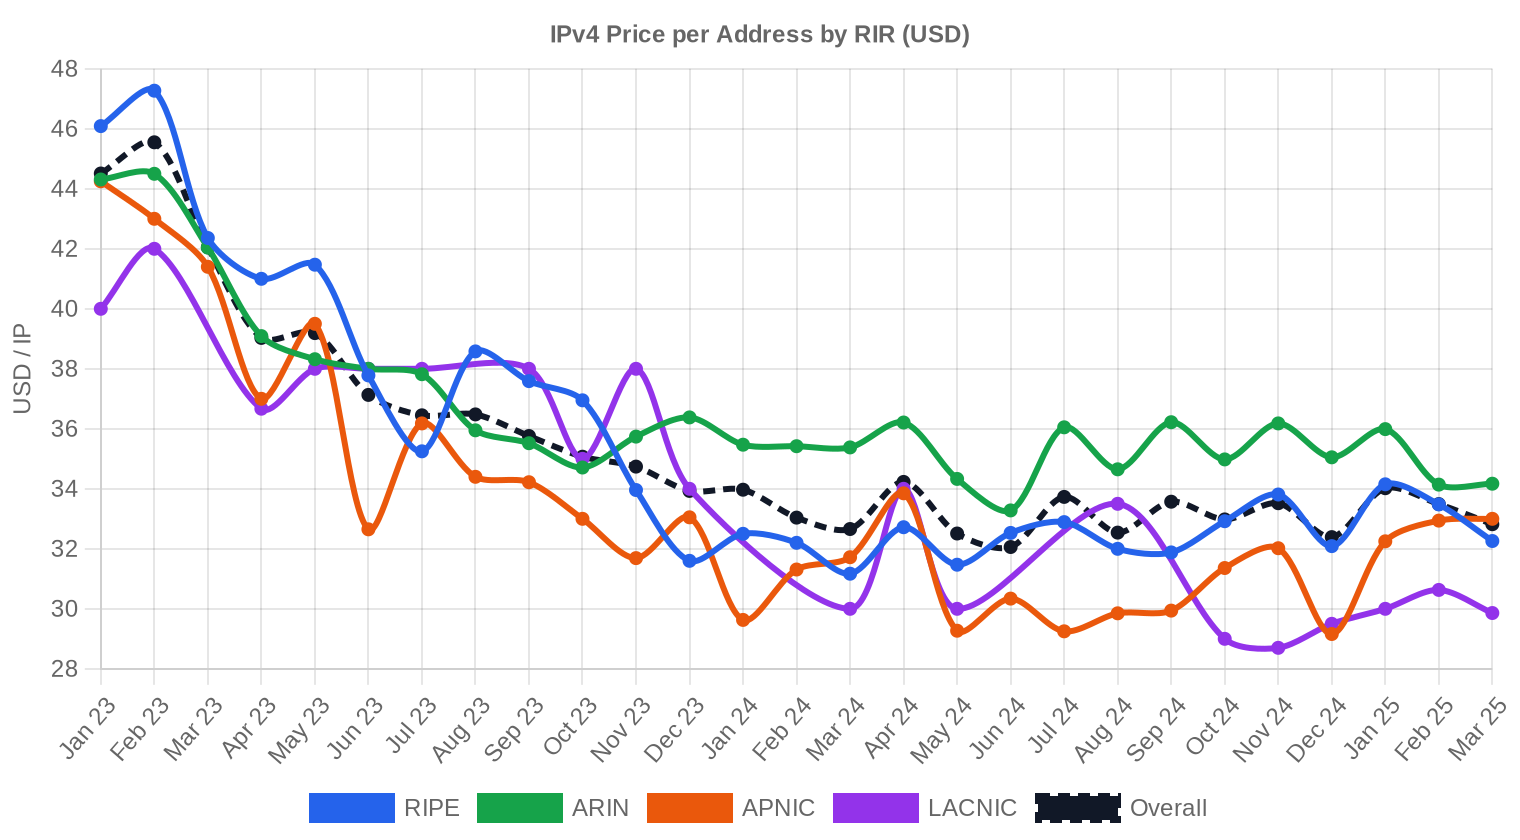
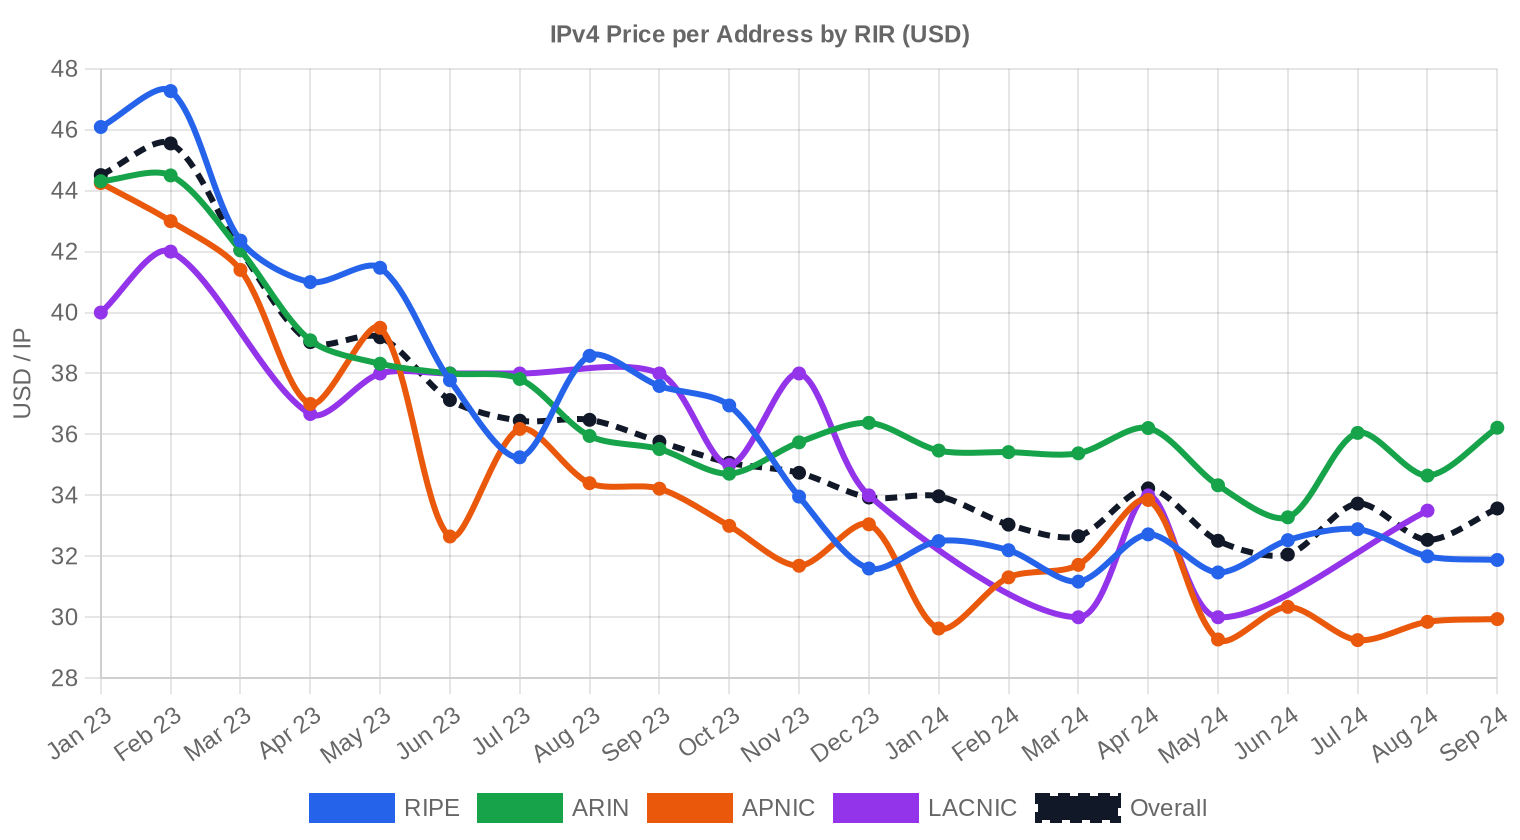
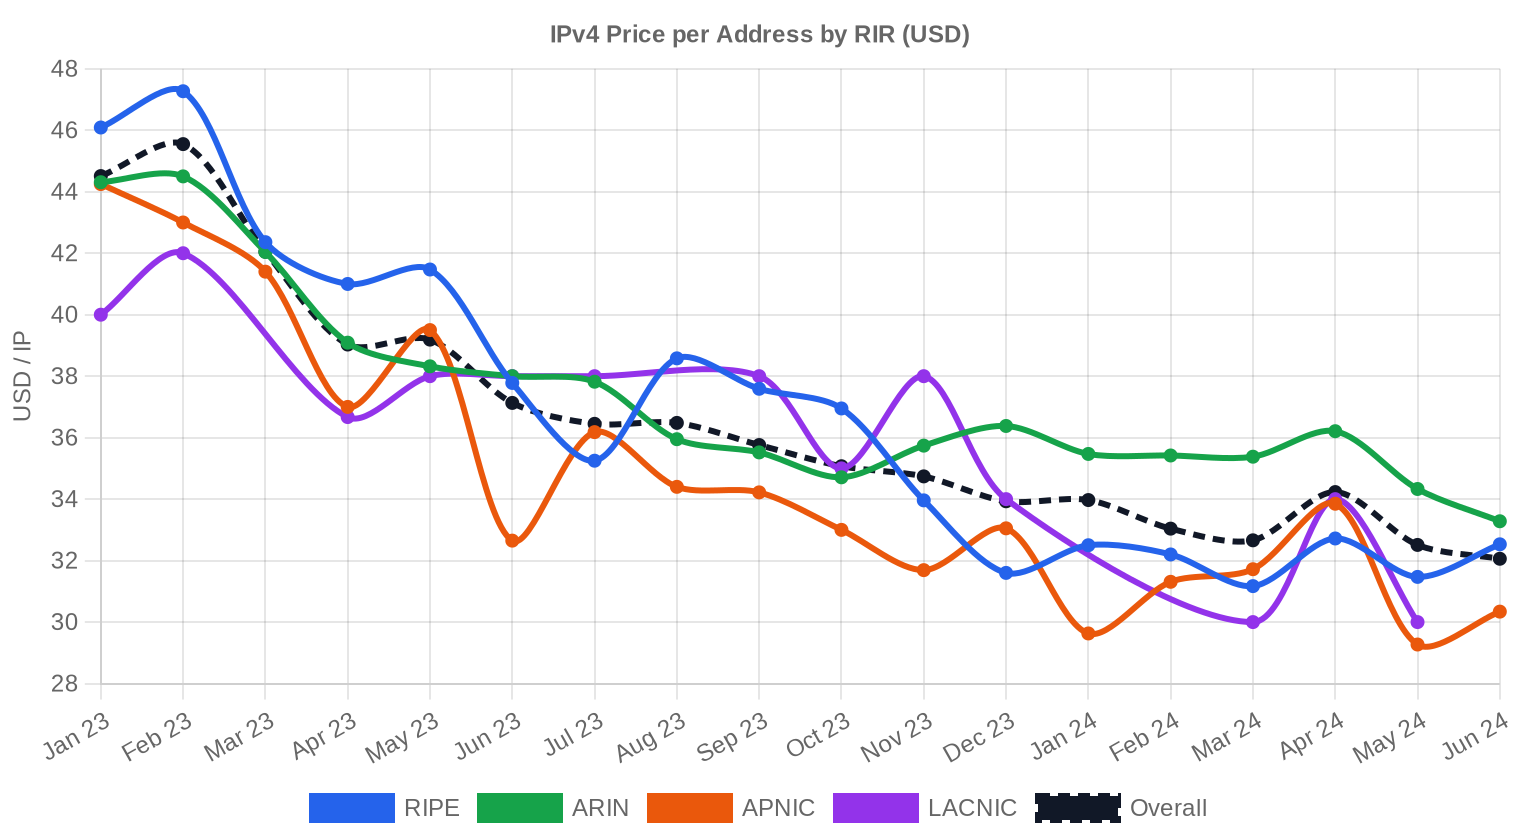
The full price range spanned $26 to $45 per IP, a $19 spread that reflects the persistent gap between ARIN premium blocks and smaller APNIC/LACNIC lots at the bottom end. The regression trend ticked up 1.97% within the half, suggesting prices found a floor mid-period and edged higher into year-end. Against H1 2024, the average slipped $0.70 — modest enough to call it stabilization rather than deterioration. Year-over-year, the 6.7% decline represents the continued unwind from 2023's elevated pricing, driven partly by AWS's IPv4 charge announcement shaking loose supply and partly by softening demand from European ISPs who front-loaded purchases in prior periods. The min-to-max gap widened slightly versus H1, with ARIN's ceiling at $45 looking increasingly like a niche premium rather than a market indicator.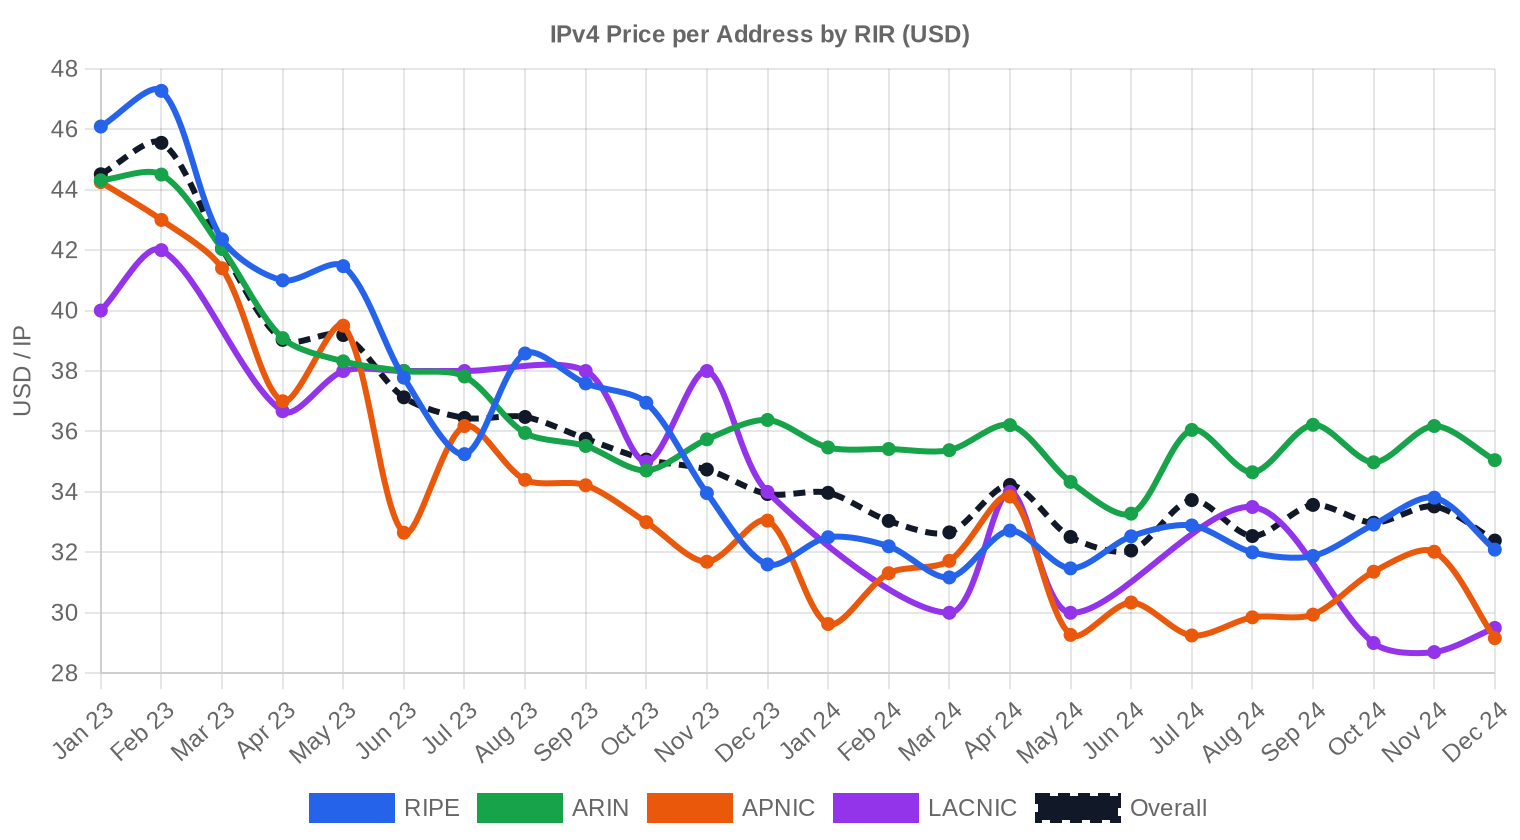
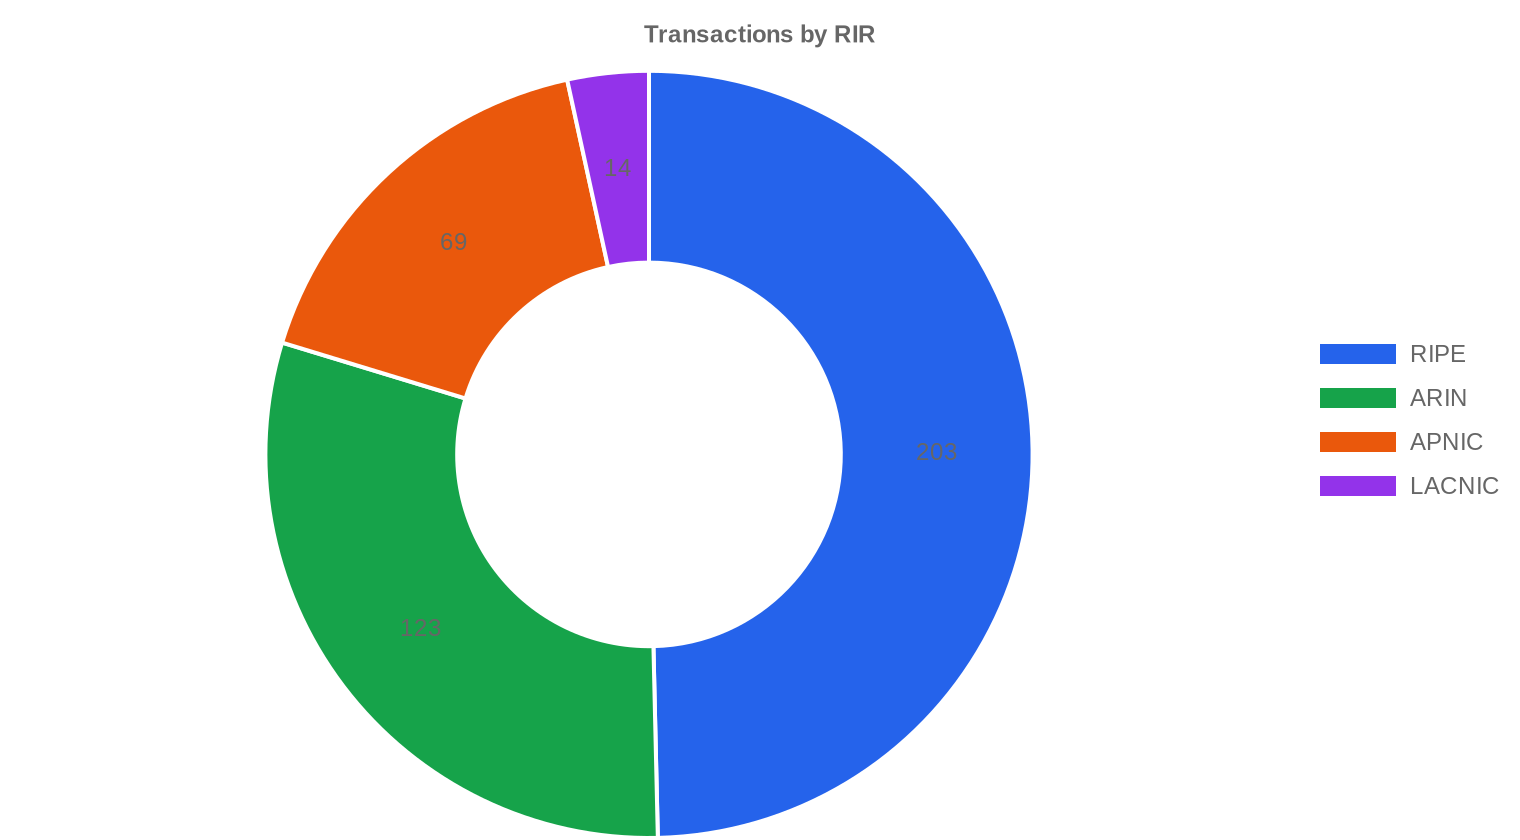
Pricing by RIR
ARIN commanded the highest prices at $35.50 average, a $3.05 premium over the RIPE mean of $32.45 and $4.73 above APNIC's $30.77. That ARIN premium — roughly 9.4% over RIPE — reflects tighter transferable supply in North America and the absence of a holding period rule equivalent to RIPE's 24-month lock. RIPE dominated volume with 49.6% of all transactions, consistent with its role as the market's most liquid registry. APNIC's average of $30.77 across 69 deals shows Asia-Pacific buyers continue to find relative value, though the max of $35 suggests clean blocks still command decent prices there. LACNIC remains a marginal contributor at 14 deals and $29.61 average — thin enough that individual transactions can move the mean.RIPE NCC: $32.45 per IP across 203 transactions (49.6% of volume).
ARIN: $35.50 per IP across 123 transactions (30.1% of volume).
APNIC: $30.77 per IP across 69 transactions (16.9% of volume).
LACNIC: $29.61 per IP across 14 transactions (3.4% of volume).
AFRINIC: No recorded transactions.
| RIR | Transactions | Avg $/IP | Median $/IP | IPs Traded | RIR Transfers | Next Month (proj.) | Year-End (proj.) |
|---|---|---|---|---|---|---|---|
| RIPE | 203 | $32.45 | $32.00 | 573,952 | 3,268 | $32.00 | $32.50 |
| ARIN | 123 | $35.50 | $35.00 | 418,816 | 2,114 | $34.50 | $35.00 |
| APNIC | 69 | $30.77 | $31.00 | 165,120 | 0 | $29.50 | $30.00 |
| LACNIC | 14 | $29.61 | $28.50 | 18,944 | 0 | $28.50 | $28.00 |
Transaction Volume
Supply & Block Sizes
The /24 block remained the most traded prefix size with 151 transactions — 36.9% of all deals. This is structural: /24 is the smallest independently routable block on the global table, making it the entry-level purchase for small ISPs, SaaS companies, and enterprises needing a discrete allocation without committing six figures. Larger blocks (/20 and above) accounted for the bulk of dollar volume, with 10 deals exceeding $1 million generating $19.5 million — half the period's total value from just 2.4% of transactions.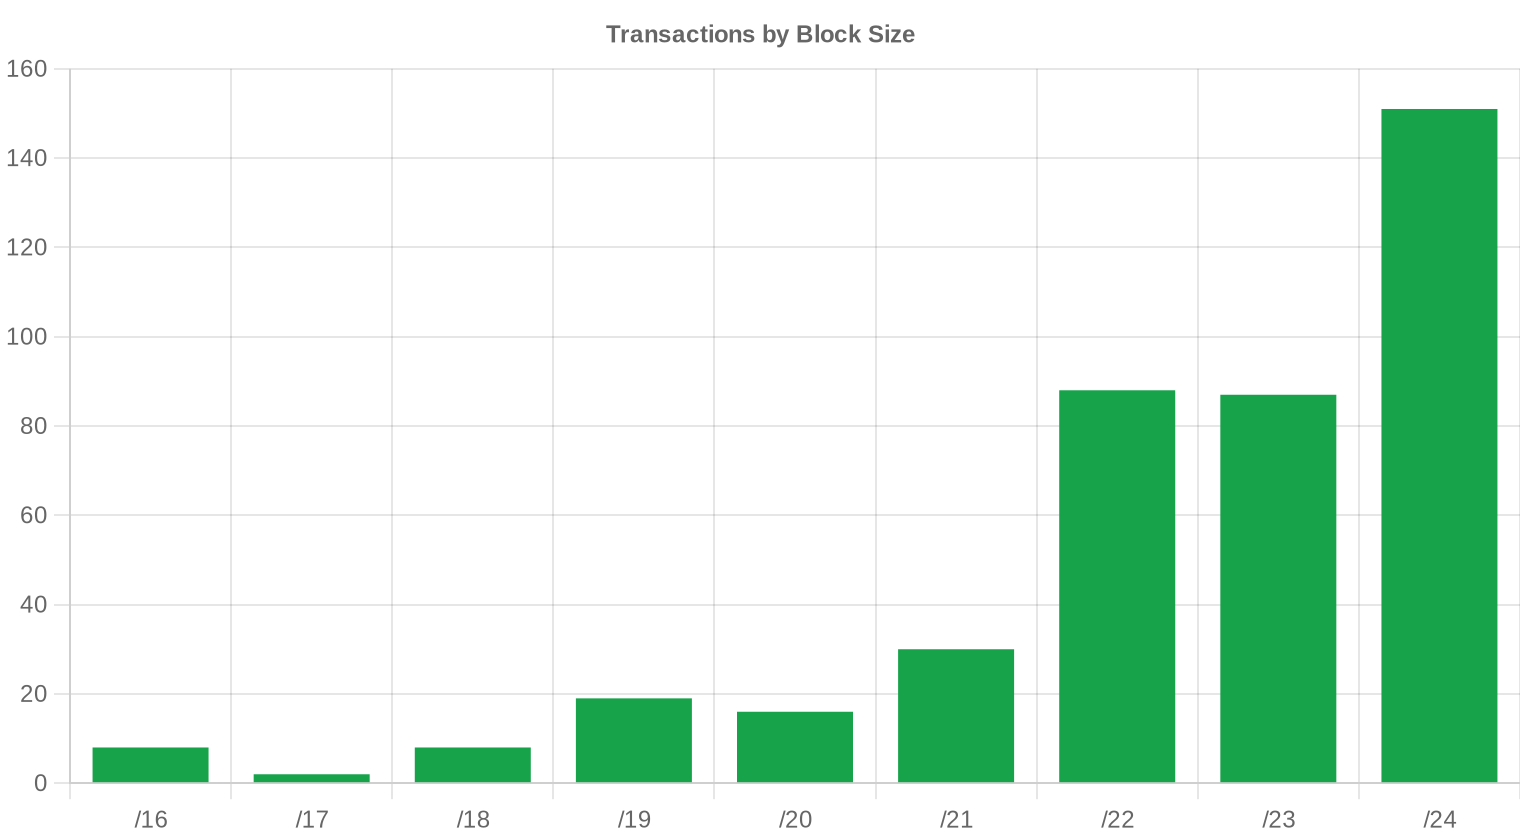
Geographic Activity
Country-level detail is limited in this period's dataset, but the RIR distribution serves as a proxy. RIPE's 49.6% share points to sustained European demand, likely driven by Eastern European ISPs and Western European cloud infrastructure buildout. ARIN's 30.1% reflects steady North American acquisition, while APNIC's 16.9% share is consistent with continued growth across Southeast Asian and Oceanian networks.Registry Transfer Activity
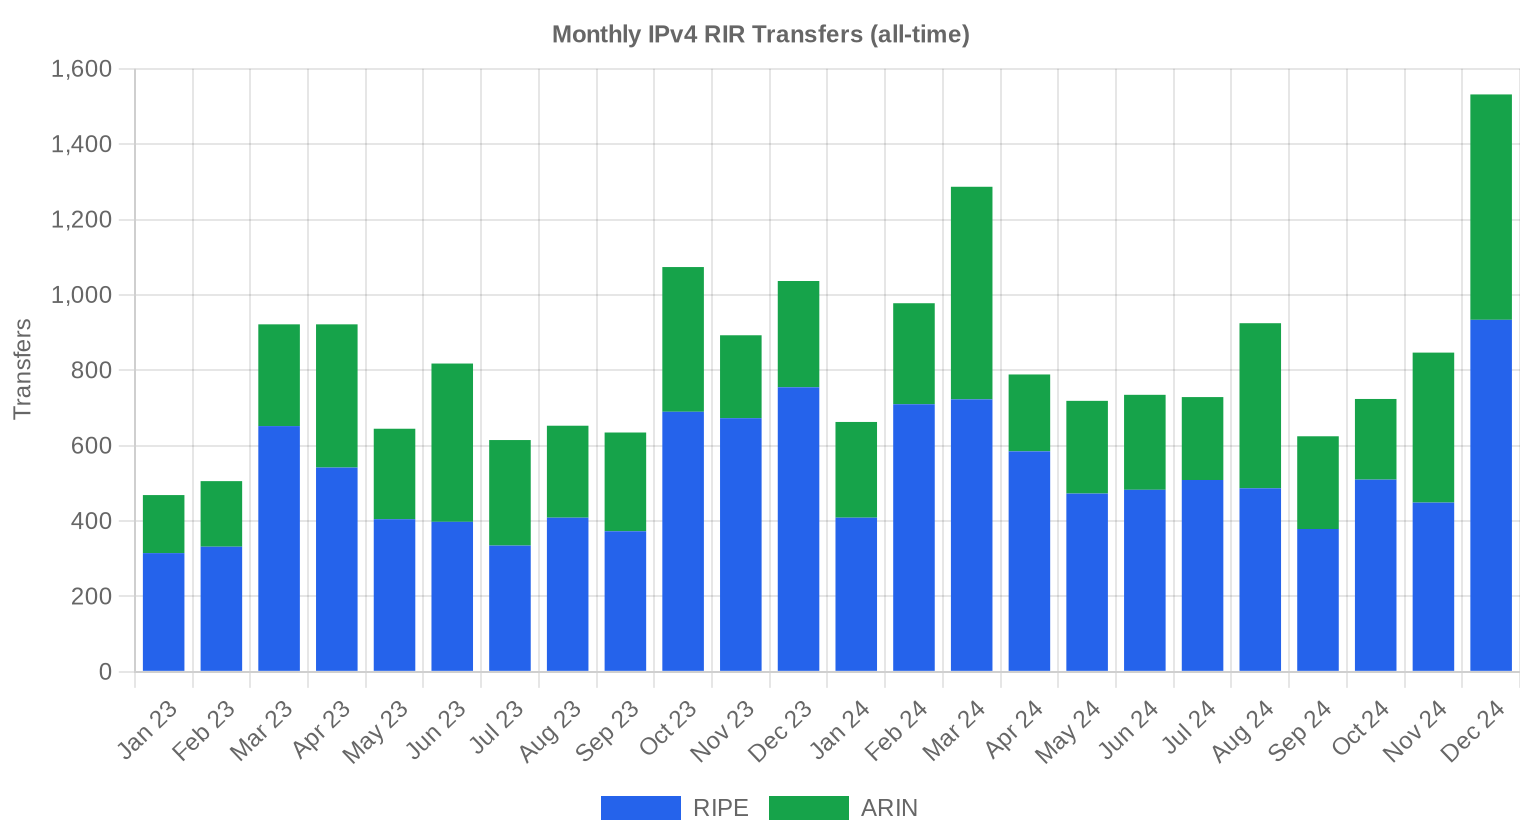
Official RIR transfer registries logged 5,382 transfers in H2 2024, a figure that exceeds transaction count because it includes intra-organizational moves and partial block splits. RIPE led with 3,268 transfers (60.7%), followed by ARIN at 2,114 (39.3%). APNIC, LACNIC, and AFRINIC recorded zero official transfers in the period, a data artifact that likely reflects reporting lag rather than actual inactivity.Long-Run Transfer Trends
Over the trailing 24-month window, the market has processed 19,742 cumulative RIR-recorded transfers. The peak month was December 2024, consistent with the typical year-end pattern where buyers rush to close before budget cycles reset and sellers push inventory to capture fiscal-year revenue. RIPE's 63.5% share of the 24-month total versus ARIN's 36.5% reinforces Europe's position as the market's deepest liquidity pool.| RIR | RIR Transfers |
|---|---|
| RIPE | 12,530 |
| ARIN | 7,212 |
| RIR Transfers | 19,742 |
Outlook & Forecast
Forecasting each block-size band and RIR separately with our AI model:
The overall average price per IP is projected to reach $32.63 by December 2024, with a next-month estimate of $32.72 per IP.
- RIPE: projected at $32.00 per IP next month, trending toward $32.50 by December 2024.
- ARIN: projected at $34.50 per IP next month, trending toward $35.00 by December 2024.
- APNIC: projected at $29.50 per IP next month, trending toward $30.00 by December 2024.
- LACNIC: projected at $28.50 per IP next month, trending toward $28.00 by December 2024.
- AFRINIC: insufficient data for a reliable forecast.
Forecast by Block Size
| Block | Current $/IP | Next Month | Year-End | Confidence |
|---|---|---|---|---|
| /24 | $32.00 | $33.50 (+4.7%) | $33.00 (+3.1%) | medium |
| /23 | $32.00 | $32.00 (0.0%) | $32.00 (0.0%) | medium |
| /22 | $32.00 | $32.00 (0.0%) | $32.00 (0.0%) | medium |
| /21 | $32.00 | $32.00 (0.0%) | $32.50 (+1.6%) | medium |
| /20 | $33.00 | $33.00 (0.0%) | $34.00 (+3.0%) | low |
| /19 | $35.00 | $34.50 (-1.4%) | $35.00 (0.0%) | low |
| /18-/16 | $31.00 | $32.00 (+3.2%) | $32.00 (+3.2%) | low |
| /15-up | $51.50 | $33.00 (-35.9%) | $33.00 (-35.9%) | low |
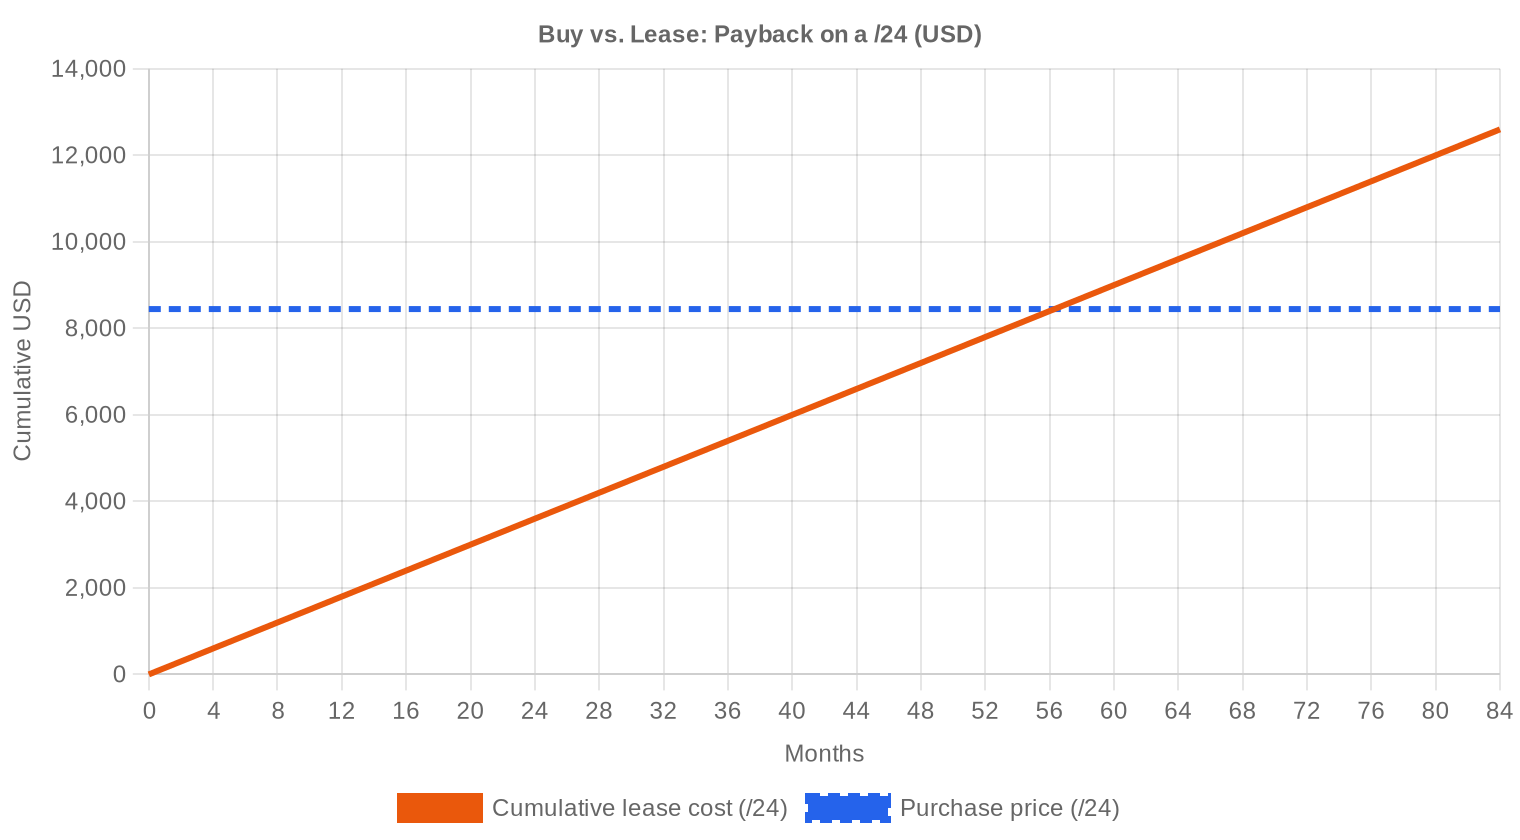
Editor's Take: Buy vs. Lease
At current pricing, the buy-versus-lease math clearly favors purchasing. A /24 block costs approximately $8,445 to buy outright. Leasing the same block runs $150 per month, or $1,800 per year. The crossover point — where cumulative lease payments exceed the purchase price — sits at 56.3 months, roughly 4.7 years. Any organization expecting to need addresses for five years or longer is burning money on leases. The implied annual yield for a block owner leasing out their inventory is 21.3%, a return that makes most fixed-income instruments look anemic. For buyers with balance sheet capacity, this remains one of the clearest buy signals in the IPv4 market's history.| /24 Purchase price | $8,445 |
| /24 Lease price | $150 / mo |
| Payback period | 56.3 mo (4.7 yr) |
| Gross annual yield | 21.3% |
What This Means for You
For buyers: H2 2024 pricing represents the most attractive entry point since mid-2021. The 6.7% year-over-year decline gives you room to negotiate, and volume is up — meaning inventory is available. If you need addresses beyond a 5-year horizon, buy now rather than lease. RIPE blocks offer the best value at $32.45 average if your use case permits European-registry resources.For sellers: The market is liquid but the direction is not your friend. Prices are trending lower and supply is loosening. If you're holding blocks acquired before 2020, your cost basis is likely well below current levels — take profits while the bid side remains active. Waiting for a return to 2023 pricing looks increasingly unrealistic.
For leasers: At $0.59 per IP per month, leasing makes sense only for short-term projects or bridge scenarios where you need addresses for under four years. Beyond that threshold, you're overpaying relative to ownership. Negotiate annual lease terms to lock in current rates before any potential floor in pricing shifts lessor expectations.
For block holders: The 21.3% annual yield on leased-out blocks is exceptional by any asset-class standard. If you're not actively using your allocations, leasing generates meaningful passive income while you retain the underlying asset. Consider partial monetization — lease a portion, hold the rest for potential appreciation or future operational needs.
Browse verified IPv4 blocksSell IPv4 →
List your blocks with managed transferLease IPv4 →
Flexible short-term capacityLease Out IPv4 →
Turn idle blocks into recurring revenue
IPv4 Pricing by Block Size
Per-IP pricing varies dramatically by block size. A single /24 (256 IPs) trades at a meaningful premium — often $35–$40 per IP in ARIN territory — because it's the minimum routable unit and demand is constant from small operators. Move up to a /20 (4,096 IPs) and the per-IP cost drops toward the market average of $32.99. At /16 scale (65,536 IPs), large buyers can negotiate below $30 per IP, particularly for APNIC or LACNIC resources. The premium for small blocks is essentially a liquidity tax — you pay more for the convenience of not having to route-aggregate.| Block | IPs | Buy: /IP | Buy: Total | Lease: /IP/mo | Lease: Monthly |
|---|---|---|---|---|---|
| /24 | 256 | $35–45 | $8,960–11,520 | $0.38–0.50 | $97–128 |
| /22 | 1,024 | $28–38 | $28,672–38,912 | $0.33–0.45 | $338–461 |
| /20 | 4,096 | $22–32 | $90,112–131,072 | $0.30–0.40 | $1,229–1,638 |
| /18 | 16,384 | $20–30 | $327,680–491,520 | $0.30–0.38 | $4,915–6,226 |
| /16 | 65,536 | $18–28 | $1,179,648–1,835,008 | $0.30–0.35 | $19,661–22,938 |
IPv4 Price History: 2011–2026
IPv4 addresses first acquired monetary value after IANA exhaustion in February 2011, with early trades pricing below $10 per IP. The market climbed steadily through the 2010s, accelerated during the pandemic-era cloud buildout, and peaked near $55–$60 per IP in some ARIN transactions during 2022–2023. AWS's decision in mid-2023 to charge $3.60/year per public IPv4 address was a turning point — it released latent supply as organizations audited their holdings and returned unused addresses. The current $32.99 average represents a roughly 40% drawdown from peak, with the market bifurcating between a premium ARIN tier and a converging RIPE/APNIC band in the low $30s.| Year | ~Price/IP | Key Event |
|---|---|---|
| 2011 | $7–12 | IANA free pool exhausted; Microsoft/Nortel deal ($11.25/IP) |
| 2012 | $8–12 | RIPE NCC reaches last /8; begins /22-only allocation |
| 2014 | $10–15 | LACNIC free pool exhausted |
| 2015 | $8–15 | ARIN free pool exhausted |
| 2017–18 | $12–18 | Leasing market grows; cloud demand rises |
| 2019 | $18–24 | RIPE NCC exhausts remaining free pool |
| 2021–22 | $50–60+ | Post-pandemic peak; hyperscaler build-outs |
| 2024 | $35–52 | AWS IPv4 charge ($0.005/IP/hr); large block correction |
| 2025–26 | $18–45 | Market bifurcation; /16s below $20 for first time since 2019 |
Market Structure: Who Is Buying & Selling
The buy side is dominated by cloud providers scaling out bare-metal and VPS infrastructure, mid-tier ISPs in emerging markets adding subscriber capacity, and enterprises consolidating address space for hybrid-cloud architectures. Sellers skew heavily toward legacy holders — universities, government agencies, and corporations that received large allocations in the 1990s and have no operational use for them. Bankruptcy estates and M&A divestitures continue to feed supply in episodic bursts, often producing the period's largest single-block transactions.IPv4 vs. Other Asset Classes
At a 21.3% implied annual yield from leasing, IPv4 addresses outperform virtually every traditional asset class on a cash-flow basis. US 10-year Treasuries yield around 4.3%; commercial real estate cap rates sit in the 5–7% range; the S&P 500's dividend yield is under 1.5%. The catch is liquidity — you can't sell a /24 with the click of a button the way you exit a stock position. But for patient capital comfortable with a two-to-four-week transaction cycle, IPv4 blocks offer risk-adjusted returns that are hard to match.| Asset Class | Typical Yield | Liquidity | Primary Risk |
|---|---|---|---|
| IPv4 | 21.3% | Moderate | IPv6 adoption, block quality |
| Commercial Real Estate | 5–8% | Low | Vacancy, rate cycle |
| Investment-Grade Bonds | 4–5% | High | Duration, credit risk |
| S&P 500 | ~1,3% | High | Market volatility |
| Money Market / T-Bills | ~4–5% | High | Rate cycle changes |
IPv6 Adoption & Why IPv4 Remains Essential
IPv6 adoption continues to creep forward — Google's measurements show roughly 45% of traffic reaching its services over IPv6 — but the long tail of IPv4 dependency stretches far into the future. The majority of enterprise applications, VPN endpoints, legacy hardware, and IoT device stacks remain IPv4-only, and dual-stack requirements mean operators need both protocols for years to come. Any thesis built on IPv4 becoming worthless requires IPv6 to reach near-universal deployment, a milestone that remains at least a decade out by even the most optimistic projections.AI & Cloud Infrastructure Demand
AI infrastructure buildout is emerging as a meaningful incremental demand driver for IPv4. Training clusters and inference farms require large contiguous address blocks for internal networking, API endpoints, and model-serving infrastructure — and the hyperscale pace of GPU datacenter construction means these requirements materialize fast. We estimate AI-related demand accounted for a low-single-digit percentage of H2 volume, but the trajectory is clearly upward as every major cloud and enterprise AI platform expands its footprint.What Determines IPv4 Block Value
Not all /24s are created equal. Blacklist status is the single biggest value destroyer — a block appearing on Spamhaus or similar lists can trade at a 20–30% discount until cleaned. Allocation age matters too: older blocks with long registration histories tend to carry fewer reputation issues. RIR origin affects transferability and routing acceptance, with ARIN and RIPE blocks commanding premiums over APNIC and LACNIC equivalents in Western markets. Clean WHOIS records, no sub-allocation history, and straightforward chain of custody all add value at the margin.Sell vs. Lease: A Decision Framework
In a declining-price environment, the math tilts toward selling if you don't foresee operational use within 3–5 years. Holding and leasing at 21.3% annual yield is attractive, but only if you believe prices won't fall faster than your lease income accumulates — a $3 per-IP annual price decline would eat into returns meaningfully. For holders sitting on large blocks (/16 or bigger), a hybrid approach makes sense: sell a portion at current prices to lock in gains while leasing the remainder for ongoing income.| /24 Purchase price | $8,445 |
| /24 Lease price | $150 / mo |
| Payback period | 56.3 mo (4.7 yr) |
| Gross annual yield | 21.3% |
RIPE NCC 24-Month Transfer Restriction
RIPE NCC's 24-month holding rule — which prevents resale of newly acquired blocks within two years — acts as a supply dampener that paradoxically supports both pricing stability and the ARIN premium. Blocks approaching their 24-month anniversary create predictable future supply waves, and sophisticated buyers time purchases around these windows. The rule also discourages pure-play speculation in RIPE space, which keeps the market more operationally driven than it might otherwise be.Deal Size Distribution
The deal-size distribution is heavily skewed toward small transactions: 326 deals (79.7%) came in under $50,000, accounting for just $5.7 million in value. Meanwhile, the 10 deals above $1 million generated $19.5 million — 50.1% of total market value from 2.4% of transactions. Average deal size jumped to $94,902 from $63,595 in H1 2024, a 49.2% increase driven by a handful of large ARIN block trades in Q4. This bifurcation between high-frequency small trades and low-frequency whale deals is a defining structural feature of the market.Top Trading Countries
Granular country data isn't available for this period, but RIR shares offer directional insight. RIPE's 49.6% dominance suggests Germany, the Netherlands, and the UK remain top buyers — these three countries consistently lead European IPv4 demand due to their dense hosting and ISP ecosystems. On the ARIN side, US-based buyers account for the vast majority, with Canadian operators representing a small but steady share.BEAD Broadband Program Impact
The $42.45 billion BEAD broadband program is beginning to ripple through IPv4 demand planning. ISPs awarded BEAD funding will need to provision new subscribers, and many will require IPv4 allocations — particularly for fixed wireless and fiber-to-the-home deployments in underserved areas where IPv6-only isn't operationally viable. We expect BEAD-driven demand to concentrate in the /20 to /18 range over 2025–2026, potentially tightening supply for mid-size ARIN blocks and pushing that segment's pricing above the current $35.50 average.Hyperscaler IPv4 Holdings
Amazon, Microsoft, and Google collectively hold tens of millions of IPv4 addresses — Amazon alone controls an estimated 100+ million. These holdings act as a ceiling on market pricing: if per-IP costs rise too far, hyperscalers can rationalize internal usage and release blocks, flooding the market. Conversely, AWS's $3.60/year public IP charge has already prompted customers to return millions of addresses, increasing available supply. The hyperscalers' dual role as the market's largest holders and its most influential demand-setters makes their policy decisions the single most important variable in the medium-term price outlook.Macroeconomic Conditions & Market Impact
The Fed's rate trajectory matters more to this market than most participants acknowledge. Higher rates increase the opportunity cost of capital tied up in IPv4 blocks, which pressures holders to monetize and gives buyers more negotiating leverage. Enterprise IT budgets expanded modestly in H2 2024 after the belt-tightening of 2023, supporting the 19.2% jump in transaction volume. If 2025 brings rate cuts, expect some capital rotation back into digital infrastructure assets — including IPv4 — which could firm up pricing.Model Update & Calibration
We reviewed our past projections against actual market outcomes and recalibrated the model for this report. The updated model places more weight on recent price movements using exponential decay, dynamically adjusts prediction bands to reflect current market conditions, and corrects for any systematic bias detected in earlier forecasts. The predicted-vs-actual comparison chart below shows how closely our past estimates tracked reality.
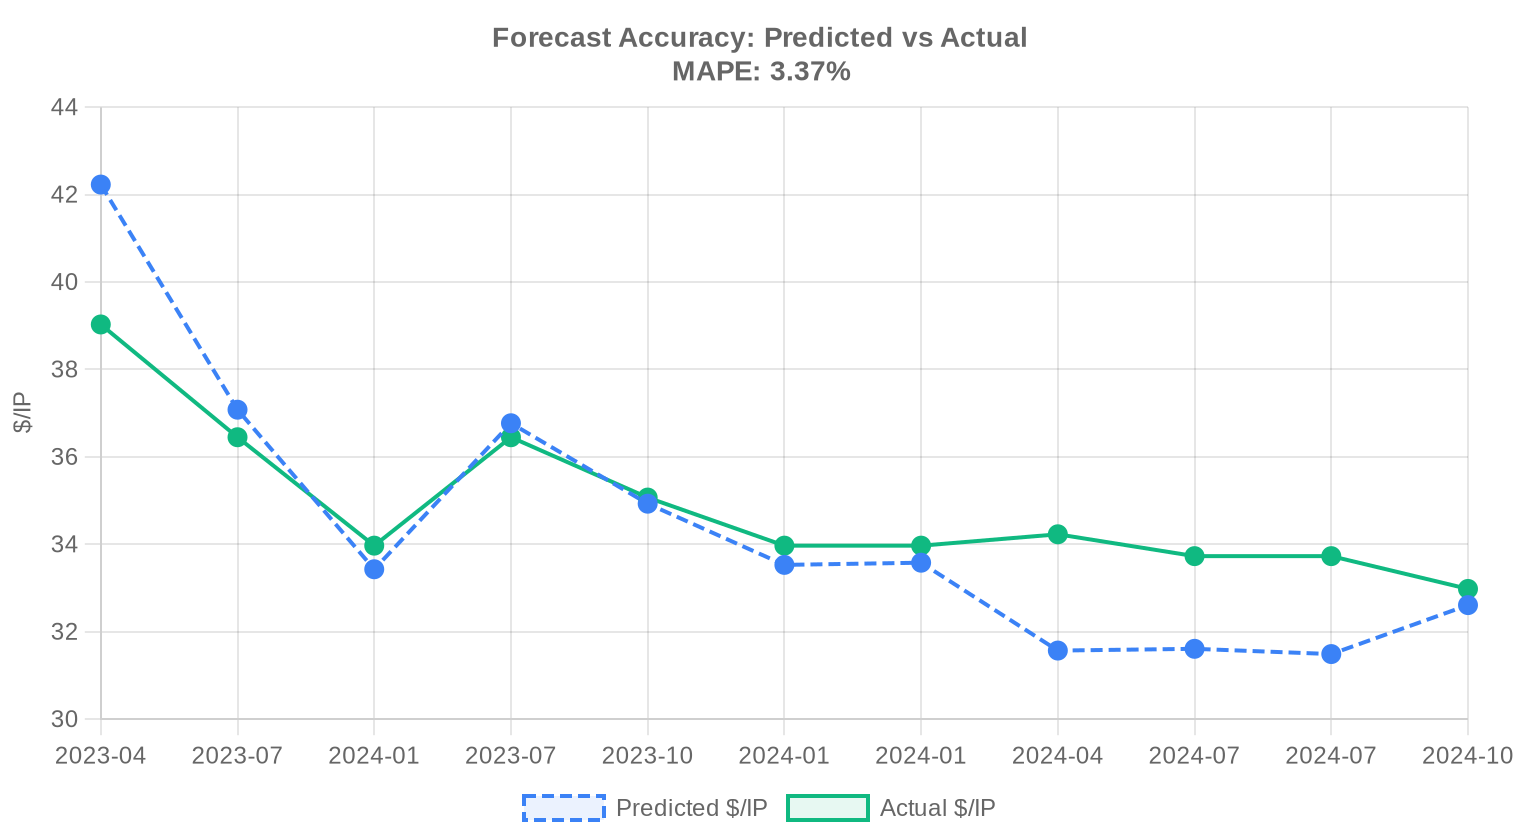
| Report Period | Target Month | Predicted | Actual | Deviation |
|---|---|---|---|---|
| 2023-H2 | 2024-01 | $34 | $34 | -1% |
| 2023-Q4 | 2024-01 | $34 | $34 | -1% |
| 2024-Q1 | 2024-04 | $32 | $34 | -8% |
| 2024-H1 | 2024-07 | $32 | $34 | -6% |
| 2024-Q2 | 2024-07 | $31 | $34 | -7% |
| 2024-Q3 | 2024-10 | $33 | $33 | -1% |
Methodology
Figures are based on completed IPv4Center marketplace transactions and RIR transfer statistics. Prices are in US dollars per IP address. Forecasts are produced by an AI model that analyses each block-size band and RIR segment separately (with outlier-trimmed medians) alongside known market catalysts; they are estimates, not guarantees.
Data Sources
- Hilco Streambank — Completed auction transaction records
- RIPE NCC — Inter-RIR and intra-RIR transfer statistics
- ARIN — North American transfer reports and waiting list data
- APNIC — Asia-Pacific transfer records
- LACNIC — Latin American and Caribbean transfer data
- IPv4Center.com — Proprietary marketplace transaction and lease pricing data
This report is generated automatically for informational purposes only and does not constitute financial advice.
Frequently Asked Questions
What was the average price per IPv4 address in H2 2024?
The market-wide average settled at .99 per address, with a median of . The spread between the two is narrow — a sign of reasonably symmetric price distribution across the 409 recorded transactions.
How did ARIN pricing compare to RIPE in the second half of 2024?
ARIN space commanded a meaningful premium: .50 average versus .45 for RIPE, roughly a 9.4% differential. ARIN blocks also exhibited the widest range (–), suggesting greater price dispersion driven by block quality and legacy status considerations.
Why is APNIC-region space trading at a discount to both ARIN and RIPE?
APNIC addresses averaged .77 per IP in H2 2024, about 7% below the global mean. Thinner secondary-market liquidity, more complex inter-RIR transfer mechanics, and periodic supply from network consolidations in Southeast Asia all contribute to the discount.
Were there any transactions in the AFRINIC region during H2 2024?
Zero. AFRINIC recorded no priced transactions in the period, consistent with the ongoing governance and transfer-policy uncertainty that has effectively frozen its secondary market. Buyers should not expect meaningful AFRINIC supply in the near term.
What was the total dollar volume of the IPv4 transfer market in H2 2024?
Approximately .8 million across 409 priced transactions covering roughly 1.18 million addresses. Ten deals alone — each exceeding million — accounted for .5 million, or just over half of total market value.
What was the most common block size traded?
/24 blocks dominated, accounting for 151 of 409 transactions (37%). This is the minimum independently routable prefix on most networks and remains the workhorse unit for small and mid-size deployments.
What does the deal-size distribution tell us about market structure?
The market is heavily bifurcated. Sub-K transactions represented 326 of 409 deals (80% by count) but only .7 million in value. Meanwhile, 10 deals above million drove .5 million — roughly 50% of aggregate dollar volume. Institutional buyers are setting the marginal price.
Is it cheaper to buy or lease IPv4 addresses at current rates?
Buy. At .99 per IP and a lease rate of .5859/month, the breakeven is 56.3 months — about 4.7 years. Any holding period beyond that favors ownership. The implied annual yield for a lessor is 21.3%, which tells you the lease market is pricing in significant convenience premium and counterparty flexibility.
What is the current monthly lease rate for a /24 block?
Approximately 0 per month, based on a sample of 44 observed lease transactions concentrated in the RIPE region. Annualized, that's ,800 per /24 — roughly 21% of the purchase price of ,445.
What mistakes should buyers avoid in the current market?
Three common errors: overpaying for small ARIN blocks when comparable RIPE space trades 9% cheaper; leasing for extended periods when the buy-vs-lease breakeven is under five years; and neglecting transfer-approval timelines, which can add 4–8 weeks and jeopardize deployment schedules.
What are the risks of buying LACNIC-region addresses?
LACNIC space averaged just .61 per IP — the lowest of any active region — but only 14 transactions occurred in H2 2024. Thin liquidity means price discovery is poor, resale can be difficult, and transfer policy constraints limit the buyer universe. The discount exists for a reason.
What are the risks of delaying an IPv4 purchase into 2025?
The H2 2024 trend was up, with prices rising roughly 2.0% over the period. Our year-end 2024 forecast of .63 held, and the trajectory points modestly higher. Deferral carries the risk of incrementally higher per-IP costs and potential supply tightening as consolidation continues.
How many total transfers — priced and unpriced — were recorded in H2 2024?
5,382 total transfers across all RIRs, of which 409 had verifiable pricing. RIPE accounted for 3,268 transfers (60.7%) and ARIN for 2,114 (39.3%). The gap between total transfers and priced deals reflects intra-company reassignments, M&A-related moves, and privately negotiated transactions with undisclosed terms.
Which RIR processed the most transfers by volume?
RIPE, by a wide margin — 63.5% of all recorded transfers in the trailing 24-month window versus 36.5% for ARIN. APNIC, LACNIC, and AFRINIC registered negligible transfer activity in the formal registries during the period.
What was the price floor and ceiling observed in H2 2024?
The global floor was per IP (observed in both ARIN and APNIC transactions), while the ceiling hit — an ARIN block, likely a clean legacy /16 or similar premium asset. That spread represents a 73% premium from trough to peak, underscoring how much block attributes matter.
What is the average deal size in dollar terms?
Roughly ,900 per transaction. But this figure is heavily skewed by the 10 mega-deals exceeding million each. The median deal is considerably smaller, with 80% of transactions closing below ,000.
Has IPv6 adoption reduced demand for IPv4 addresses?
Not in any way visible in pricing data. H2 2024 averages rose approximately 2% and transaction volume remained robust at 409 deals. IPv6 deployment continues to advance — Google reports over 45% of its traffic via IPv6 — but enterprise, cloud, and hosting demand for routable IPv4 space remains structurally intact.
What is the forecast for IPv4 prices heading into early 2025?
Our model projects a near-term price of .72 per IP, essentially stable with the H2 2024 average. Forecast confidence is high. The market appears to be in a consolidation phase — not collapsing, not surging — with a slight upward bias driven by steady depletion of readily transferable inventory.
Should a company with a 3-year horizon lease or buy?
Lease. The breakeven point is 56 months (4.7 years), so a company certain it needs the space for only three years saves approximately 36% versus buying — assuming no residual value recovery on resale. If the horizon is uncertain or likely longer, buying is the better bet.
What drove the 2% price increase during H2 2024?
Continued supply attrition is the primary factor. Free-pool exhaustion at all five RIRs is now a settled fact, and the stock of easily transferable blocks — particularly clean, non-legacy ARIN and RIPE space — shrinks each quarter. Demand from cloud infrastructure, AI-related buildouts, and hosting providers remains steady.
What mistakes do sellers commonly make in this market?
Underpricing ARIN blocks is the most frequent error; ARIN space averaged .50 versus .99 globally, and sellers unfamiliar with the regional premium leave money on the table. Sellers also frequently underestimate the time required for RIR approval, leading to deal fatigue and renegotiation.
How long does a typical IPv4 transfer take to complete?
RIPE transfers generally close in 2–4 weeks. ARIN transfers run 4–8 weeks due to more stringent needs-based justification requirements. Buyers should factor these timelines into project planning — especially for ARIN space, where incomplete justification documents are the single largest source of delay.
Is there meaningful price differentiation between /24 and larger blocks?
Yes. Smaller blocks (/24s) tend to trade at or slightly above the median — per IP — while bulk purchases in the /16 range can command premiums of 20–40% on a per-IP basis for clean, well-documented blocks. Conversely, deeply fragmented or reputation-impaired space trades at the – floor.
What are the risks of purchasing addresses with poor reputation or blacklist history?
Significant. Blocks with spam or abuse history can take months to rehabilitate across major RBLs, and some services (notably Microsoft 365 and certain CDNs) are notoriously slow to delist. The floor price observed in H2 2024 almost certainly reflects reputation-impaired inventory. Due diligence on blacklist status is non-negotiable.
How concentrated is the sell side of the market?
Highly. Ten transactions above million accounted for 50.2% of total market value (.5 million of .8 million). The IPv4 market resembles other finite-resource markets — a small number of institutional holders control disproportionate supply, giving them pricing power in block negotiations.