15 min read
This report analyzes the IPv4 transfer market for Second Half 2025, based on completed IPv4Center marketplace transactions and official RIR transfer records.
Executive Summary
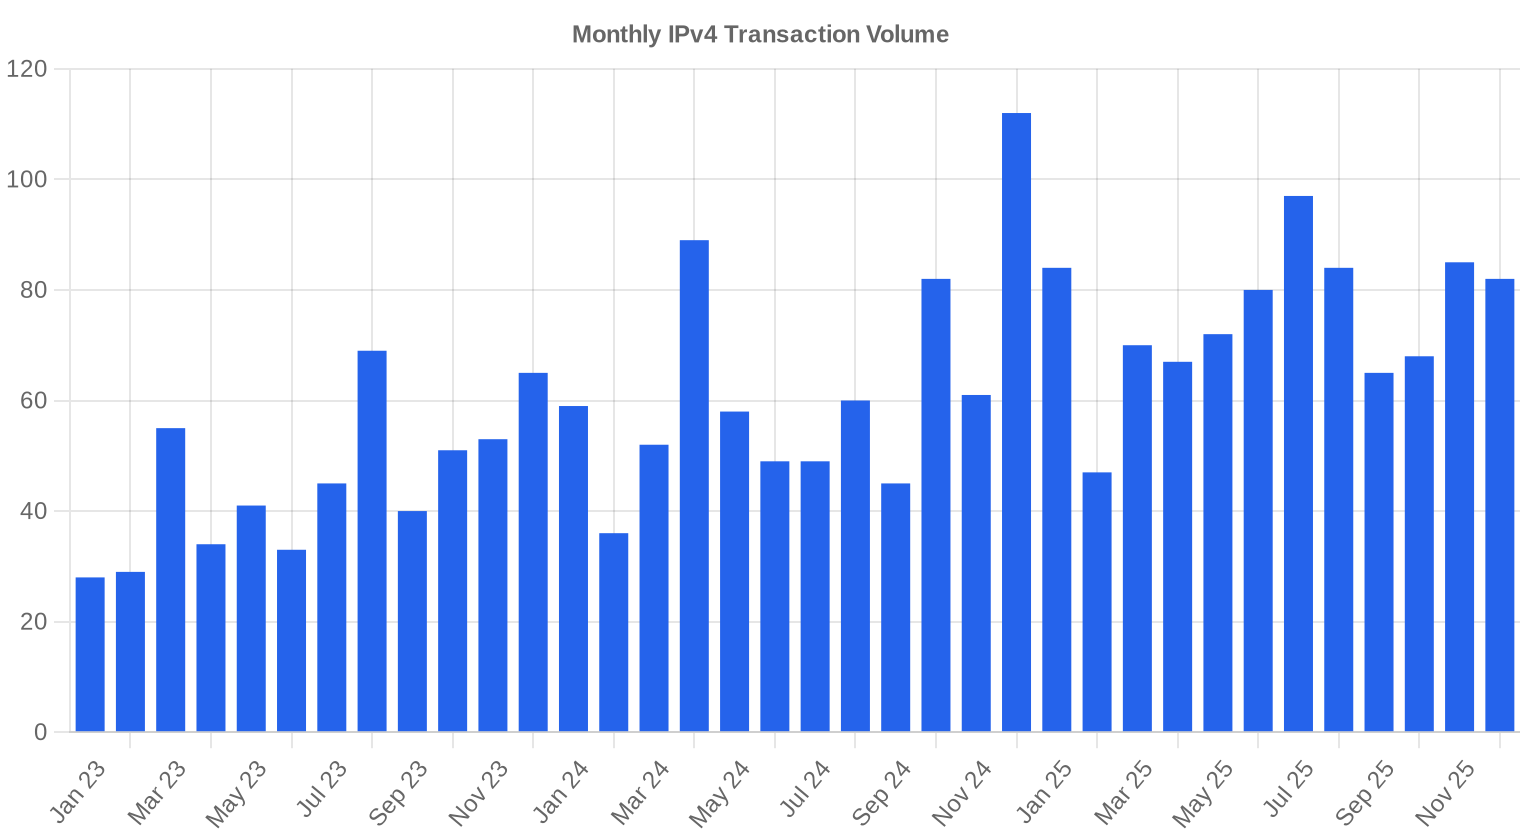
The IPv4 transfer market lost another fifth of its value in the second half of 2025. Across 481 recorded transactions covering 3.05 million addresses, the average price landed at $24.78/IP — down 20.4% from the first half and 24.9% below where it stood in H2 2024. Total market value for the period was $49.9 million, with ARIN accounting for 48.2% of volume. Transaction count actually rose 14.5% versus H1, meaning more deals closed but at sharply lower prices — a classic sign of sellers capitulating into declining bids rather than holding for recovery.Market Overview
| Transactions | 481 |
| IP Addresses Traded | 3,050,752 |
| Estimated Market Value | $49,859,127 |
| Average Price / IP | $24.78 |
| Median Price / IP | $25.00 |
| RIR Transfers | 4,831 |
Year-over-Year Comparison
| Metric | This period | A year earlier (H2 2024) | Change |
|---|---|---|---|
| Transactions | 481 | 409 | +17.6% |
| IP Addresses Traded | 3,050,752 | 1,176,832 | +159.2% |
| Estimated Market Value | $49,859,127 | $38,814,913 | +28.5% |
| Average Price / IP | $24.78 | $32.99 | -24.9% |
| RIR Transfers | 4,831 | 5,382 | -10.2% |
Price Dynamics
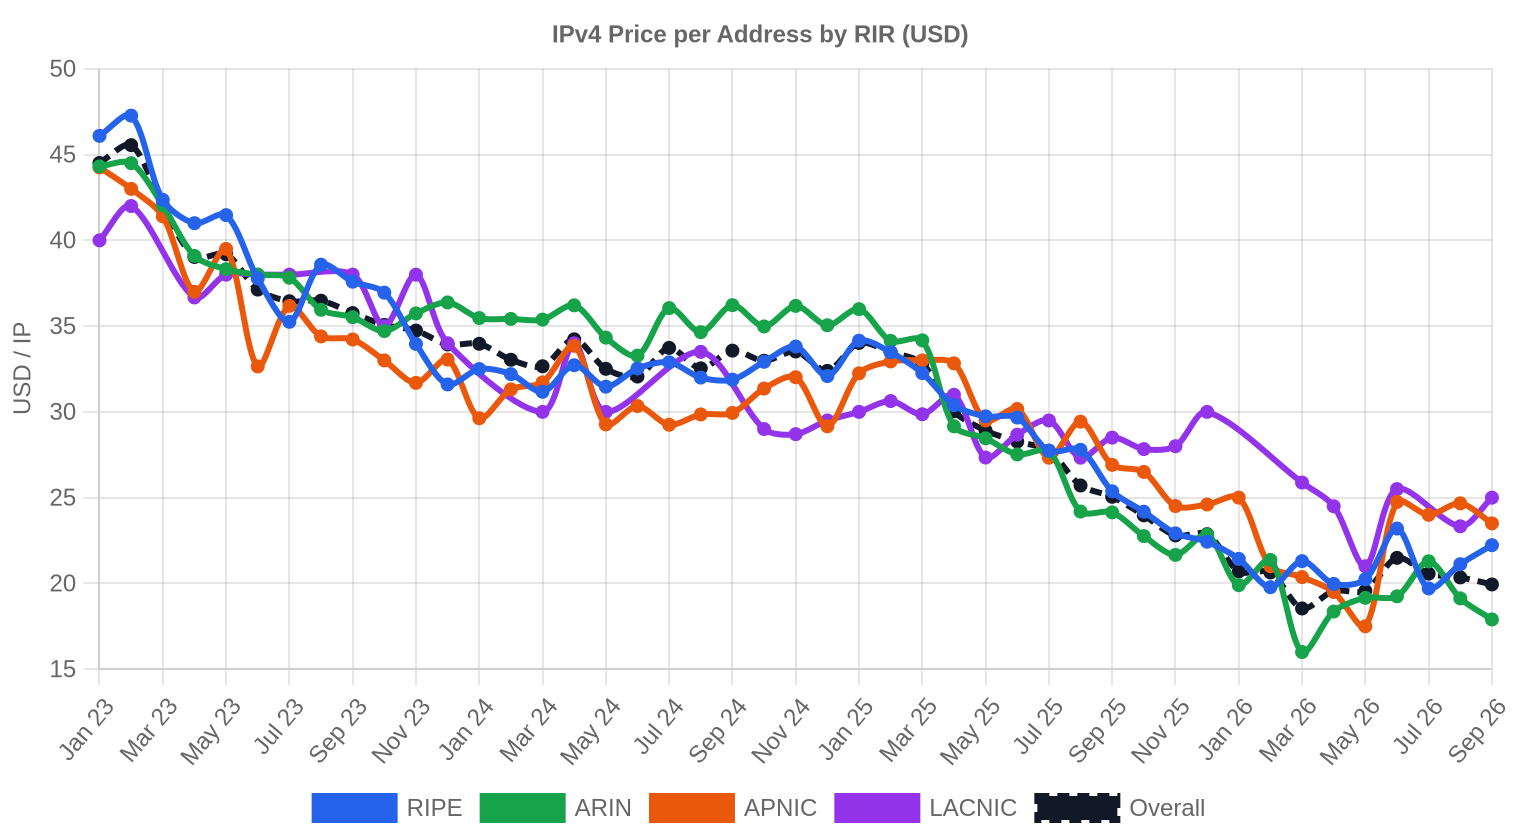
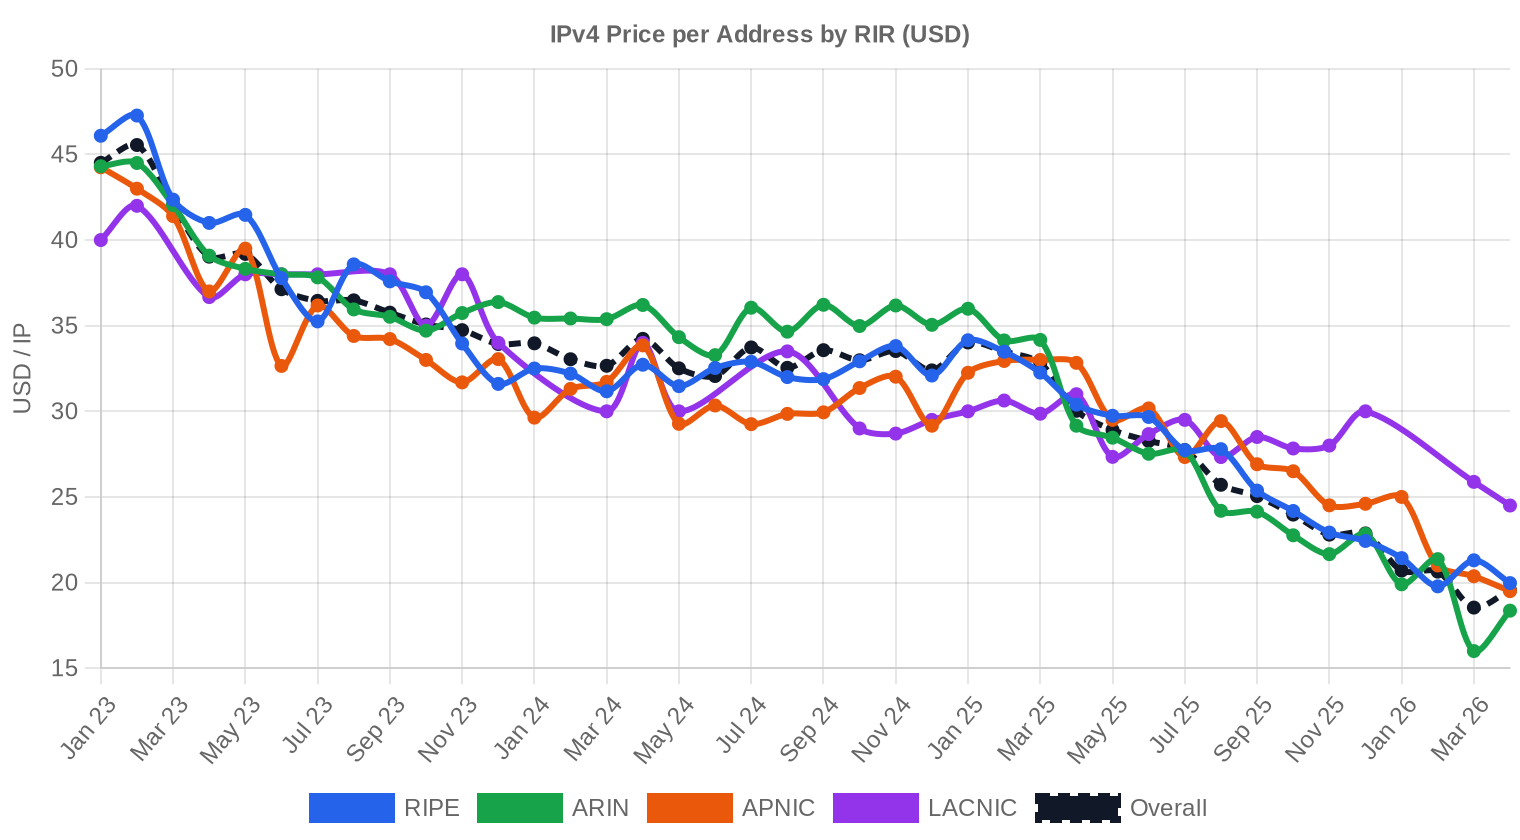
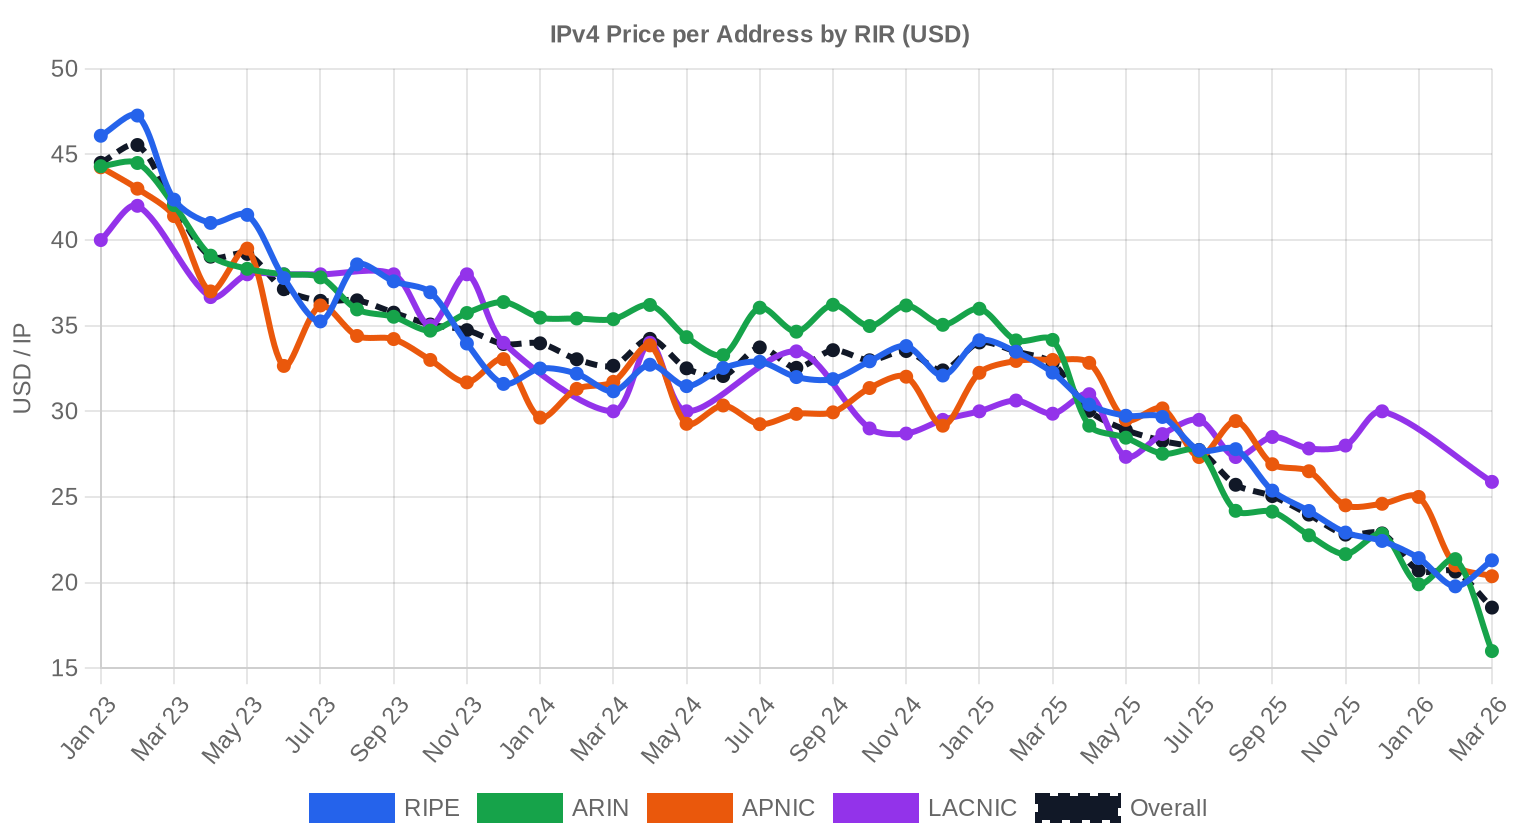
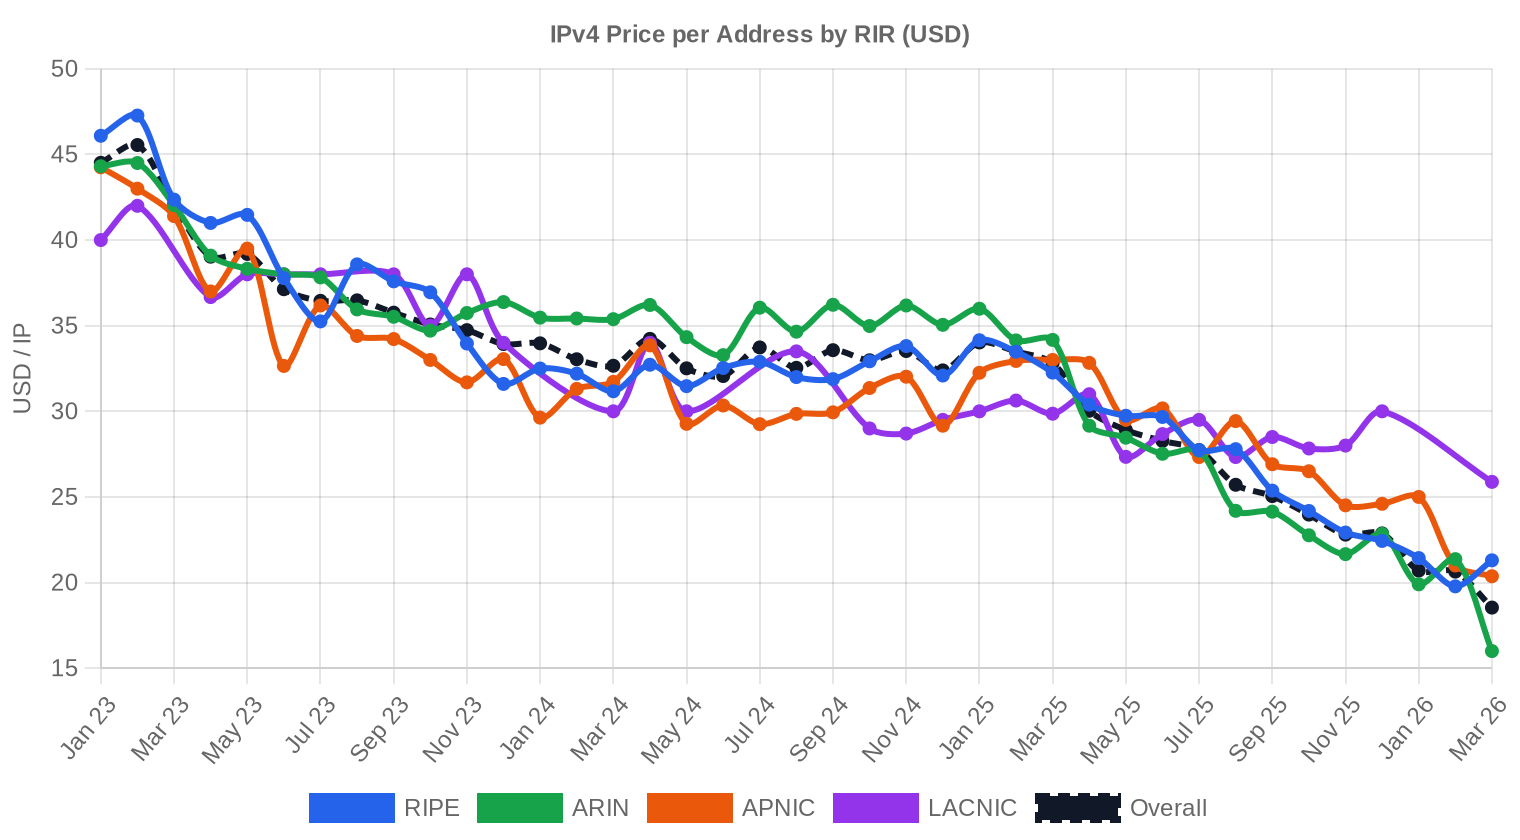
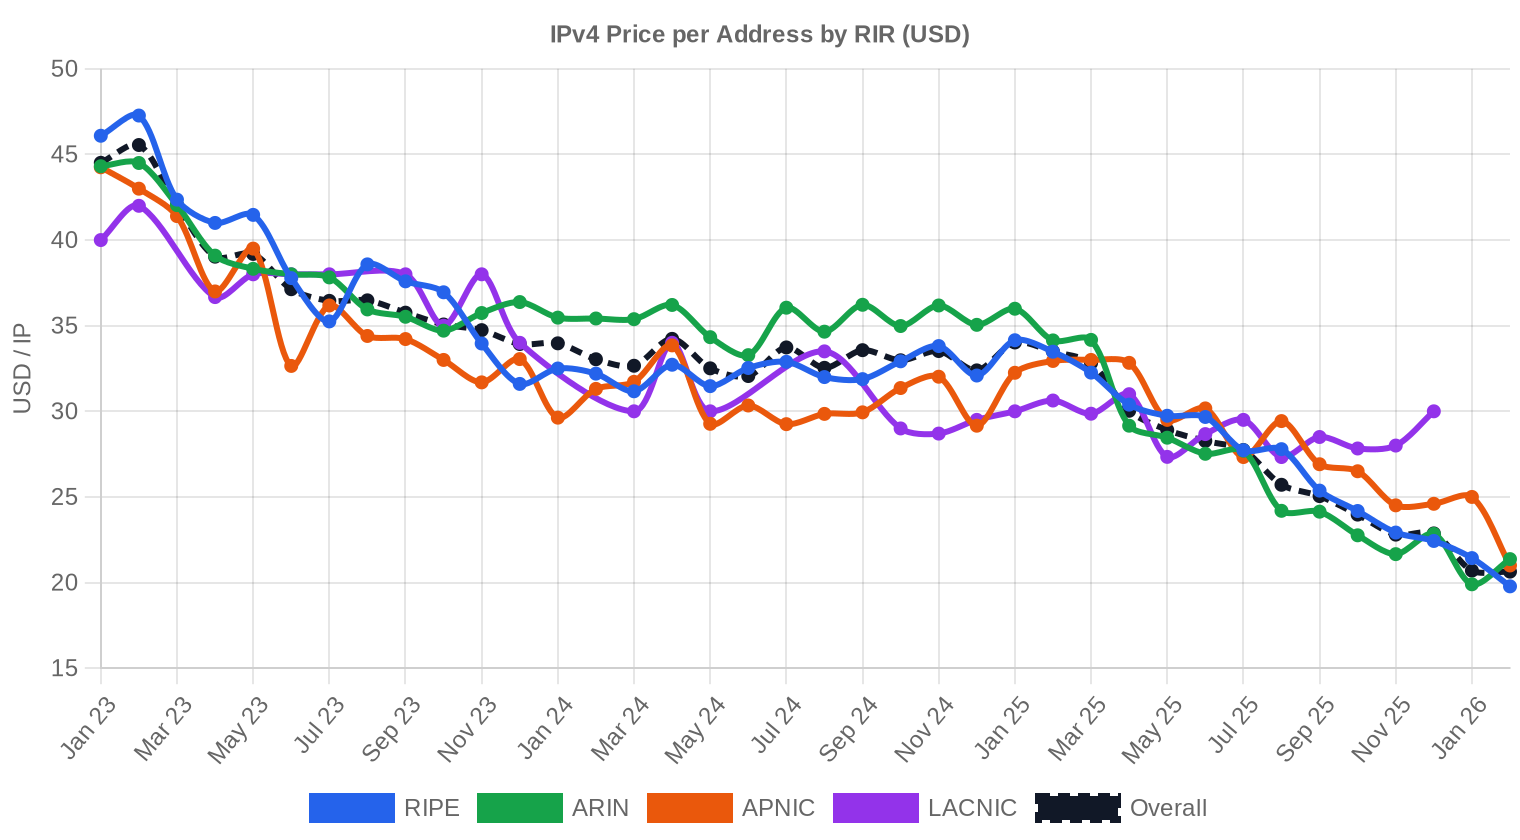
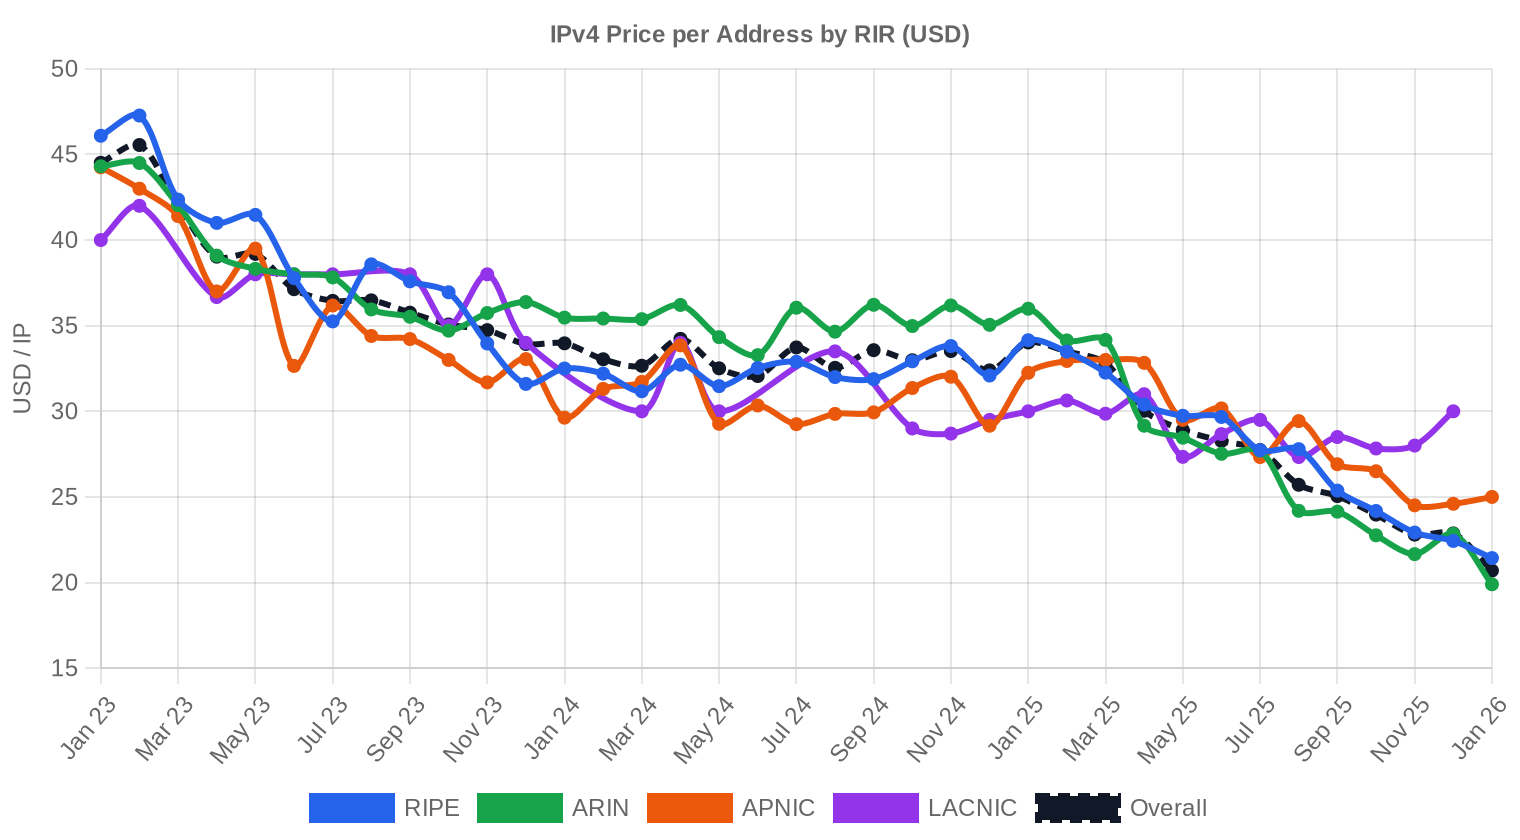
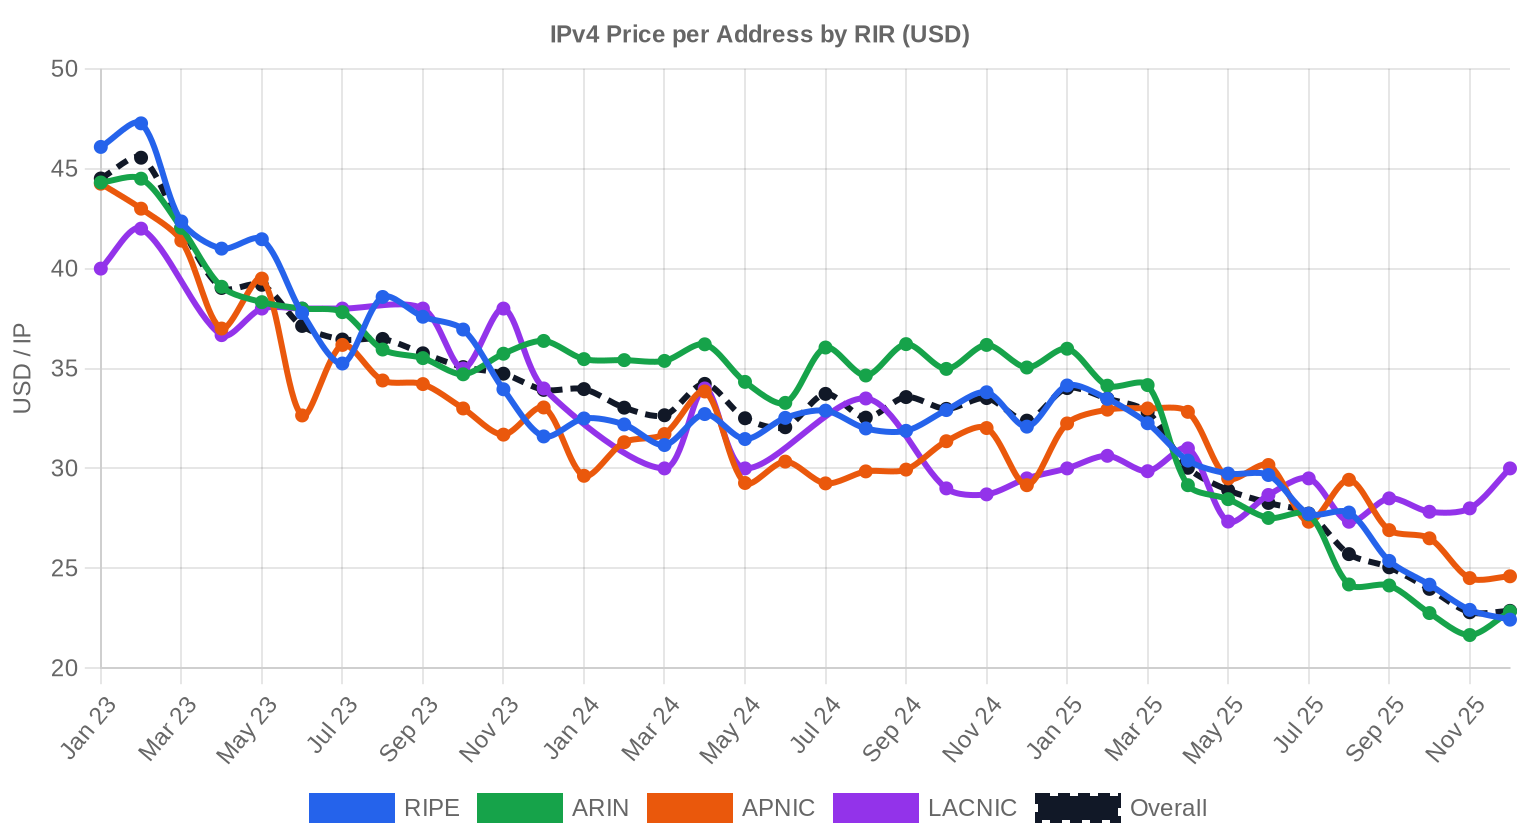
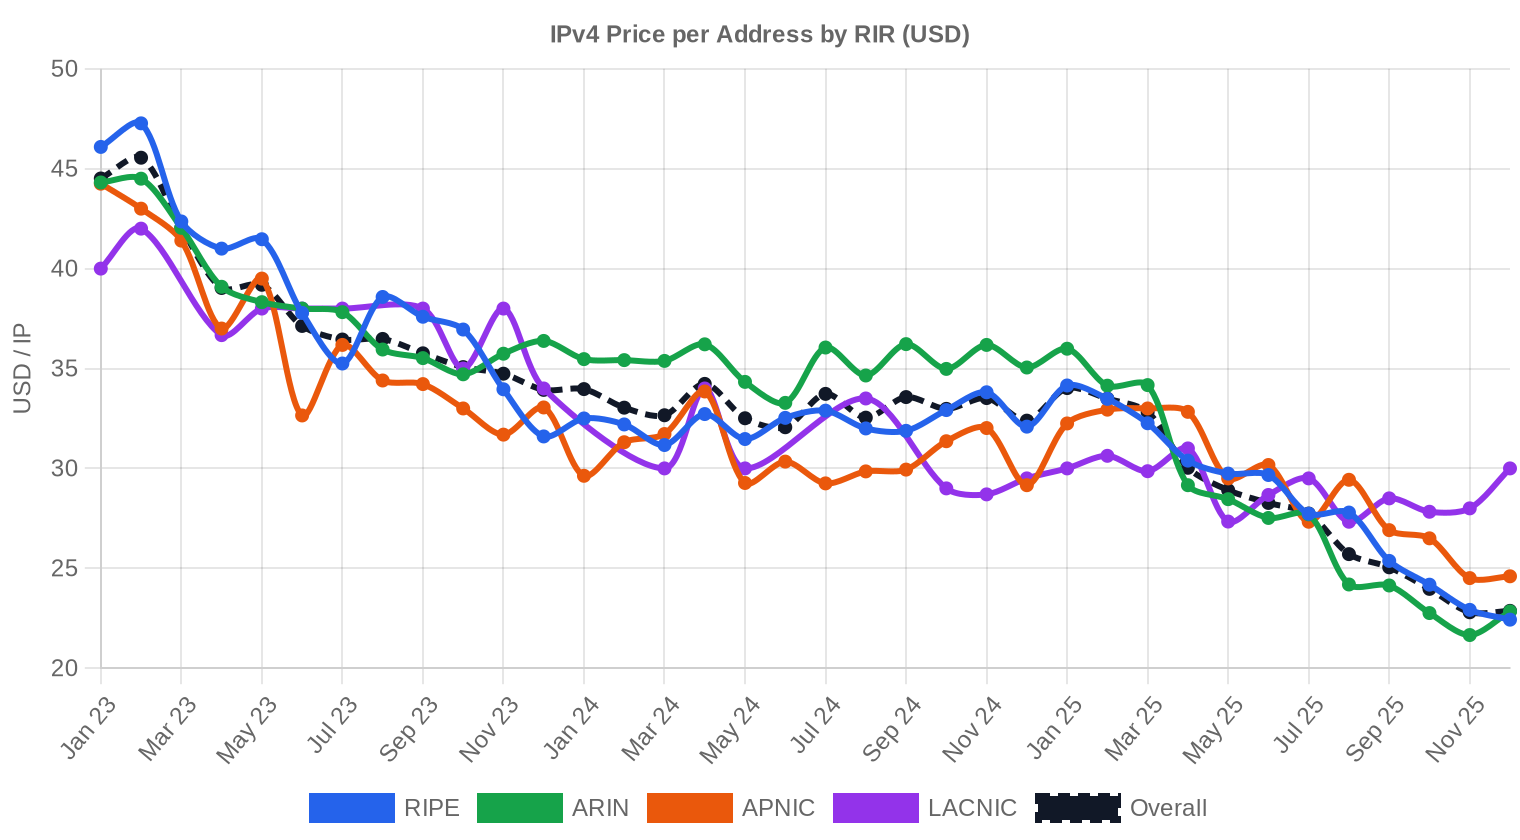
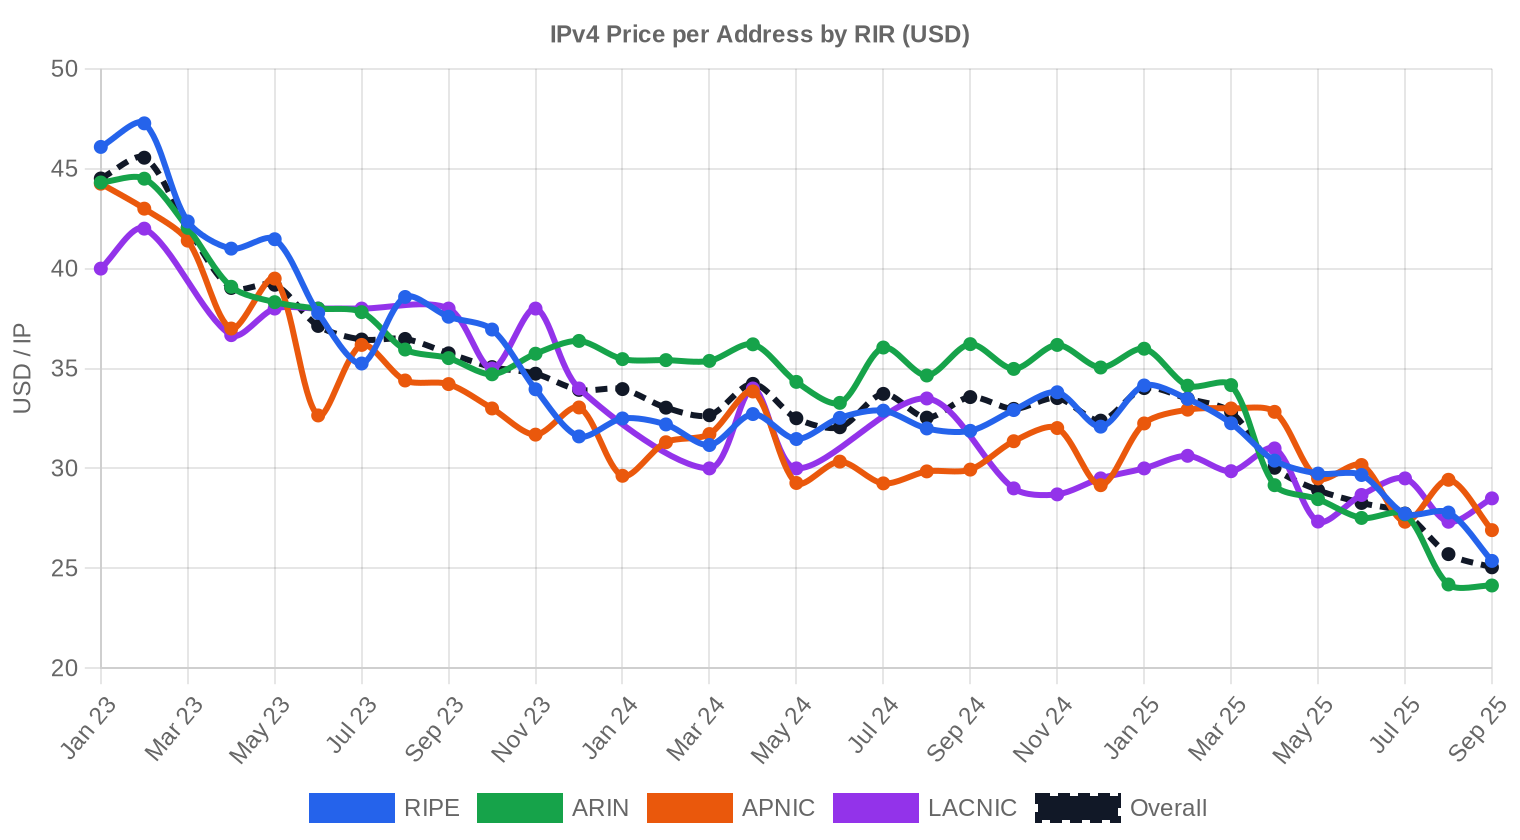
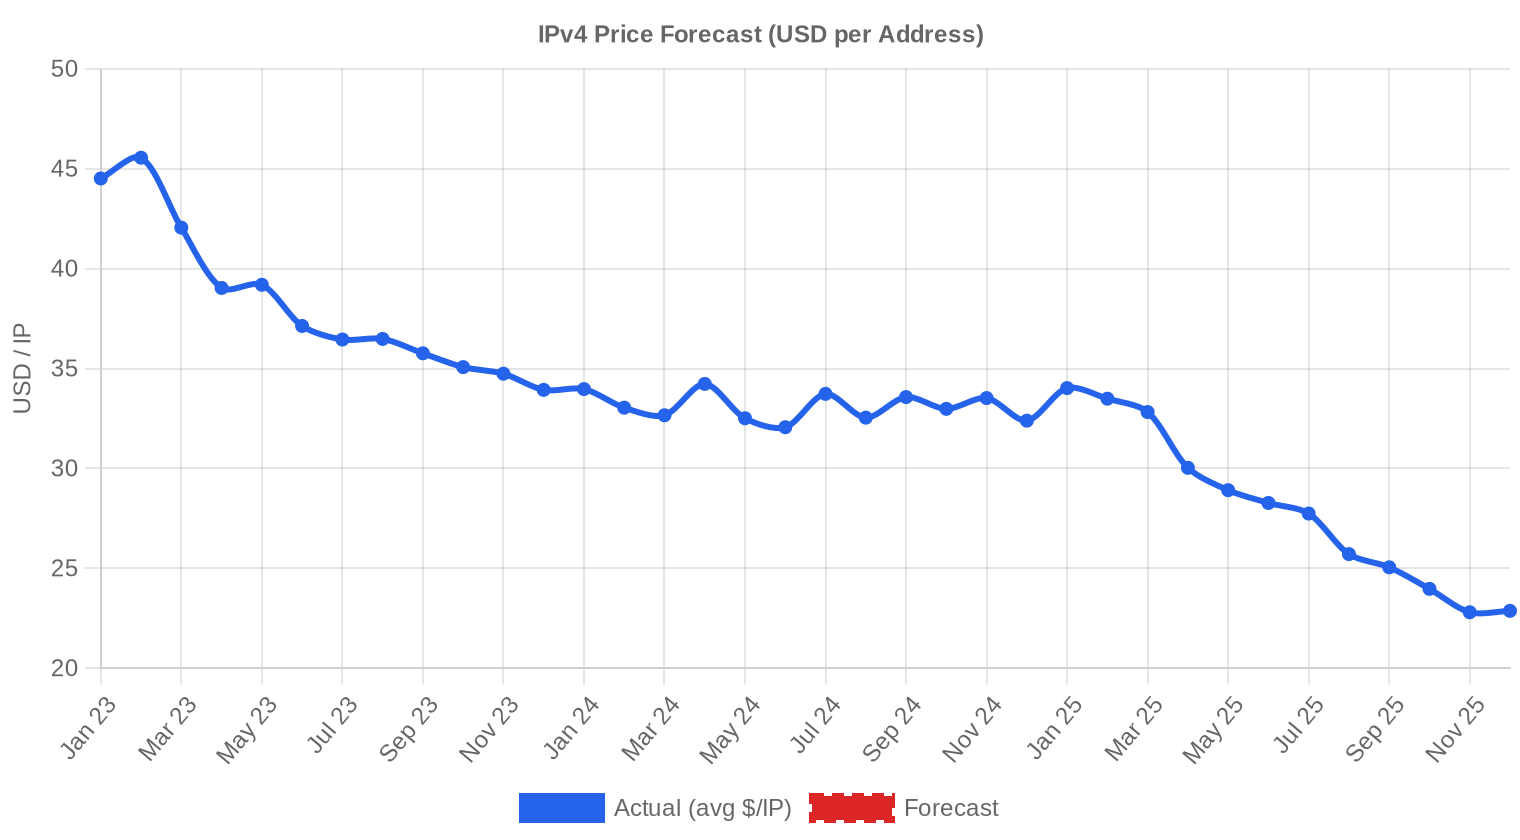
The price range this half stretched from $11/IP at the low end to $45/IP at the top, a $34 spread that reflects a bifurcated market. That $11 floor — almost certainly a large ARIN block with legacy transfer constraints or reputation issues — sits 56% below the $25 median, which itself tracks closely to the mean for once. The regression line points firmly downward: a 9.64% decline across the six-month window, accelerating from H1's already-soft trajectory. What changed is velocity. The 20.4% half-over-half drop is the steepest we've recorded since the post-AWS-charge selloff began, and the year-over-year decline of 24.9% means a /24 that fetched roughly $8,500 in mid-2024 now goes for about $6,400. Buyers have the leverage and they know it.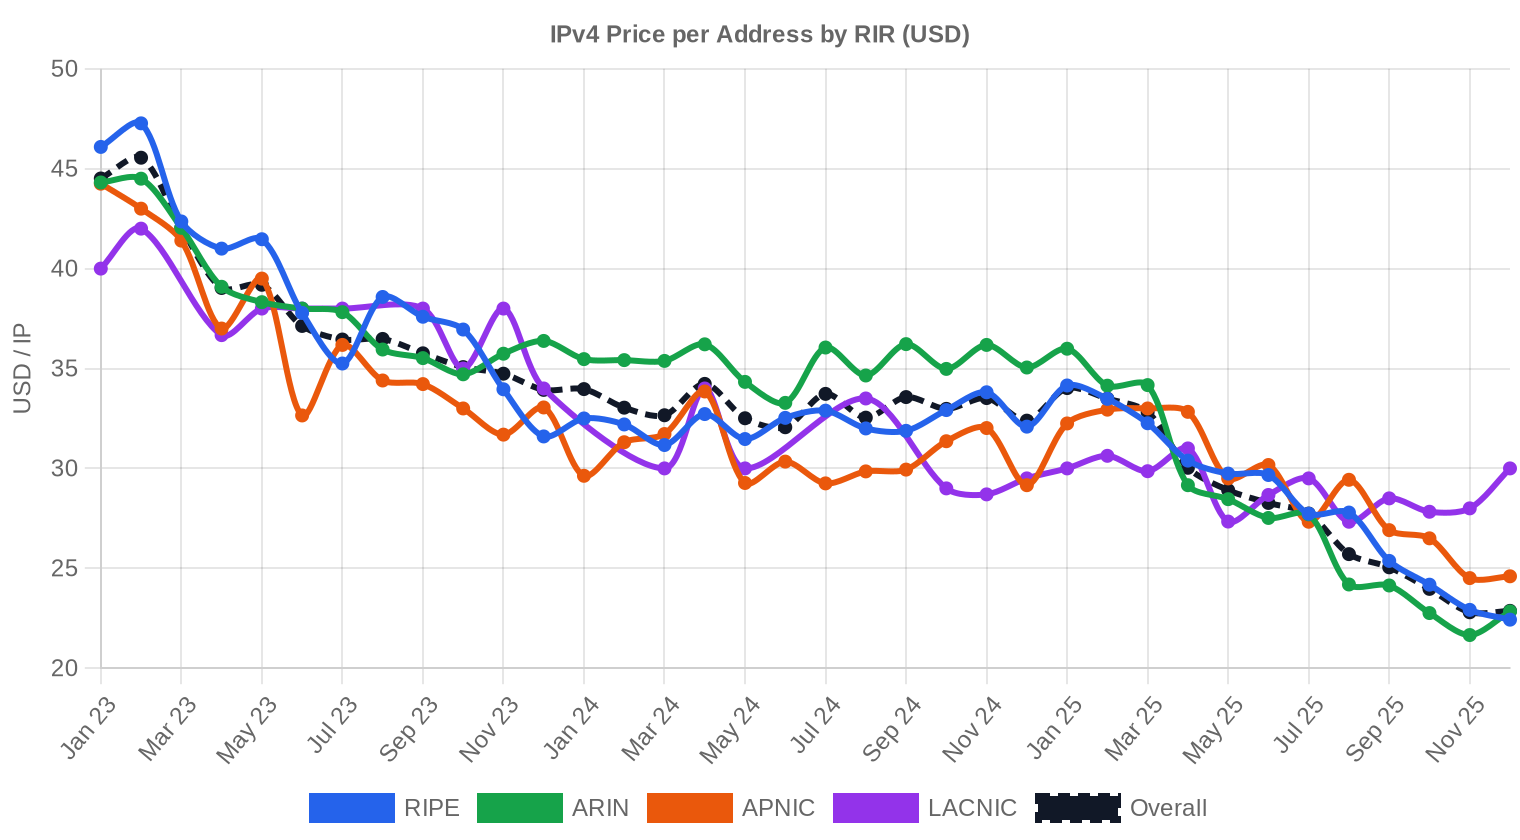
Pricing by RIR
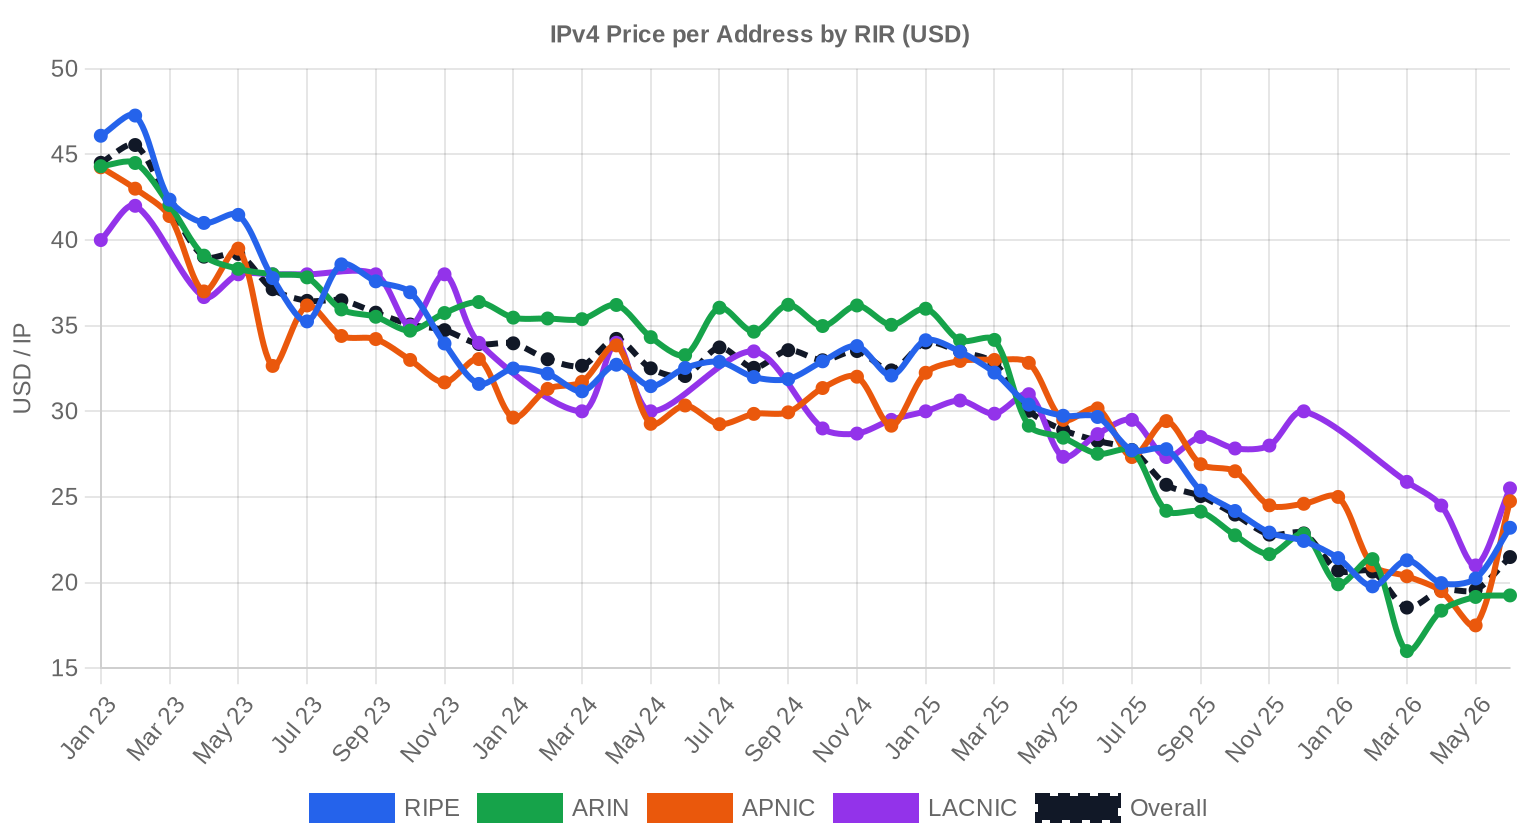
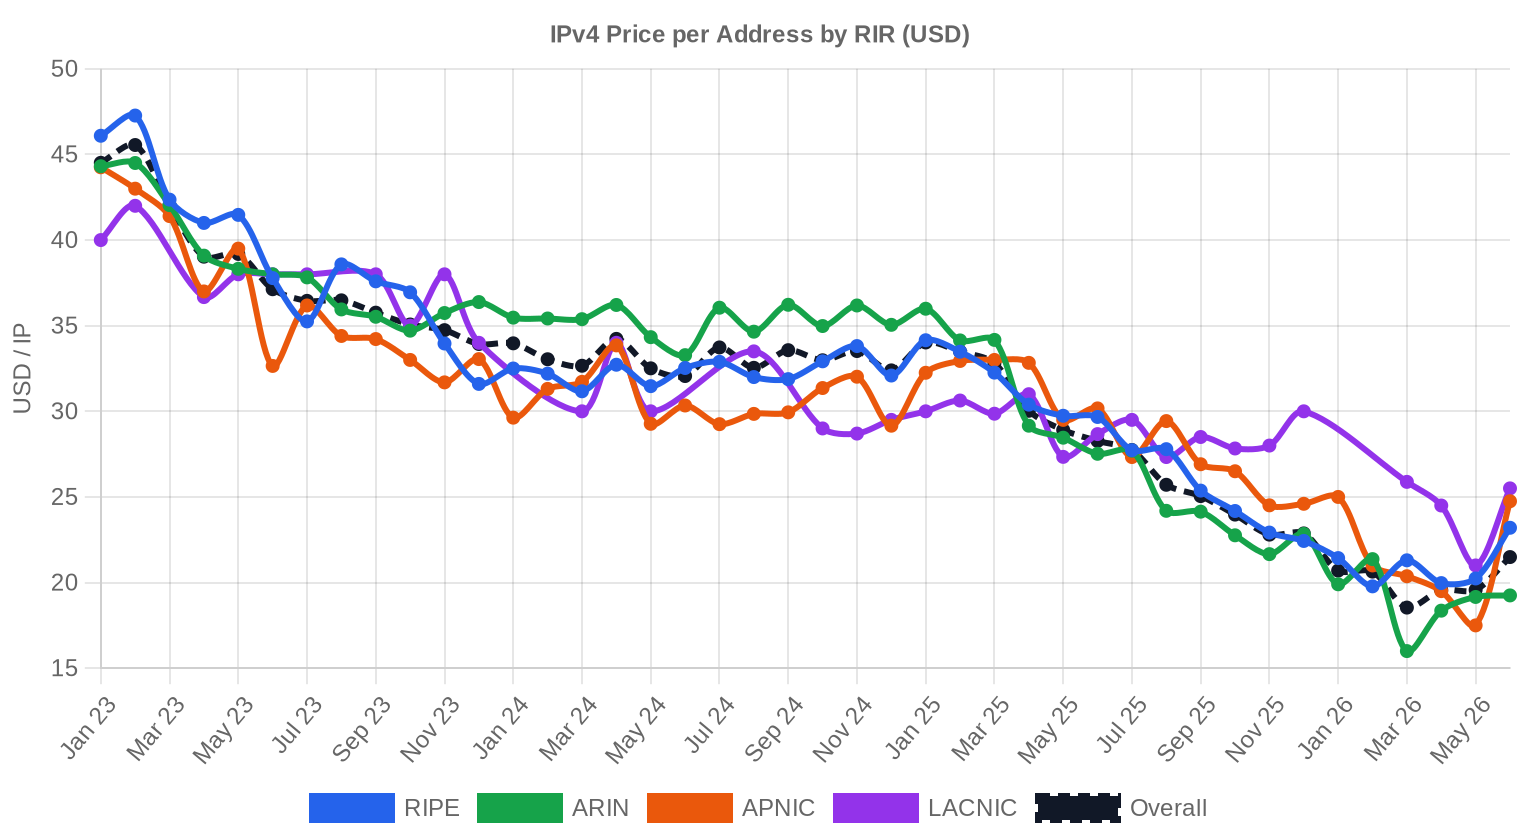
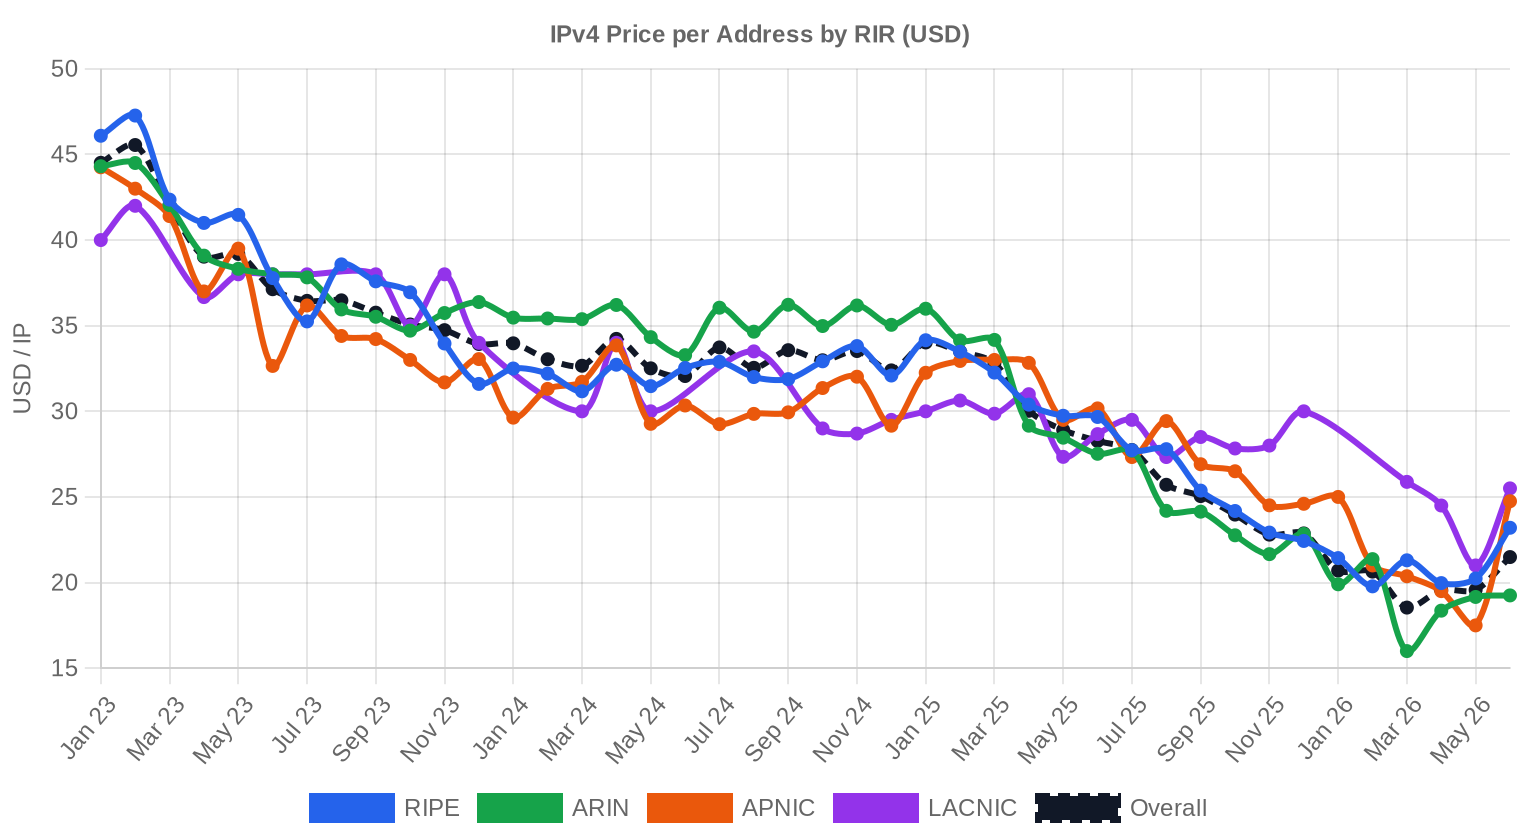
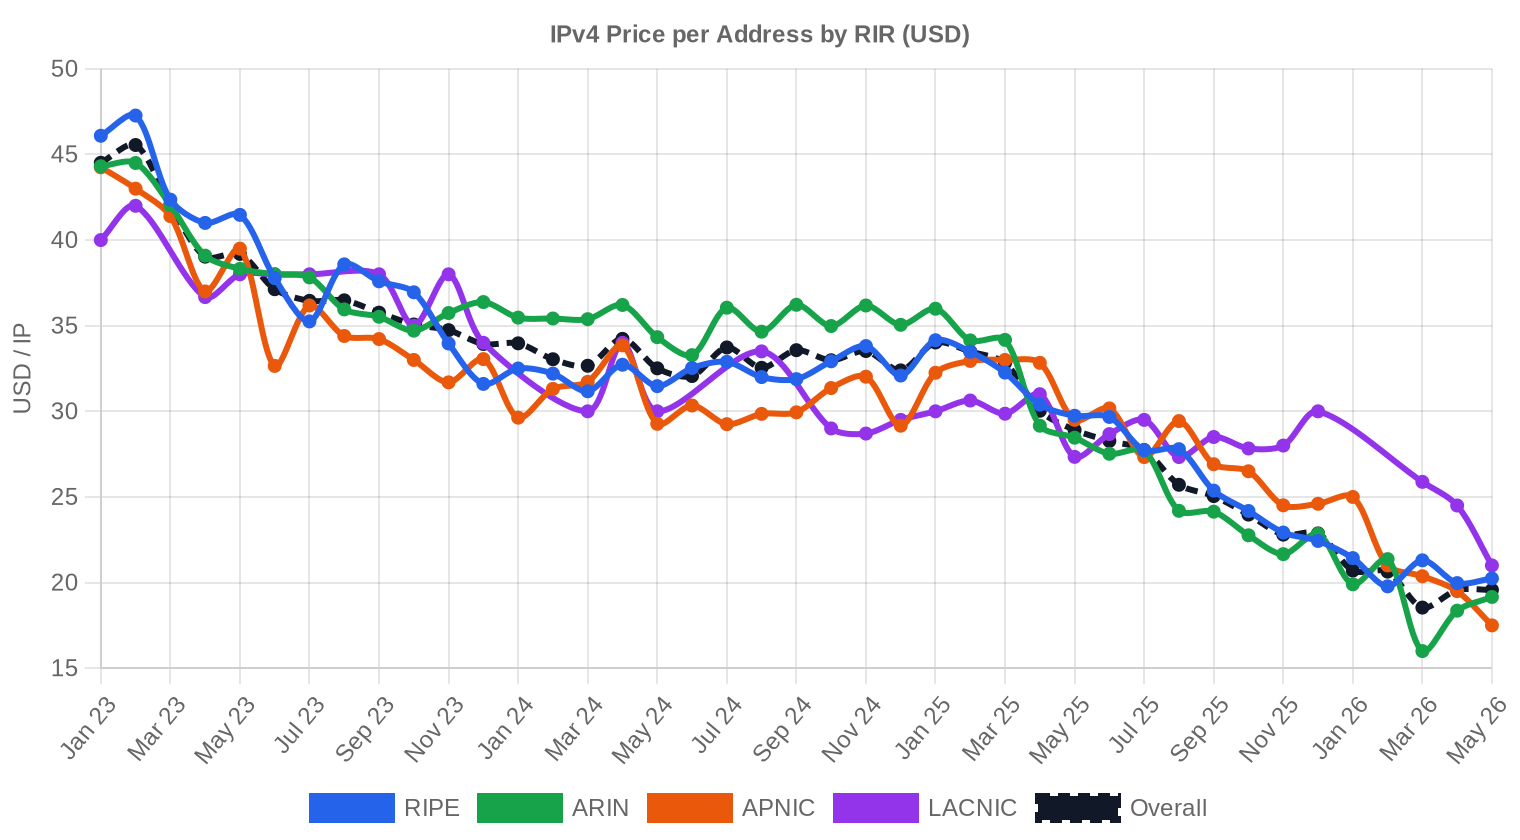
ARIN remains the volume leader but now trades at a meaningful discount to every other registry. LACNIC commands the highest premium at $28.22/IP — a 17.5% markup over ARIN — driven by chronic scarcity and minimal secondary supply in the Latin American region.ARIN: $24.01/IP average across 232 transactions (76.2% of total IP volume). The median of $24.81 and a wide $11–$45 range reflect the diversity of block sizes and quality moving through the North American registry. ARIN's discount to RIPE has widened to $1.15/IP, a reversal from 18 months ago when the two traded near parity.
RIPE: $25.16/IP average across 200 transactions (21.1% of volume). Tighter range of $13–$33 compared to ARIN, with the median at $26.25 — the highest median of any registry this period. The 24-month holding rule continues to constrain speculative flipping and keep supply measured.
APNIC: $26.31/IP across 33 transactions. Small blocks dominate here, and the narrow $19.25–$30.30 range reflects a market with limited but consistent demand from regional ISPs and hosting providers.
LACNIC: $28.22/IP across just 16 transactions. Consistently the priciest registry. The tight $25.50–$31 band and small deal flow suggest a supply-constrained market where buyers pay up because alternatives don't exist.
AFRINIC: Zero recorded transactions. The ongoing governance crisis continues to freeze the African registry's transfer market entirely.
| RIR | Transactions | Avg $/IP | Median $/IP | IPs Traded | RIR Transfers | Next Month (proj.) | Year-End (proj.) |
|---|---|---|---|---|---|---|---|
| RIPE | 200 | $25.16 | $26.25 | 643,584 | 3,205 | $21.00 | $18.50 |
| ARIN | 232 | $24.01 | $24.81 | 2,325,248 | 1,626 | $21.50 | $19.00 |
| APNIC | 33 | $26.31 | $26.00 | 38,144 | 0 | $25.00 | $23.00 |
| LACNIC | 16 | $28.22 | $28.00 | 43,776 | 0 | $29.50 | $28.50 |
Transaction Volume

Supply & Block Sizes
/24 blocks dominated deal flow again, accounting for 153 of 481 transactions — roughly one in three deals. Buyers continue to favor this size for targeted deployments: mail server reputation, small hosting environments, and CDN edge nodes where a single /24 is the practical minimum. Larger blocks moved in fewer but higher-value deals, with 27 transactions exceeding $1 million and collectively representing over $52 million in notional value.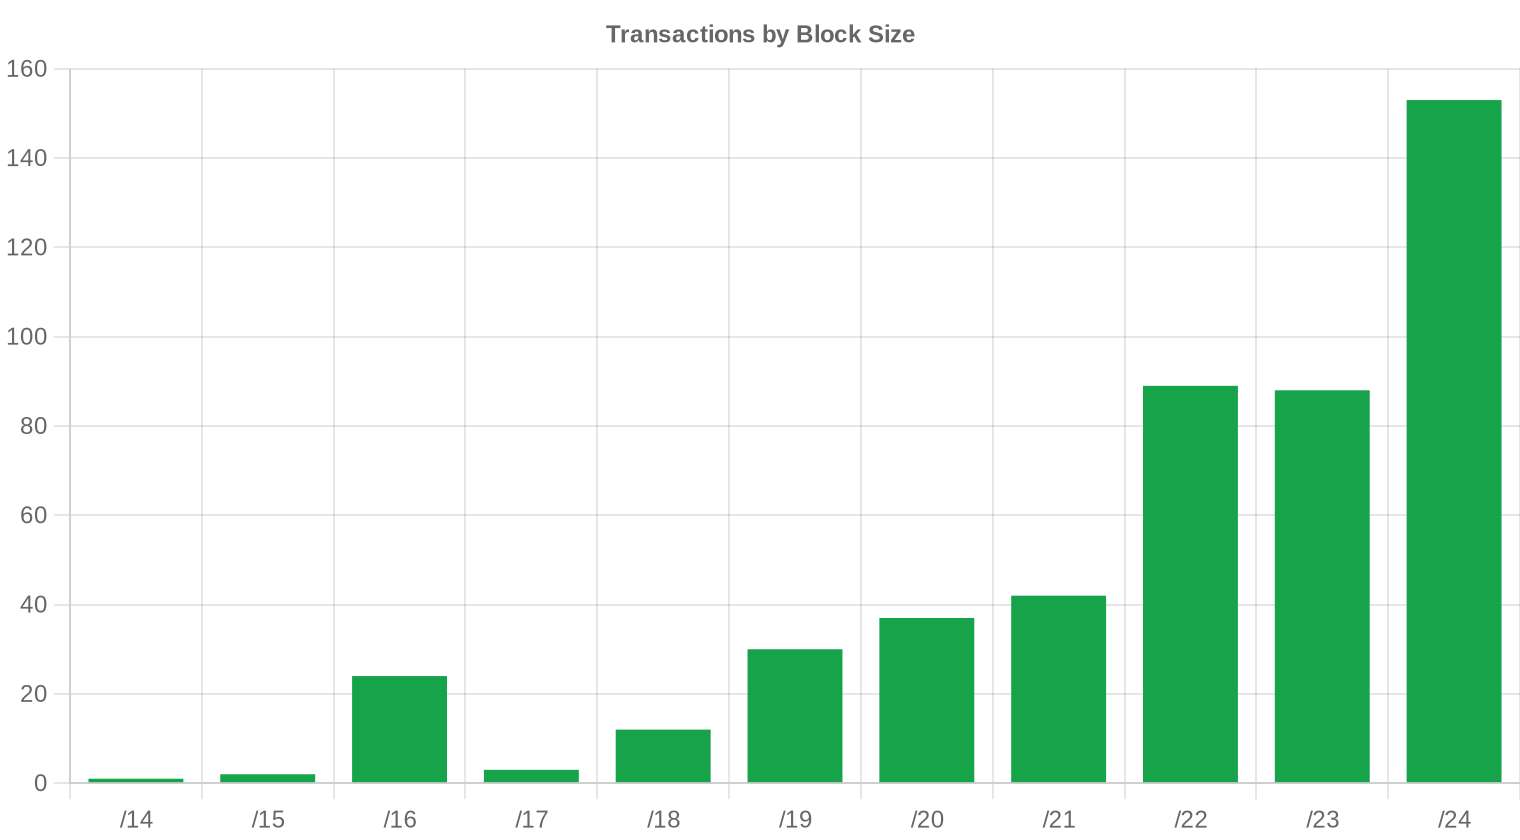
Geographic Activity
The United States led all markets with 16% of tracked deal activity, followed by Canada and the United Kingdom at 3% each. Bulgaria, Russia, Germany, and Italy each registered activity, reflecting the European secondary market's fragmentation across smaller national buyers. The US-Canada corridor remains the backbone of ARIN transfer volume, while UK activity ties directly into RIPE's transfer framework.Registry Transfer Activity
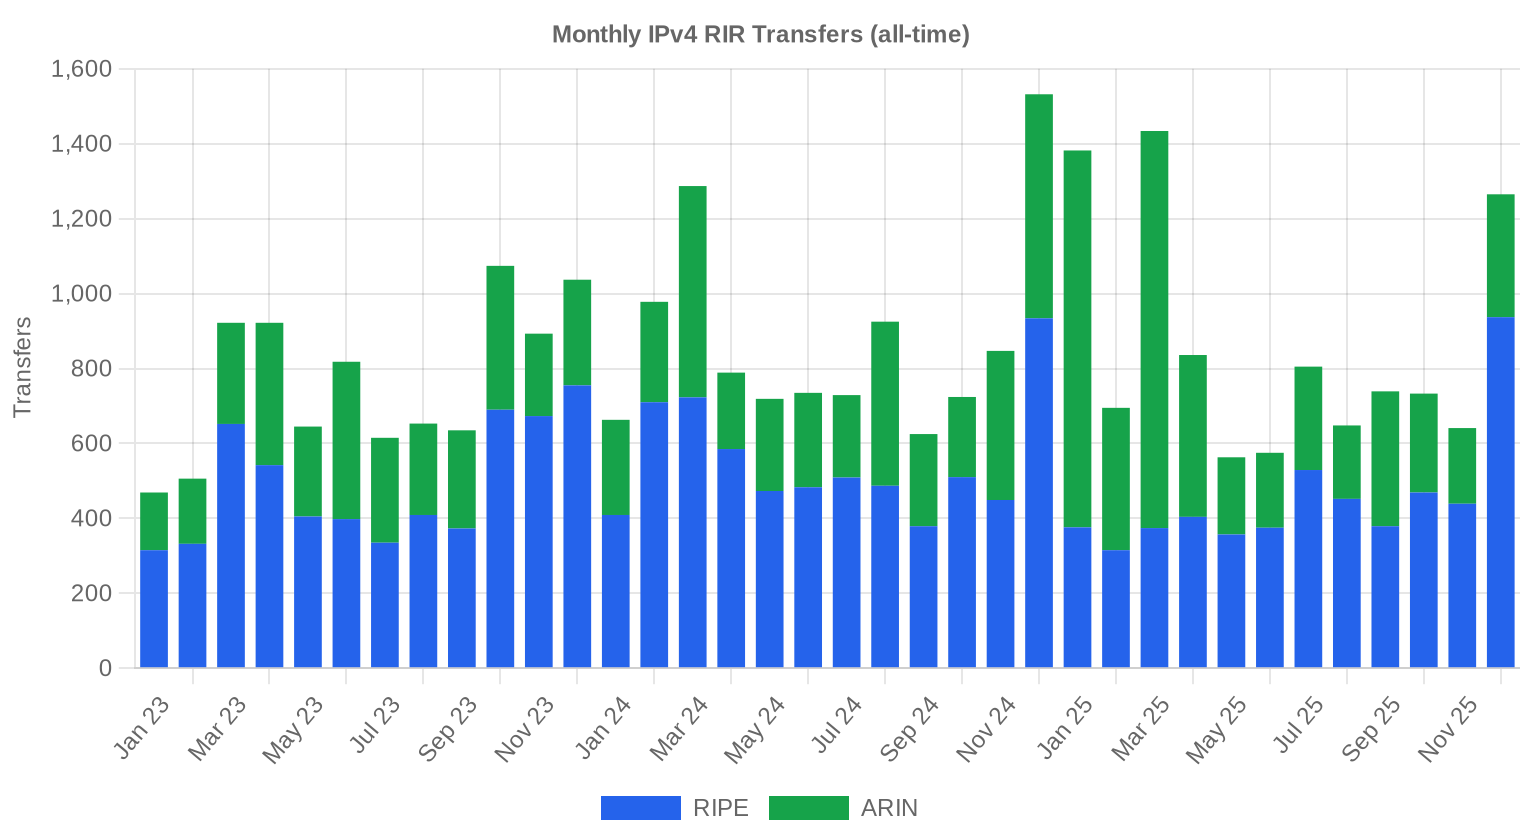
RIR-recorded transfers totaled 4,831 for the period, with RIPE leading at 3,205 transfers — roughly two-thirds of all registry-level activity. ARIN logged 1,626 transfers. The gap between RIPE's transfer count and ARIN's is striking given that ARIN moved more IP addresses by volume, which tells you RIPE's market is structurally composed of smaller blocks changing hands more frequently.Long-Run Transfer Trends
Over the trailing 36 months, cumulative transfers across all registries reached 30,058. The peak month was December 2024, which aligns with the year-end tax-driven selling pattern we've seen in prior cycles — holders booking capital gains or losses before fiscal close. RIPE accounts for 59.7% of the three-year transfer total versus ARIN's 40.3%, with APNIC, LACNIC, and AFRINIC contributing zero to the tracked transfer pipeline.| RIR | RIR Transfers |
|---|---|
| RIPE | 17,936 |
| ARIN | 12,122 |
| RIR Transfers | 30,058 |
Outlook & Forecast
Forecasting each block-size band and RIR separately with our AI model:
The overall average price per IP is projected to reach $19.88 by December 2025, with a next-month estimate of $21.75 per IP.
- RIPE: projected at $21.00 per IP next month, trending toward $18.50 by December 2025.
- ARIN: projected at $21.50 per IP next month, trending toward $19.00 by December 2025.
- APNIC: projected at $25.00 per IP next month, trending toward $23.00 by December 2025.
- LACNIC: projected at $29.50 per IP next month, trending toward $28.50 by December 2025.
- AFRINIC: insufficient data for a reliable forecast.
Forecast by Block Size
| Block | Current $/IP | Next Month | Year-End | Confidence |
|---|---|---|---|---|
| /24 | $25.00 | $25.00 (0.0%) | $23.00 (-8.0%) | medium |
| /23 | $21.35 | $22.00 (+3.0%) | $20.00 (-6.3%) | medium |
| /22 | $20.88 | $21.00 (+0.6%) | $19.00 (-9.0%) | medium |
| /21 | $20.50 | $20.50 (0.0%) | $18.50 (-9.8%) | medium |
| /20 | $25.00 | $21.50 (-14.0%) | $20.00 (-20.0%) | low |
| /19 | $17.50 | $17.00 (-2.9%) | $15.50 (-11.4%) | medium |
| /18-/16 | $12.75 | $13.00 (+2.0%) | $12.00 (-5.9%) | low |
| /15-up | $11.63 | $11.50 (-1.1%) | $10.50 (-9.7%) | low |
Editor's Take: Buy vs. Lease
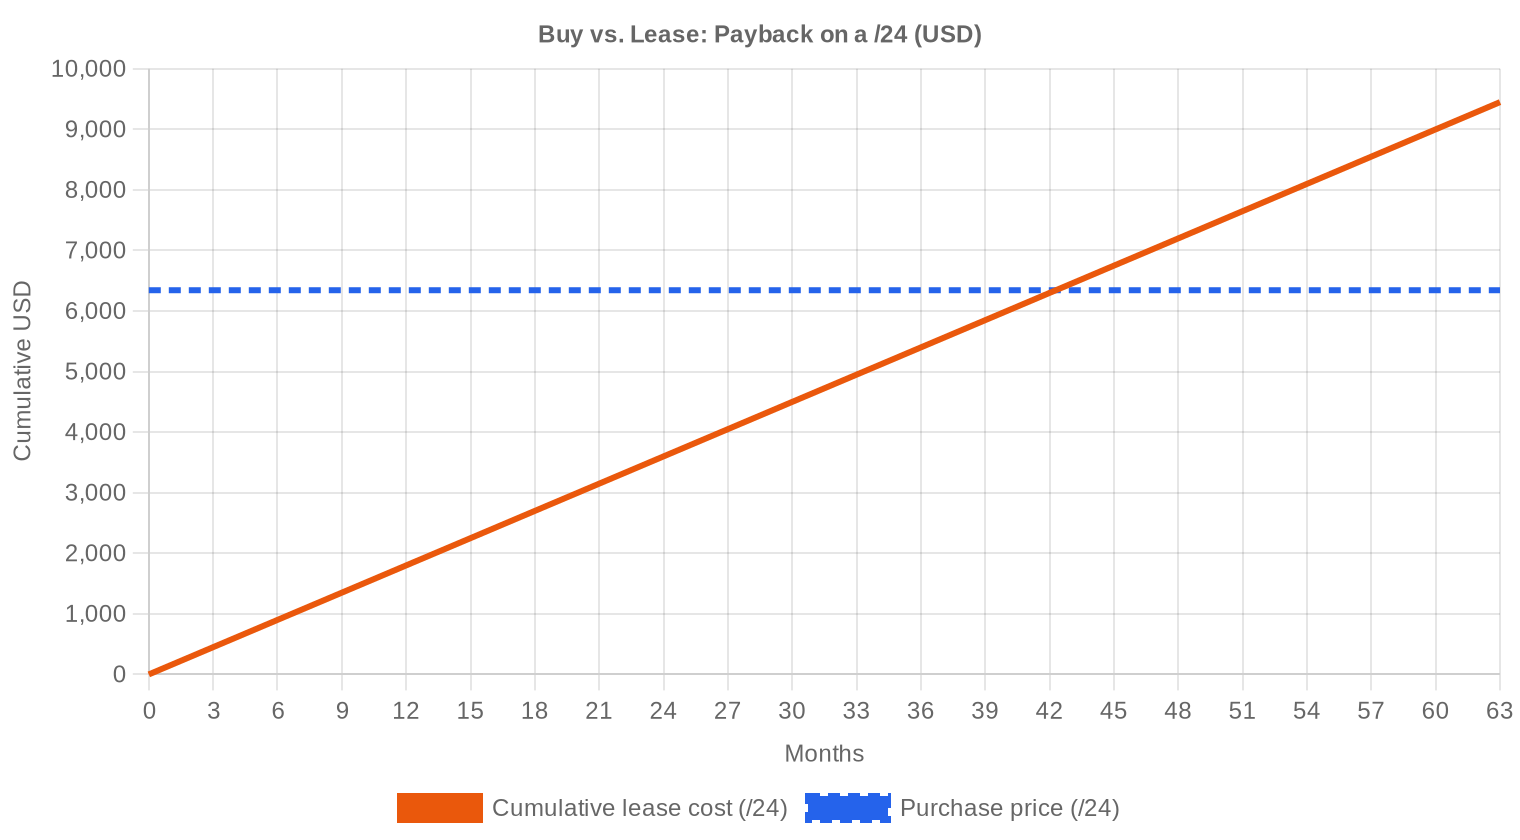
The buy-versus-lease calculus has never been more straightforward. At $24.78/IP purchase and $0.5859/IP monthly lease, the payback period on a buy is 42.3 months — about 3.5 years. That's well inside the useful life of most IPv4 deployments. The implied annual yield on leased-out space is 28.4%, which makes IPv4 one of the highest-yielding infrastructure assets available. Our verdict: buy. If you're currently leasing and expect to need addresses beyond mid-2028, purchasing at today's levels locks in value even if prices drift another 15–20% lower. For holders considering a sale, the declining price trajectory argues against waiting unless you have a specific catalyst in mind. The market is not rewarding patience right now.| /24 Purchase price | $6,344 |
| /24 Lease price | $150 / mo |
| Payback period | 42.3 mo (3.5 yr) |
| Gross annual yield | 28.4% |
What This Means for You
Buyers: You're operating in the most favorable purchasing environment since 2019. Average prices are down 25% year-over-year and the forecast points lower still. If you need addresses for a multi-year deployment, the case for buying now rather than leasing is strong — payback comes in under 3.5 years at current lease rates. Don't chase the absolute bottom; the opportunity cost of waiting exceeds the likely further discount.Sellers: The trend is working against you. Every quarter of delay has cost roughly 5–8% in realized value over the past year. If you're holding legacy space you don't need, a structured sale now captures meaningful value versus a 2026 price environment that our models put closer to $20/IP. Consider partial sales — monetize what you can while retaining a strategic reserve.
Leasers: At $0.59/IP/month, leasing remains viable for short-term or elastic demand. But the crossover point is 42 months. Any deployment with a time horizon beyond 2028 should be evaluating purchase economics seriously.
Block Holders: The 28.4% annual yield on leased space is exceptional, but it depends on occupancy and the lease rate holding steady. As purchase prices fall, expect downward pressure on lease rates within 6–12 months. Locking in longer-term lease agreements now preserves that yield advantage.
Browse verified IPv4 blocksSell IPv4 →
List your blocks with managed transferLease IPv4 →
Flexible short-term capacityLease Out IPv4 →
Turn idle blocks into recurring revenue
IPv4 Pricing by Block Size
Small blocks carry the usual per-IP premium. A /24 (256 IPs) at the median price costs roughly $6,400, while scaling up to a /16 (65,536 IPs) brings the per-IP cost down toward the $20–$22 range for clean ARIN blocks. The premium for /24s runs 15–25% above the per-IP cost of /20 and larger blocks, reflecting the convenience factor and the reality that most buyers don't need — or can't justify — a larger allocation.| Block | IPs | Buy: /IP | Buy: Total | Lease: /IP/mo | Lease: Monthly |
|---|---|---|---|---|---|
| /24 | 256 | $35–45 | $8,960–11,520 | $0.38–0.50 | $97–128 |
| /22 | 1,024 | $28–38 | $28,672–38,912 | $0.33–0.45 | $338–461 |
| /20 | 4,096 | $22–32 | $90,112–131,072 | $0.30–0.40 | $1,229–1,638 |
| /18 | 16,384 | $20–30 | $327,680–491,520 | $0.30–0.38 | $4,915–6,226 |
| /16 | 65,536 | $18–28 | $1,179,648–1,835,008 | $0.30–0.35 | $19,661–22,938 |
IPv4 Price History: 2011–2026
IPv4 addresses first acquired monetary value after IANA pool exhaustion in 2011, with early transactions in the $5–$7/IP range. Prices climbed steadily through the 2010s, accelerating sharply during 2021–2022 when pandemic-driven digitization and cloud migration pushed averages above $50/IP at the peak. AWS's February 2024 decision to charge $0.005/hour for public IPv4 addresses triggered a wave of address returns and secondary-market selling that broke the price uptrend. We're now 18 months into that correction, with prices down roughly 50% from peak levels and approaching the upper bound of 2019 valuations.| Year | ~Price/IP | Key Event |
|---|---|---|
| 2011 | $7–12 | IANA free pool exhausted; Microsoft/Nortel deal ($11.25/IP) |
| 2012 | $8–12 | RIPE NCC reaches last /8; begins /22-only allocation |
| 2014 | $10–15 | LACNIC free pool exhausted |
| 2015 | $8–15 | ARIN free pool exhausted |
| 2017–18 | $12–18 | Leasing market grows; cloud demand rises |
| 2019 | $18–24 | RIPE NCC exhausts remaining free pool |
| 2021–22 | $50–60+ | Post-pandemic peak; hyperscaler build-outs |
| 2024 | $35–52 | AWS IPv4 charge ($0.005/IP/hr); large block correction |
| 2025–26 | $18–45 | Market bifurcation; /16s below $20 for first time since 2019 |
Market Structure: Who Is Buying & Selling
The buyer side is increasingly dominated by mid-tier ISPs, regional cloud providers, and hosting companies — organizations too small to qualify for large RIR allocations but too dependent on IPv4 to go without. Hyperscalers have largely stepped back from active purchasing, having built sufficient reserves or pivoted to IPv6 internally. The sell side features legacy corporate holders finally monetizing unused allocations, bankruptcy estates, and some early speculators who bought in 2020–2021 and are now exiting at a loss.IPv4 vs. Other Asset Classes
At a 28.4% annualized yield (based on current lease rates against purchase price), IPv4 addresses outperform virtually every traditional asset class. US investment-grade corporates yield 5–6%. Residential real estate cap rates run 4–7% in most markets. Even private credit, the darling of 2024–2025 alternatives allocations, rarely exceeds 12–14%. The catch is liquidity risk and the secular decline in underlying asset value — IPv4 is a depleting asset class, not a perpetuity, and the terminal value question remains open.| Asset Class | Typical Yield | Liquidity | Primary Risk |
|---|---|---|---|
| IPv4 | 28.4% | Moderate | IPv6 adoption, block quality |
| Commercial Real Estate | 5–8% | Low | Vacancy, rate cycle |
| Investment-Grade Bonds | 4–5% | High | Duration, credit risk |
| S&P 500 | ~1,3% | High | Market volatility |
| Money Market / T-Bills | ~4–5% | High | Rate cycle changes |
IPv6 Adoption & Why IPv4 Remains Essential
IPv6 adoption continues its glacial advance. Google's measurements show roughly 45% of traffic reaching its services over IPv6, but enterprise and SMB adoption lags well behind consumer ISP networks. The practical reality hasn't changed: any service that needs to be universally reachable still requires IPv4 connectivity, and that will remain true for at least another 5–7 years. Dual-stack is the operational norm, and that means sustained demand for IPv4 even as new deployments increasingly prefer IPv6 where possible.AI & Cloud Infrastructure Demand
AI infrastructure buildout is a double-edged factor in the IPv4 market. Training clusters and inference farms consume massive amounts of compute but relatively modest amounts of public IP space — most GPU-to-GPU traffic runs over private fabrics. Where AI does drive IPv4 demand is at the edge: API endpoints, model-serving infrastructure, and the proliferation of AI-powered SaaS products that each need routable addresses. This is incremental demand, not transformational, but it provides a floor under certain block sizes.What Determines IPv4 Block Value
Block valuation depends on five variables, roughly in order of importance: blacklist/reputation cleanliness, RIR region, block size, allocation vintage, and transfer complexity. A clean /22 in RIPE with no spam history and a straightforward transfer path commands 10–15% above a comparable ARIN block with legacy routing entries and a spotty Spamhaus record. Older allocations from established holders generally fetch better prices because buyers associate longevity with cleanliness — a heuristic that's usually but not always correct.Sell vs. Lease: A Decision Framework
In a declining price environment, selling makes sense for holders who don't want to manage tenant relationships or who need lump-sum capital. Leasing is the play for holders with operational capacity to manage assignments and who believe the 28.4% annual yield compensates for the 20%+ annual price erosion. The math currently favors leasing for holders who can maintain high occupancy — but that window narrows every quarter as purchase prices drop and lease rates follow.| /24 Purchase price | $6,344 |
| /24 Lease price | $150 / mo |
| Payback period | 42.3 mo (3.5 yr) |
| Gross annual yield | 28.4% |
RIPE NCC 24-Month Transfer Restriction
RIPE's 24-month holding period before re-transfer continues to function as a supply governor. It prevents rapid flipping, which stabilizes prices on the RIPE side — note the tighter $13–$33 range versus ARIN's $11–$45. But it also creates a delayed supply effect: blocks acquired during the 2022–2023 price peak are now becoming transferable, and their holders are staring at 40–50% unrealized losses. Expect some of this supply to hit the market in early 2026 as the holding period expires on peak-era purchases.Deal Size Distribution
Average deal size fell to $103,657, down 12.4% from H1's $118,333 and up 9.2% from H2 2024's $94,902. The bulk of activity by count — 330 deals — fell under $50,000, totaling just $4.3 million. The real dollar volume concentrated in the 27 deals above $1 million, which accounted for $52 million in aggregate value. The mid-market ($50K–$250K) contributed 109 deals and $12 million — a healthy layer of institutional activity that signals this isn't just a retail or mega-deal market.Top Trading Countries
The US dominates with 16% of tracked deal activity, which aligns with ARIN's volume leadership. Canada and the UK each contributed 3%, with Canada serving as ARIN's second-largest national market and the UK anchoring RIPE's English-speaking segment. The long tail of European buyers — Bulgaria, Germany, Italy — reflects the fragmented nature of European ISP and hosting markets where hundreds of small operators each need modest address space.BEAD Broadband Program Impact
The $42.45 billion BEAD broadband program is entering its disbursement phase, and ISPs receiving BEAD funding will need IPv4 addresses for subscriber deployments — particularly in rural areas where IPv6-only isn't realistic given CPE constraints. This creates concentrated demand for /20 to /18 blocks among regional and rural ISPs, potentially tightening supply in those specific size ranges even as the broader market softens. We expect BEAD-related purchasing to become visible in market data by H1 2026 as grant recipients begin network buildout.Hyperscaler IPv4 Holdings
Amazon, Microsoft, and Google collectively hold an estimated 100+ million IPv4 addresses. Amazon's decision to charge for public IPv4 usage has been the single largest market-moving event of the past two years, triggering address returns that increased available supply across the ARIN region. Microsoft and Google have been quieter, but neither has been an active buyer in the secondary market for over a year. Their inactivity removes a major demand source and contributes to the pricing pressure sellers face today.Macroeconomic Conditions & Market Impact
Higher-for-longer interest rates have compressed enterprise IT capital budgets throughout 2025, pushing some buyers toward leasing over purchase — though the payback math still favors buying at current levels. Cloud cost optimization programs, which proliferated after the 2023 efficiency push, have freed up unused IPv4 space that's now returning to the secondary market. Broadly, the macro environment is deflationary for IPv4: tighter budgets on the demand side, freed-up supply from optimization, and no near-term catalyst for a price reversal.Model Update & Calibration
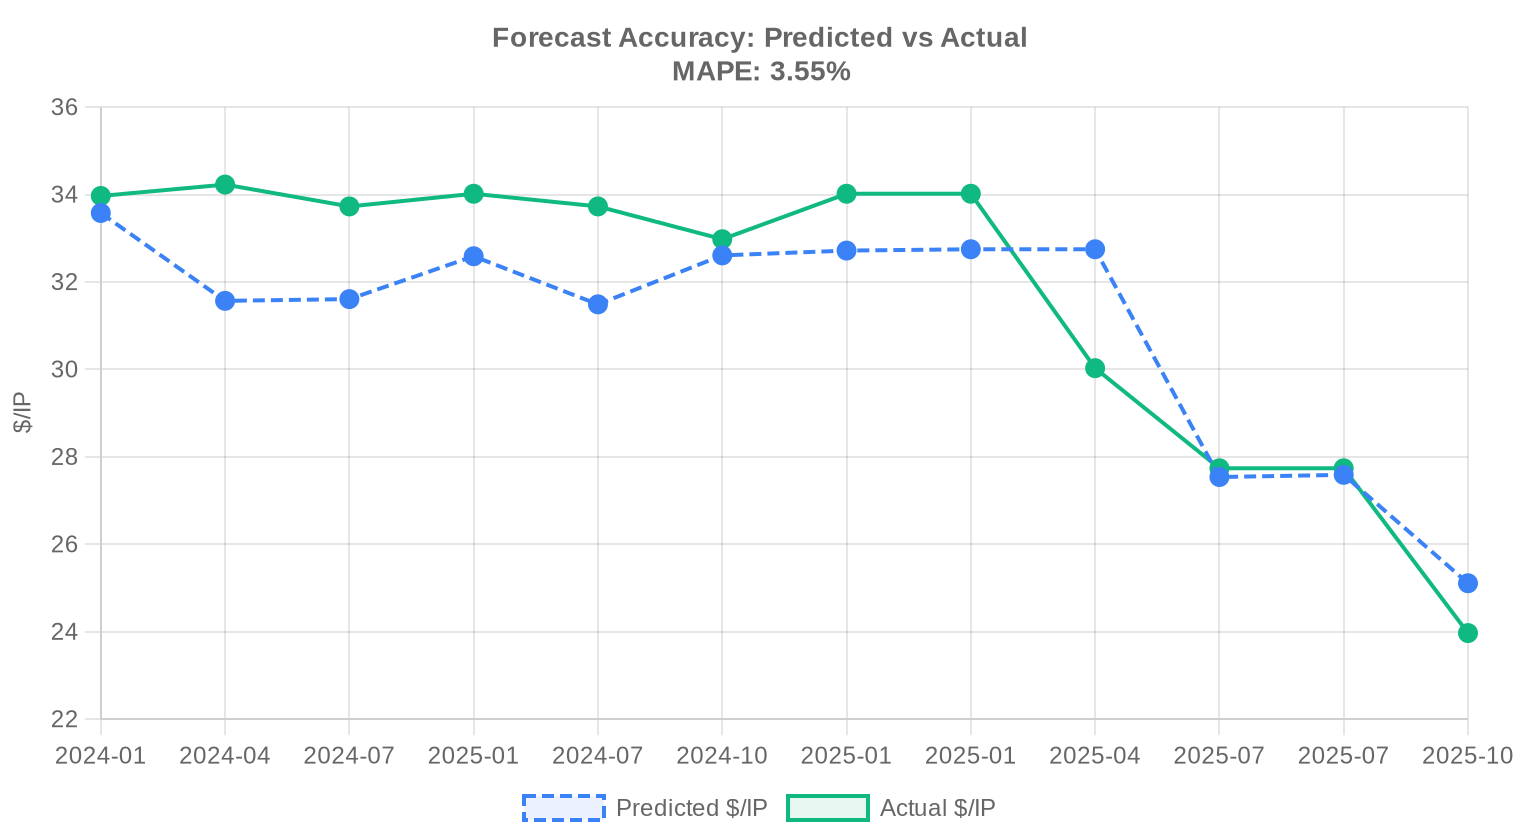
We reviewed our past projections against actual market outcomes and recalibrated the model for this report. The updated model places more weight on recent price movements using exponential decay, dynamically adjusts prediction bands to reflect current market conditions, and corrects for any systematic bias detected in earlier forecasts. The predicted-vs-actual comparison chart below shows how closely our past estimates tracked reality.
| Report Period | Target Month | Predicted | Actual | Deviation |
|---|---|---|---|---|
| 2024-H2 | 2025-01 | $33 | $34 | -4% |
| 2024-Q4 | 2025-01 | $33 | $34 | -4% |
| 2025-Q1 | 2025-04 | $33 | $30 | +9% |
| 2025-H1 | 2025-07 | $28 | $28 | -1% |
| 2025-Q2 | 2025-07 | $28 | $28 | -1% |
| 2025-Q3 | 2025-10 | $25 | $24 | +5% |
Methodology
Figures are based on completed IPv4Center marketplace transactions and RIR transfer statistics. Prices are in US dollars per IP address. Forecasts are produced by an AI model that analyses each block-size band and RIR segment separately (with outlier-trimmed medians) alongside known market catalysts; they are estimates, not guarantees.
Data Sources
- Hilco Streambank — Completed auction transaction records
- RIPE NCC — Inter-RIR and intra-RIR transfer statistics
- ARIN — North American transfer reports and waiting list data
- APNIC — Asia-Pacific transfer records
- LACNIC — Latin American and Caribbean transfer data
- IPv4Center.com — Proprietary marketplace transaction and lease pricing data
This report is generated automatically for informational purposes only and does not constitute financial advice.
Frequently Asked Questions
What was the average price per IPv4 address in H2 2025?
The market-wide average settled at .78 per address, with a median of .00. This represents a 9.64% decline from the prior period — the most decisive downward move the market has printed in some time.
How many transactions were recorded in the second half of 2025?
We tracked 481 priced transactions covering 3,050,752 addresses for an aggregate deal value of approximately .9 million. Average deal size was roughly 103,657 IPs per transaction, skewing heavily toward ARIN's larger block inventory.
Which RIR commanded the highest per-IP prices in H2 2025?
LACNIC space was the priciest at .22 per IP on average, with a tight range of .50–.00. The premium reflects chronic scarcity in the Latin American registry — only 16 transactions cleared the entire half.
Why is ARIN space trading at a discount to RIPE and APNIC this period?
ARIN averaged .01 versus .16 for RIPE and .31 for APNIC. The discount is largely a function of supply: ARIN accounted for 48.2% of all transaction volume and moved 2.3 million addresses — roughly 3.6× the volume of RIPE. More supply, softer pricing.
What is the price range buyers should expect for a /24 block right now?
At the current market average of .78 per IP, a /24 (256 addresses) runs about ,344. In practice, small-block premiums can push this higher — /24s were the most traded prefix size with 153 transactions — but the median suggests ,400 is a reasonable planning number.
Is the IPv4 market headed lower? What does the forecast say?
Our model — which we flag as reliable for this dataset — projects a next-month average of .75 and a year-end 2025 figure of .88. The trend is unambiguously down: the 9.64% decline this period appears structural rather than seasonal.
What mistakes should be avoided when buying IPv4 addresses in a declining market?
The cardinal sin is overpaying for urgency. With prices trending toward .88 by year-end, locking in a large block at + without negotiating aggressively is leaving money on the table. Buyers should also avoid ignoring RIR-specific pricing — ARIN blocks are clearing nearly /IP cheaper than APNIC. Finally, skipping reputation and blacklist checks on acquired space remains the fastest way to destroy value.
Should I buy or lease IPv4 addresses at current market rates?
Buy. At .5859/IP/month lease rates and a purchase price of .78, the breakeven crossover is 42.3 months — roughly 3.5 years. If your planning horizon exceeds that, ownership is the clear economic winner. The implied annual yield on purchased space leased back out is 28.4%, which tells you lessors are being compensated handsomely.
What are the risks of leasing IPv4 addresses instead of purchasing them?
You're renting a depreciating asset's utility at .03/IP annually while the asset itself costs .78 — a 28.4% implied yield flowing to the lessor. Beyond economics, lease arrangements carry counterparty risk, potential for mid-term repricing, and no residual value. In a down market, the buy-side math only gets more attractive.
How does the deal-size distribution break down in H2 2025?
The market is barbell-shaped. Small deals under K dominate by count (330 of 481 transactions) but represent only .3 million in value. Meanwhile, 27 deals above million accounted for million — more than the entire reported market total, reflecting some very large block trades. The institutional bid is clearly present.
What happened to AFRINIC transfer activity this period?
Zero. No priced transactions, no recorded transfers. AFRINIC remains effectively frozen as a commercial transfer market, a consequence of ongoing governance challenges and policy uncertainty within the registry.
Which countries were the most active buyers and sellers in H2 2025?
The US dominated with 16 observed country-tagged transactions, followed by Canada and the UK at 3 each. Bulgaria, Russia, Germany, and Italy each appeared once. The transatlantic axis — US, CA, GB — continues to drive the overwhelming majority of deal flow.
How does RIPE transfer volume compare to ARIN's in H2 2025?
RIPE recorded 3,205 total transfers versus ARIN's 1,626 — nearly double. However, ARIN moved far more IPs in priced transactions (2.3 million vs. 644K for RIPE). RIPE's market is characterized by more frequent, smaller transfers; ARIN's by fewer but significantly larger blocks.
What was the most commonly traded block size?
The /24 was the workhorse, with 153 transactions — roughly a third of all deals. This is unsurprising: /24 is the minimum globally routable prefix size and serves as the entry-level unit for organizations needing independent address space.
What risks should sellers be aware of in the current down-trending market?
The forecast points to .88 by December 2025 — roughly 20% below the current average of .78. Sellers sitting on inventory with a cost basis above should seriously evaluate accelerating disposition timelines. Holding into a weakening market to chase the last dollar of H1 pricing is a strategy that tends to end poorly.
Is IPv6 adoption finally killing the IPv4 market?
Not killing, but compressing. The 9.64% price decline and downward forecast suggest IPv6 deployment — combined with CGN improvements and cloud-native architectures — is eroding incremental IPv4 demand at the margin. That said, 481 transactions and .9 million in volume confirm this market is far from dead. Think slow fade, not cliff.
How long does a typical IPv4 transfer take to complete?
Timelines vary by RIR. ARIN transfers typically close in 2–4 weeks once both parties have filed the requisite documentation. RIPE transfers can be faster — often 1–2 weeks — given more streamlined policy. LACNIC and APNIC transfers tend toward the longer end due to smaller broker networks and additional compliance steps.
Why did the APNIC market only produce 33 transactions in H2 2025?
APNIC's secondary market has always been thinner relative to ARIN and RIPE. Tight holding patterns among Asian incumbents, regulatory complexity in several APNIC economies, and strong domestic leasing preferences all suppress open-market deal flow. Still, APNIC's .31 average — a .30 premium to ARIN — confirms demand outstrips available supply.
What is the maximum price per IP observed this period, and in which RIR?
The high-water mark was /IP, recorded in an ARIN transaction. This is likely a small, clean /24 with pristine reputation — the kind of block that commands scarcity pricing even in a softening market. RIPE's maximum was a more modest , and LACNIC topped out at .
What drove the 9.64% price decline in H2 2025?
Three converging forces: continued IPv6 migration by hyperscalers reducing net-new IPv4 demand, a steady release of legacy blocks by enterprises monetizing dormant assets, and institutional holders accelerating disposition ahead of further anticipated declines. The supply-demand balance has meaningfully shifted.
Are large block purchases (>/16) still available, and at what premium or discount?
They're available, primarily through ARIN, which moved 2.3 million IPs this period. Large blocks typically trade at a per-IP discount to /24s — ARIN's .01 average versus its maximum illustrates the range. The 27 transactions exceeding million in value confirm institutional-scale blocks are clearing regularly.
What does the 4,831 total transfer count tell us about market activity versus priced transactions?
Only 481 of 4,831 recorded transfers (roughly 10%) had pricing data attached. The gap reflects intra-organizational moves, RIR policy compliance transfers, and privately negotiated deals where pricing is not disclosed. The visible market is the tip of a much larger iceberg.
What are the risks of buying IPv4 addresses at .78 if the year-end forecast is .88?
You're looking at roughly 20% mark-to-market depreciation risk over six months if the forecast holds. For buyers with immediate operational need, the cost is justified — but purely speculative purchases at current levels carry meaningful downside. Dollar-cost averaging or phased procurement is a prudent hedge.
How do current lease rates compare to the cost of ownership?
RIPE-based leases are running .5859/IP/month, or about 0/month for a /24. At a purchase price of ,344 per /24, that lease rate implies a 28.4% annualized yield to the owner. Put differently: a lessee pays the equivalent of the block's full purchase price every 3.5 years. The economics strongly favor ownership for any organization with a multi-year horizon.
Should I wait for prices to fall further before buying?
That depends on whether you're an operator or a speculator. If you need addresses to run infrastructure, the cost of delay — renumbering risk, project timelines, compliance deadlines — usually exceeds the savings from timing the market. If you're purely financial, the forecast to .88 argues for patience, but forecasts are not guarantees.