15 min read
This report analyzes the IPv4 transfer market for Q4 2025, based on completed IPv4Center marketplace transactions and official RIR transfer records.
Executive Summary
The IPv4 transfer market closed Q4 2025 at a weighted average of $23.16 per address across 235 recorded transactions covering 1,659,392 IPs — a total market value of $24.5 million for the quarter. Pricing fell 12% from Q3 2025 and a striking 29.5% from Q4 2024, when the average stood near $32.85. Transaction volume dipped 4.5% quarter-over-quarter, suggesting not just lower prices but softening demand. The median price of $23.00 tracked closely to the average, indicating a relatively tight distribution around the center despite a wide $11–$35 range. This is the steepest annual decline we've tracked in recent years, and the data now suggests we've moved from cyclical softness into a structural repricing of IPv4 as an asset.Market Overview
| Transactions | 235 |
| IP Addresses Traded | 1,659,392 |
| Estimated Market Value | $24,532,065 |
| Average Price / IP | $23.16 |
| Median Price / IP | $23.00 |
| RIR Transfers | 2,639 |
Year-over-Year Comparison
| Metric | This period | A year earlier (Q4 2024) | Change |
|---|---|---|---|
| Transactions | 235 | 255 | -7.8% |
| IP Addresses Traded | 1,659,392 | 837,888 | +98.0% |
| Estimated Market Value | $24,532,065 | $27,582,021 | -11.1% |
| Average Price / IP | $23.16 | $32.85 | -29.5% |
| RIR Transfers | 2,639 | 3,103 | -15.0% |
Price Dynamics
The per-IP range stretched from $11 on the low end to $35 at the top, a $24 spread driven primarily by block size, RIR region, and block cleanliness. The floor has clearly dropped — $11 transactions were almost unheard of a year ago and signal distressed or heavily-flagged inventory entering the market. Average pricing at $23.16 is down $3.16 from Q3's level, a 12% sequential decline that mirrors the regression trend we've been flagging since mid-year. Sellers who anchored to $28–$30 asking prices in early 2025 are now facing a market that simply won't clear at those levels for standard ARIN and RIPE blocks. The compression between median ($23.00) and average ($23.16) tells us outliers aren't distorting the picture — the whole curve has shifted lower.
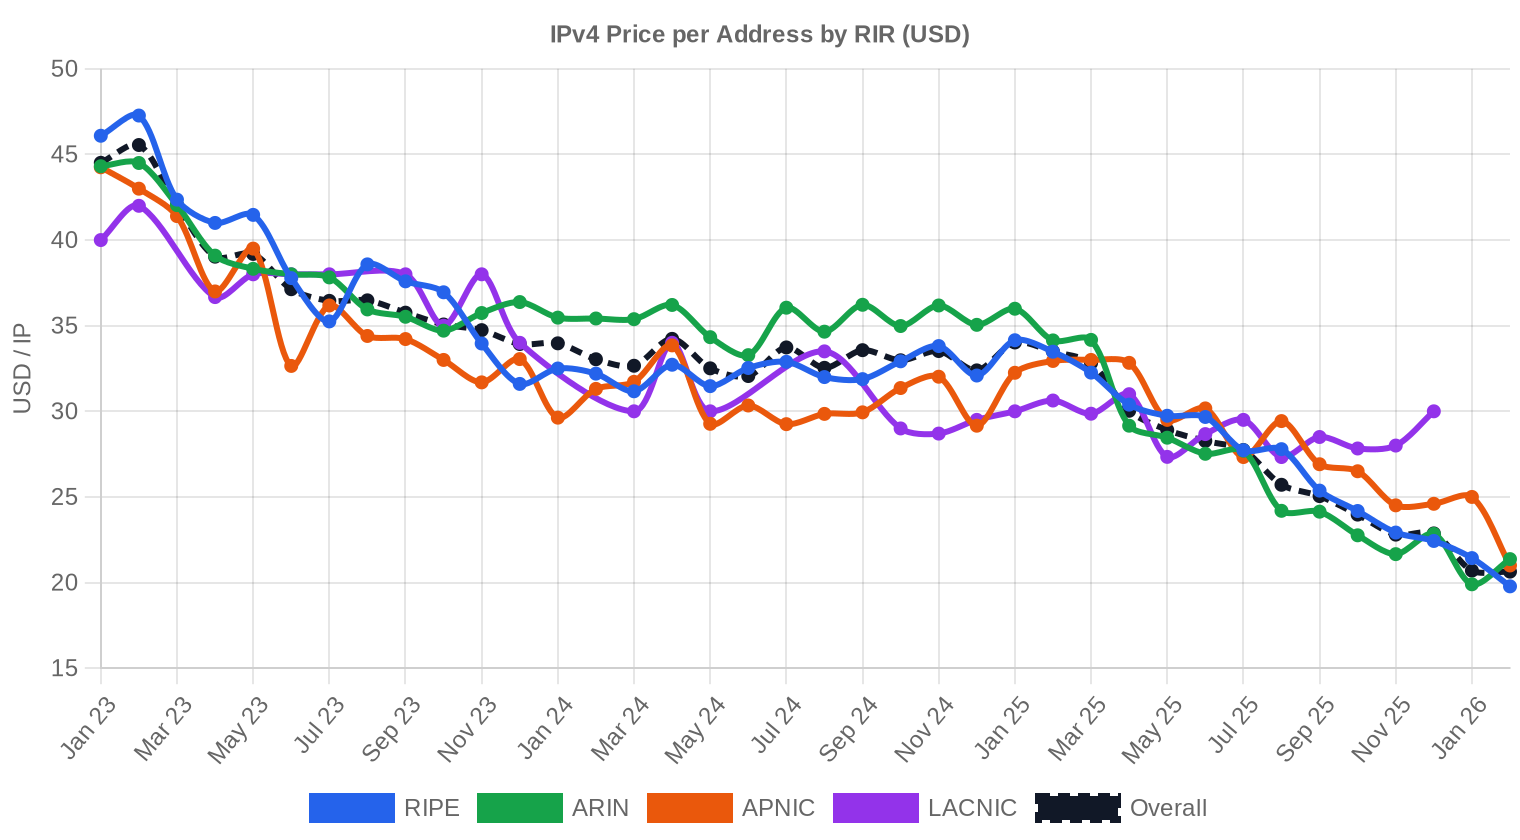
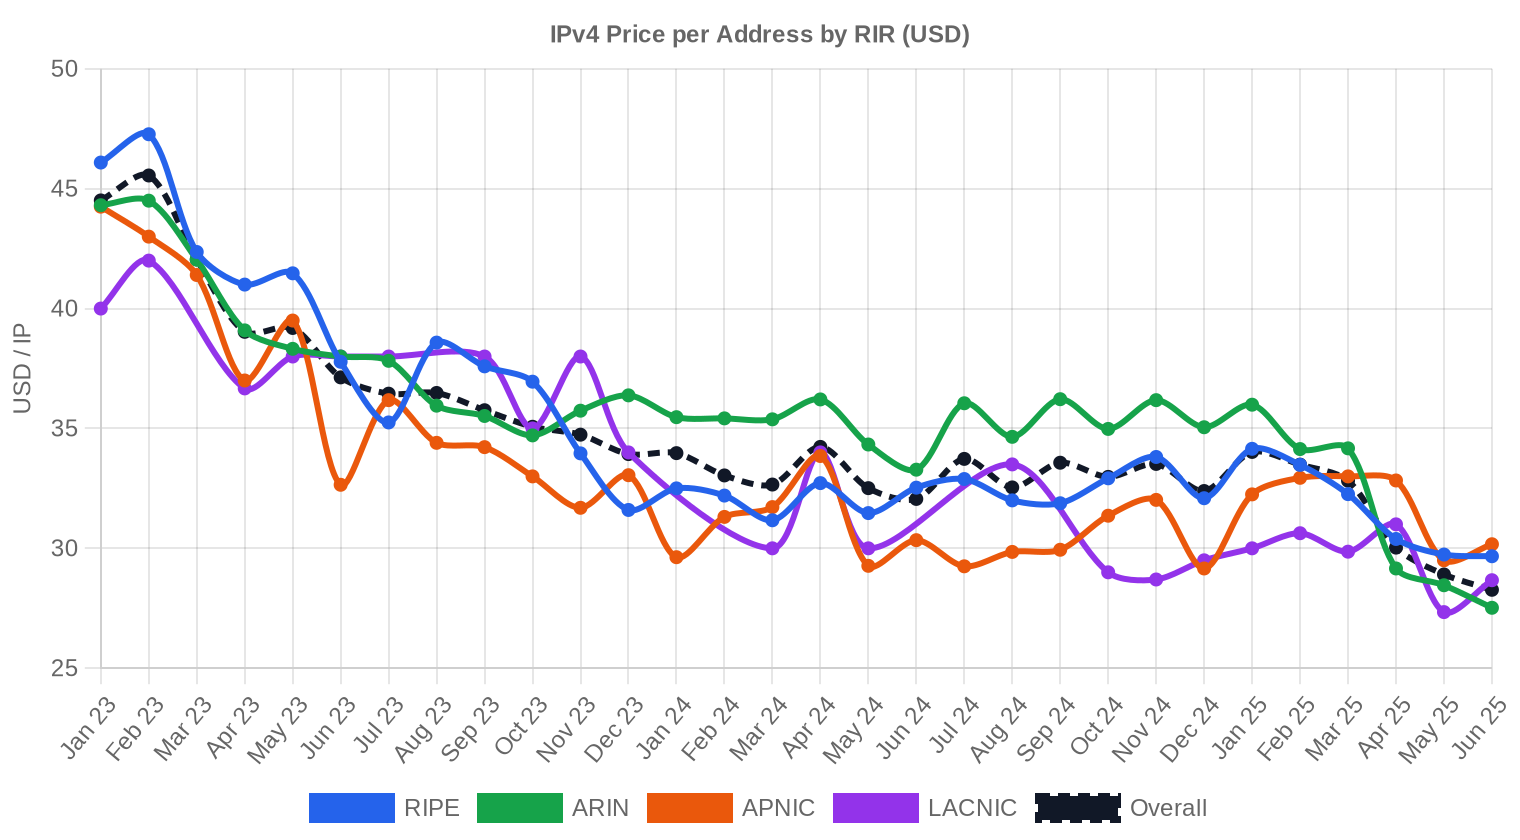
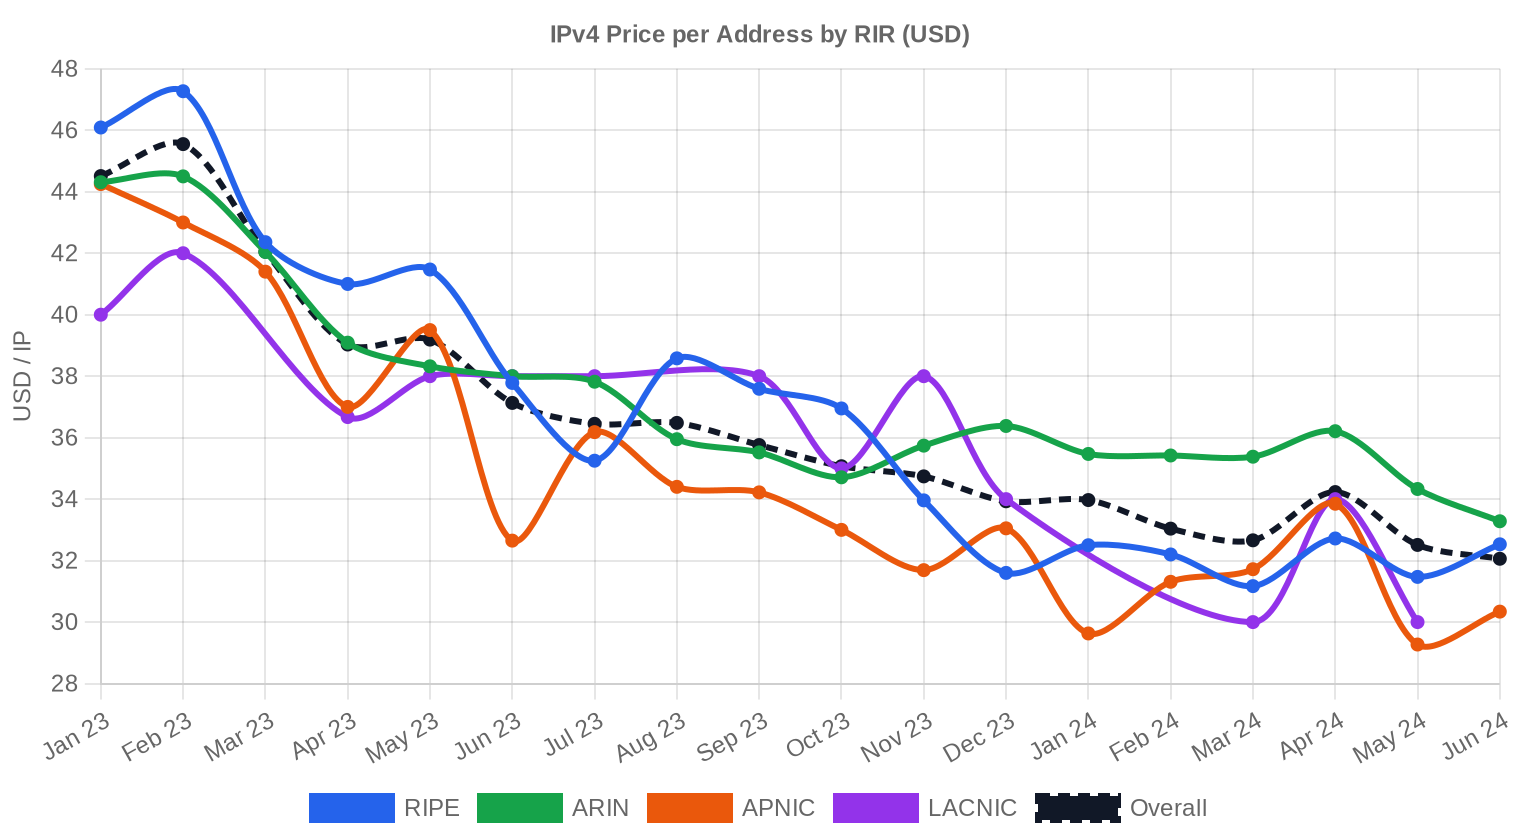
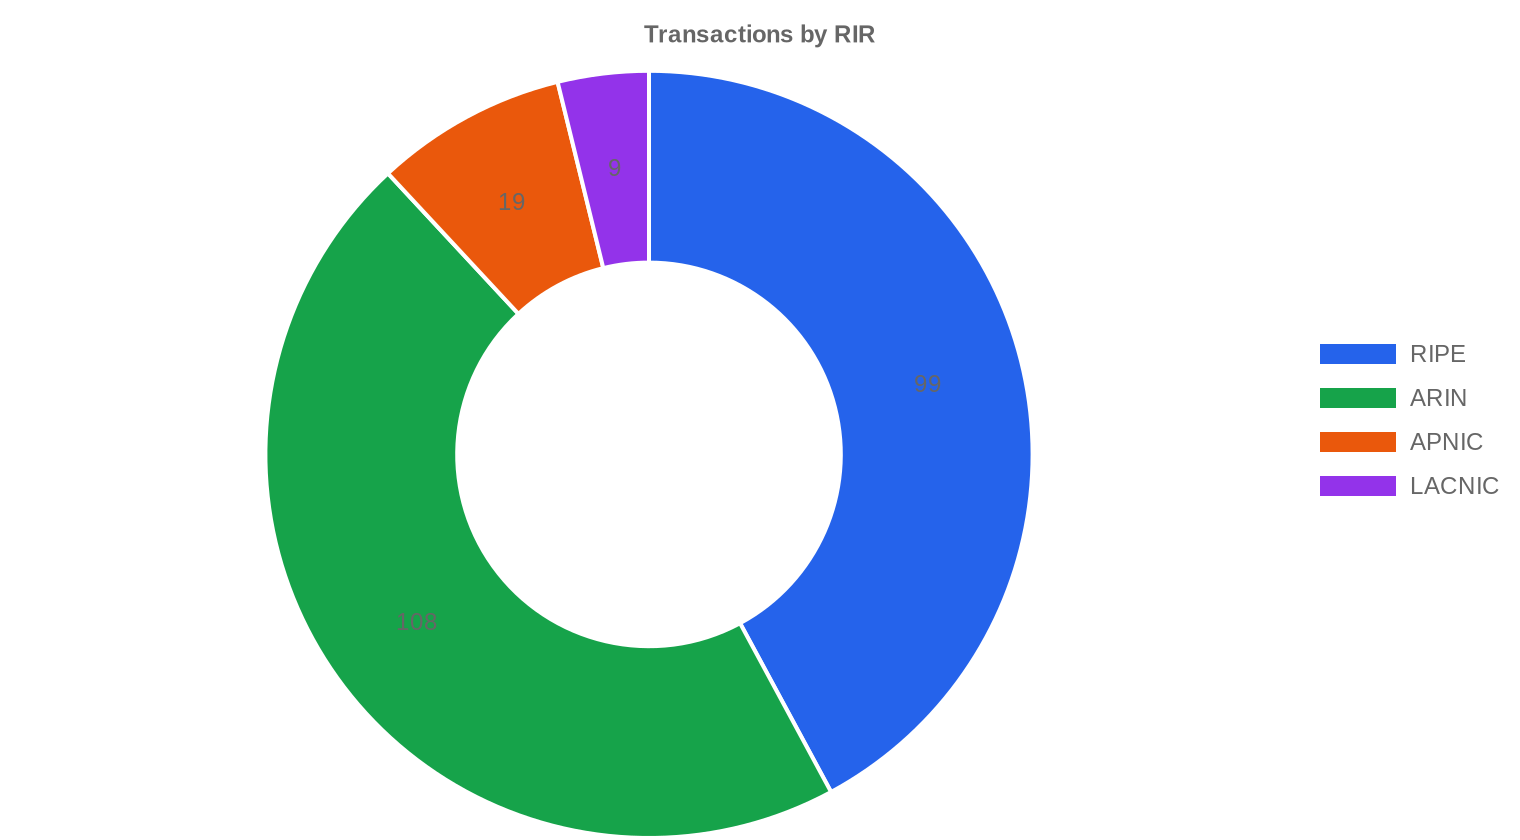
Pricing by RIR
ARIN dominated transaction volume at 46% of the market with 108 deals, but its average price of $22.41 was the lowest among active registries. RIPE came in nearly identical at $23.12 across 99 transactions — the convergence between these two regions is now almost complete, with less than $0.71 separating them. That gap was $3–$4 just eighteen months ago. LACNIC continues to command a scarcity premium at $28.17 per IP, though only 9 transactions make that sample thin. APNIC sits in between at $25.27 across 19 deals, reflecting persistent demand from Asian network operators.ARIN: $22.41/IP across 108 transactions (46% of volume).
RIPE NCC: $23.12/IP across 99 transactions (20% of volume).
APNIC: $25.27/IP across 19 transactions (1.6% of volume).
LACNIC: $28.17/IP across 9 transactions (2.4% of volume).
AFRINIC: No recorded transactions this quarter.
| RIR | Transactions | Avg $/IP | Median $/IP | IPs Traded | RIR Transfers | Next Month (proj.) | Year-End (proj.) |
|---|---|---|---|---|---|---|---|
| RIPE | 99 | $23.12 | $22.45 | 332,800 | 1,845 | $21.00 | $18.50 |
| ARIN | 108 | $22.41 | $22.00 | 1,260,544 | 794 | $21.50 | $19.00 |
| APNIC | 19 | $25.27 | $25.50 | 26,880 | 0 | $25.00 | $23.00 |
| LACNIC | 9 | $28.17 | $28.00 | 39,168 | 0 | $29.50 | $28.00 |
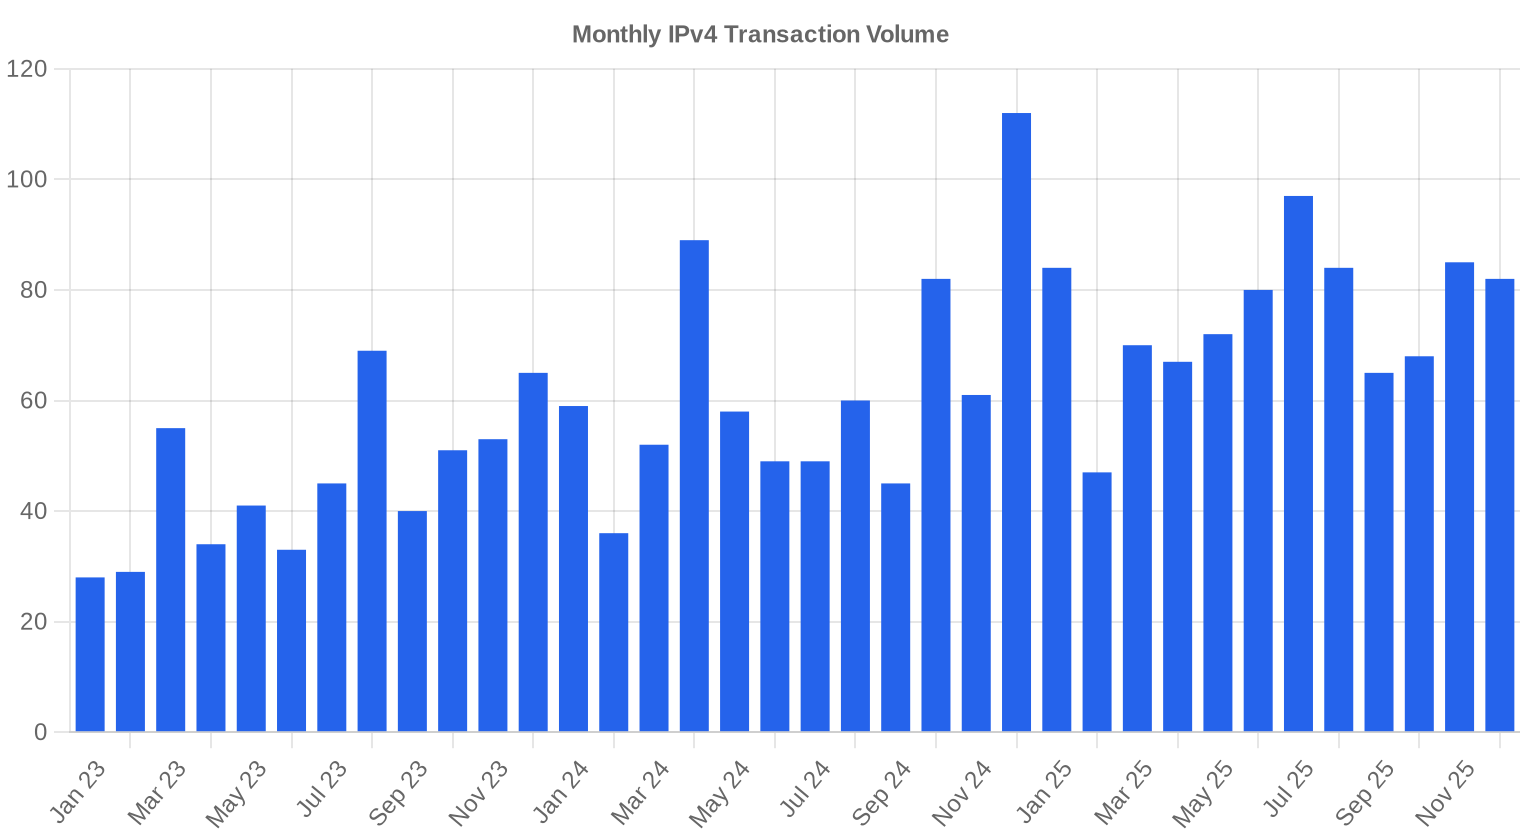
Transaction Volume
Supply & Block Sizes
The /24 block remained the most actively traded prefix size with 68 transactions, representing 29% of all deals. Small blocks continue to attract buyers who need just enough space for a specific deployment — a content node, a VPN endpoint cluster, a branch office NAT pool. Larger blocks (/16 and above) accounted for the bulk of dollar volume, with 14 deals exceeding $1 million generating $27.3 million in aggregate value, dwarfing the 177 sub-$50K transactions that totaled just $2.76 million.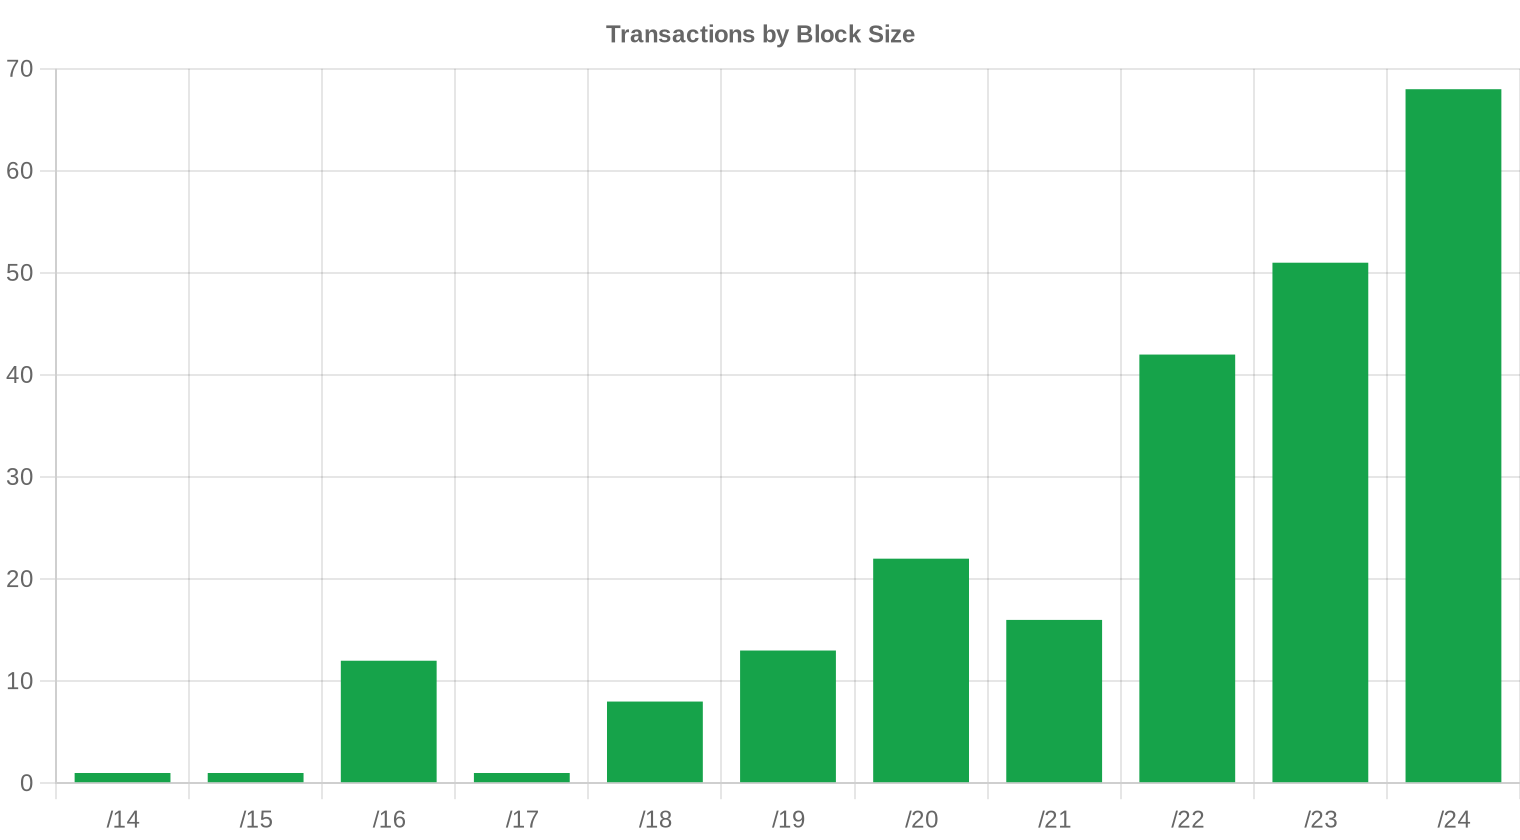
Geographic Activity
The United States led all markets with 16 tracked transactions, followed by Canada and Great Britain at 3 each. The buyer-side concentration in North America reflects both the ARIN volume dominance and the ongoing buildout of US-based infrastructure. European activity was distributed across the UK, Germany, Italy, and Bulgaria, consistent with RIPE's broad but fragmented buyer base.Registry Transfer Activity
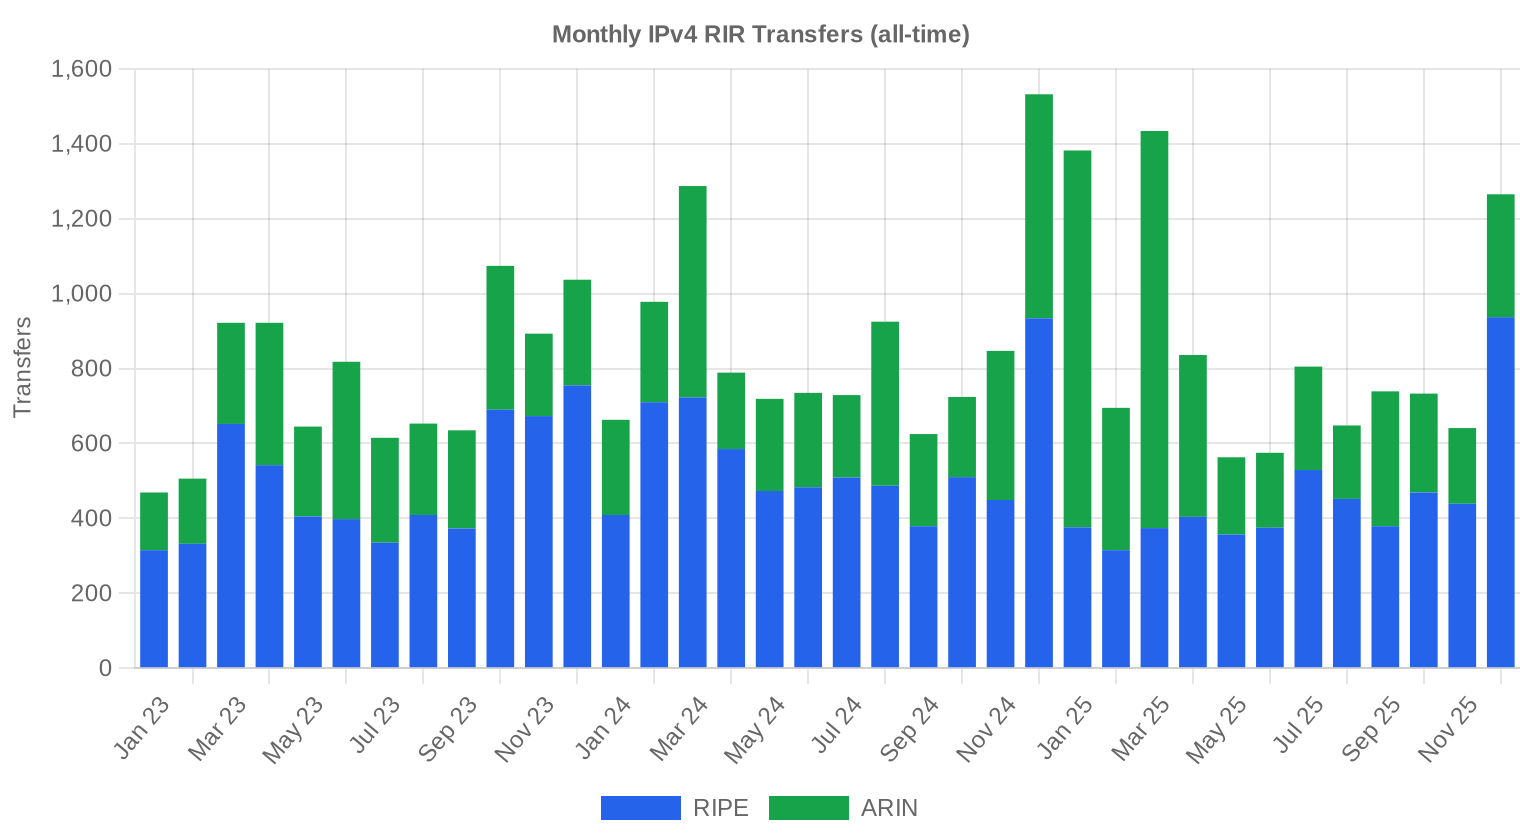
RIR-recorded transfers totaled 2,639 for the quarter, with RIPE accounting for the largest share at 1,845 transfers versus ARIN's 794. The gap between RIPE and ARIN transfer counts is widening — RIPE's figure is 2.3x ARIN's, reflecting both RIPE's more fragmented address holder base and more frequent intra-registry movements. APNIC, LACNIC, and AFRINIC recorded zero official transfers during the period, though priced transactions did occur in APNIC and LACNIC regions through broker channels.Long-Run Transfer Trends
Over the trailing 36 months, a total of 30,058 transfers have been recorded across all RIRs. The peak month was December 2024, which aligns with the year-end tax-motivated selling pattern we've observed in prior cycles. RIPE has accounted for 59.7% of all transfers over this window versus ARIN's 40.3% — a ratio that has remained remarkably stable, suggesting structural differences in holder behavior rather than any temporary dynamic.| RIR | RIR Transfers |
|---|---|
| RIPE | 17,936 |
| ARIN | 12,122 |
| RIR Transfers | 30,058 |
Outlook & Forecast
Forecasting each block-size band and RIR separately with our AI model:
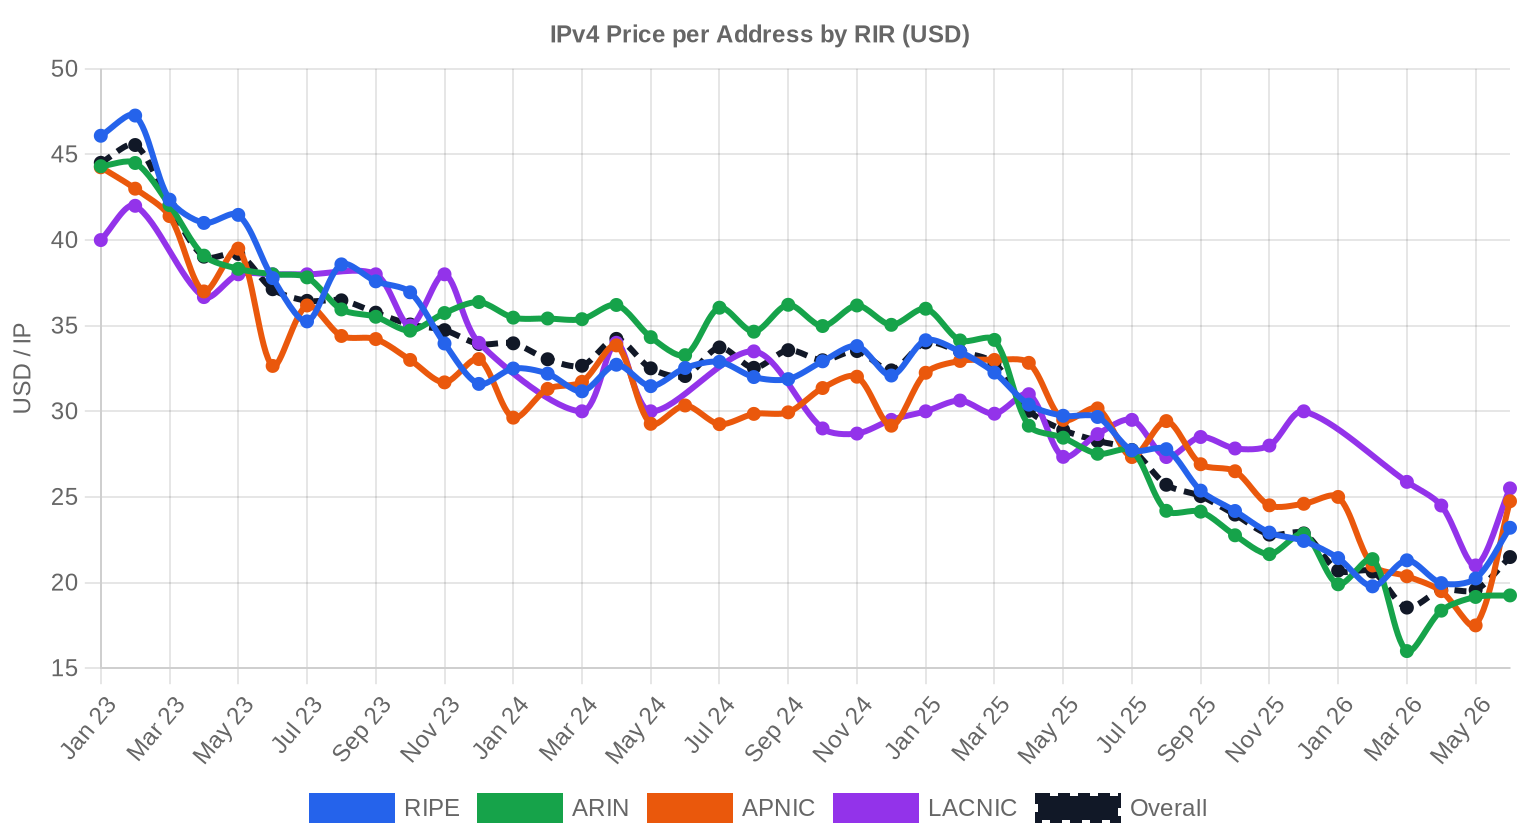
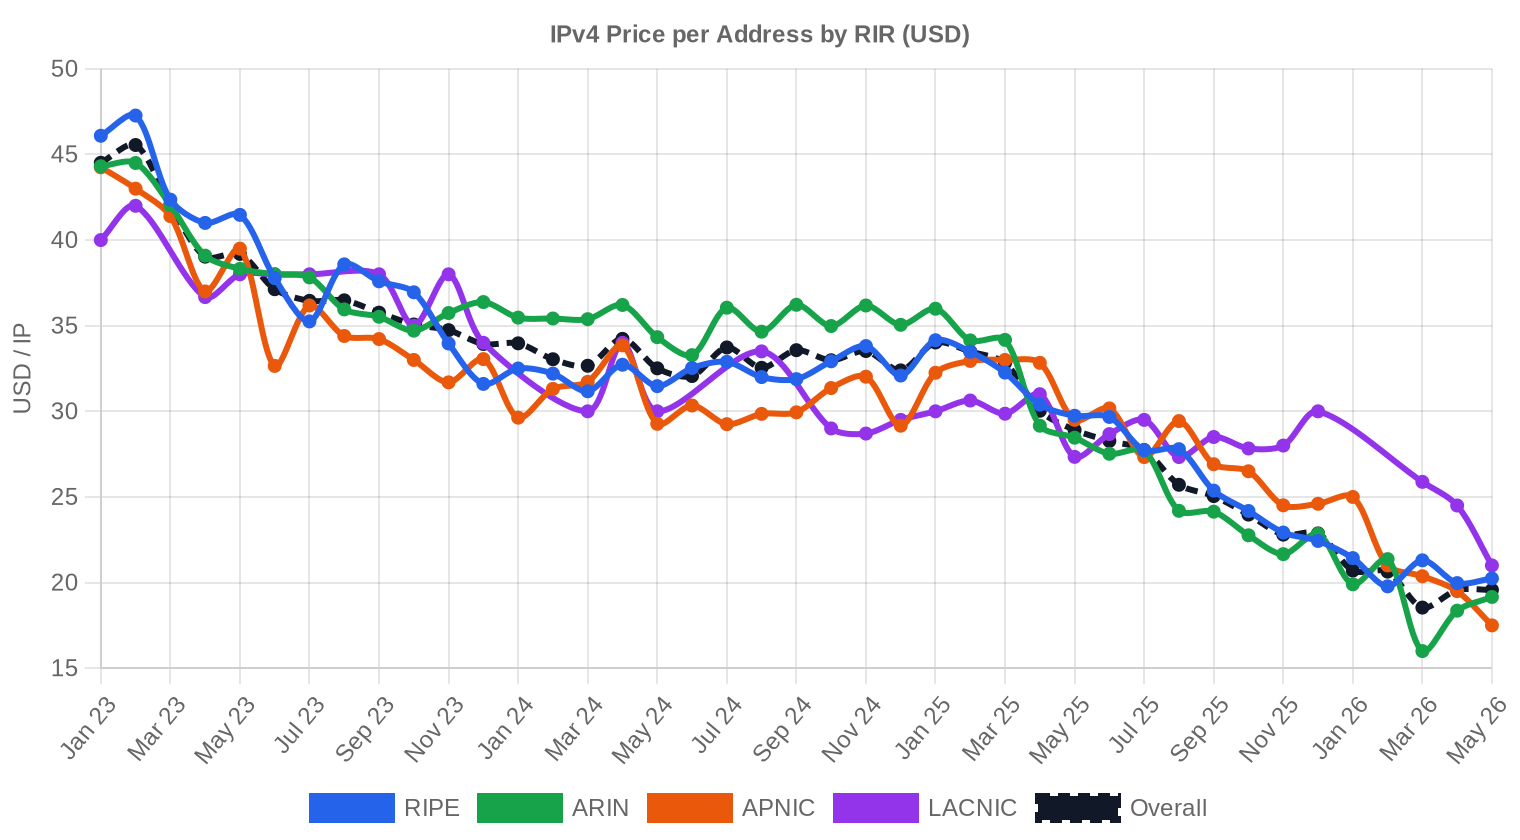
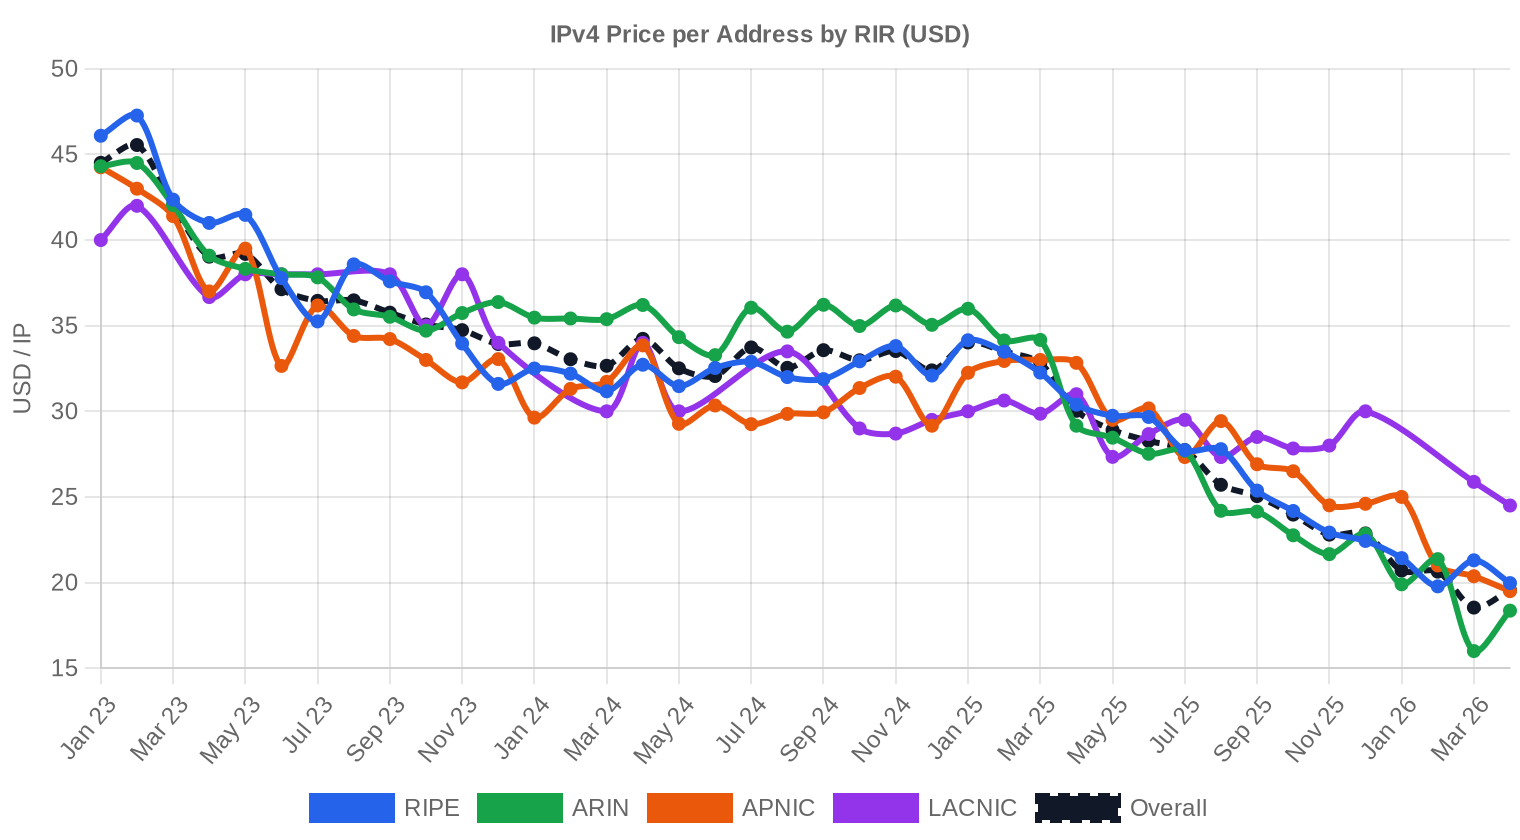
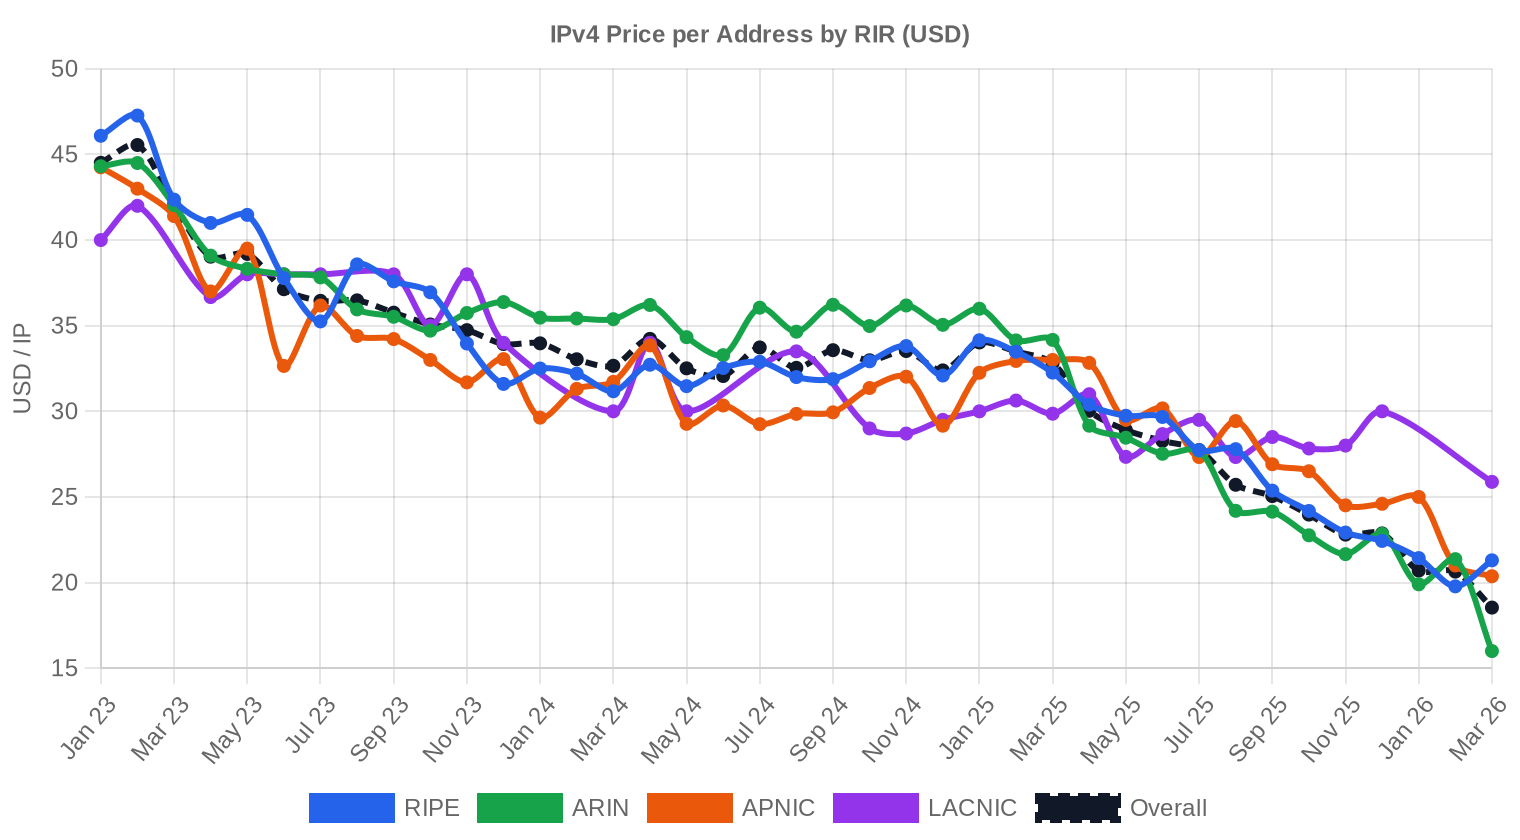
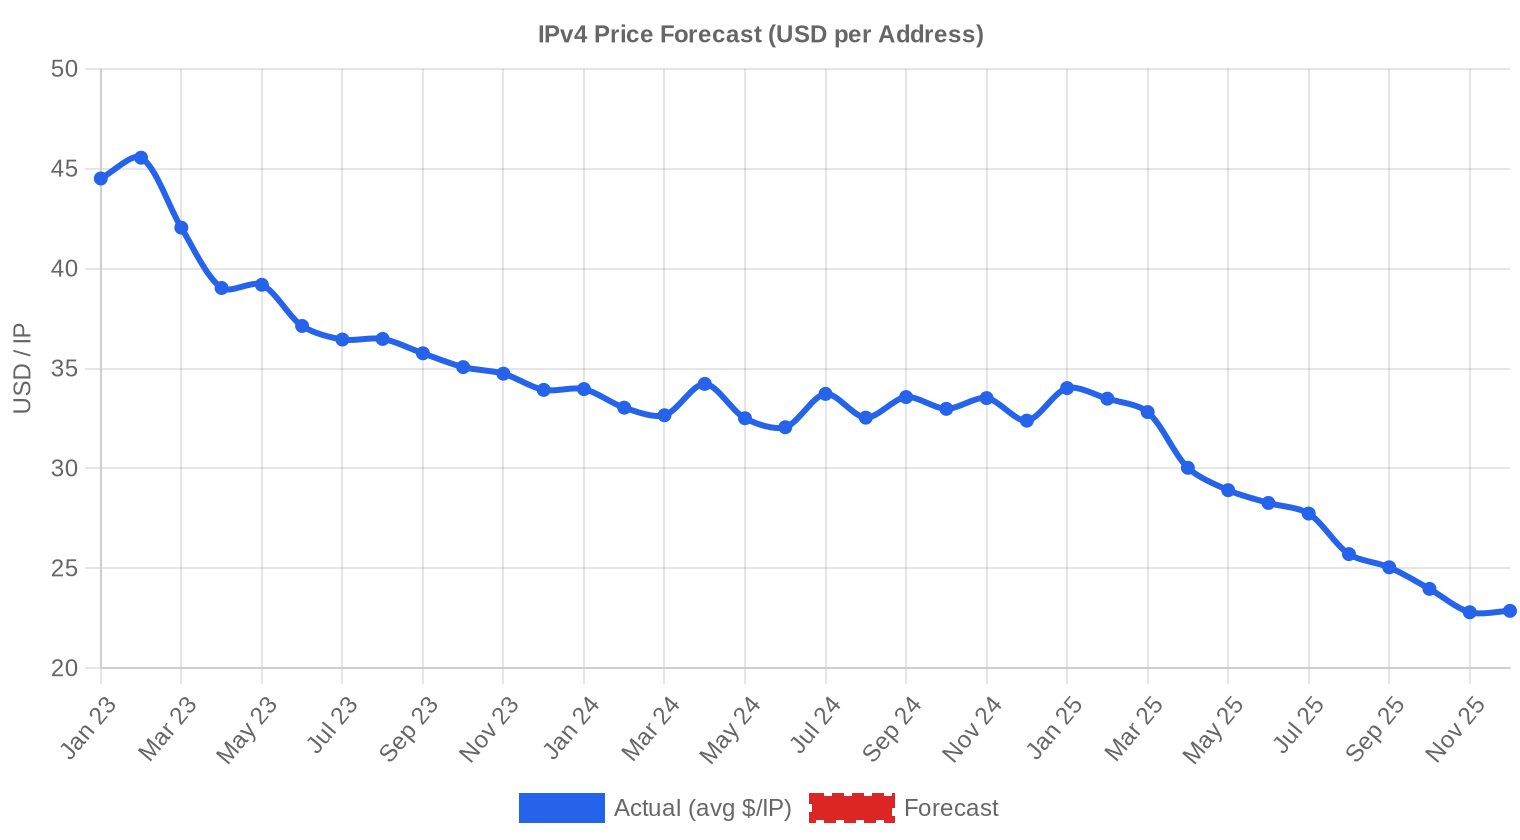
The overall average price per IP is projected to reach $19.42 by December 2025, with a next-month estimate of $21.58 per IP.
- RIPE: projected at $21.00 per IP next month, trending toward $18.50 by December 2025.
- ARIN: projected at $21.50 per IP next month, trending toward $19.00 by December 2025.
- APNIC: projected at $25.00 per IP next month, trending toward $23.00 by December 2025.
- LACNIC: projected at $29.50 per IP next month, trending toward $28.00 by December 2025.
- AFRINIC: insufficient data for a reliable forecast.
Forecast by Block Size
| Block | Current $/IP | Next Month | Year-End | Confidence |
|---|---|---|---|---|
| /24 | $25.00 | $25.00 (0.0%) | $22.00 (-12.0%) | medium |
| /23 | $21.35 | $22.00 (+3.0%) | $20.00 (-6.3%) | medium |
| /22 | $20.88 | $20.50 (-1.8%) | $19.00 (-9.0%) | medium |
| /21 | $20.50 | $20.00 (-2.4%) | $18.00 (-12.2%) | low |
| /20 | $25.00 | $22.00 (-12.0%) | $19.50 (-22.0%) | low |
| /19 | $17.50 | $17.00 (-2.9%) | $15.50 (-11.4%) | low |
| /18-/16 | $12.75 | $13.00 (+2.0%) | $12.00 (-5.9%) | low |
| /15-up | $11.63 | $11.50 (-1.1%) | $10.50 (-9.7%) | low |
Editor's Take: Buy vs. Lease
At current pricing, the buy-versus-lease math tilts decisively toward purchasing. A /24 block costs roughly $5,929 to buy outright at the current average. Leasing the same block runs $150 per month, or $1,800 per year. That means the purchase pays for itself in 39.5 months — just over 3.3 years. For any organization planning to hold addresses beyond that horizon, buying is the clear play. The implied annual yield for a lessor is 30.4%, which is extraordinary by any asset-class standard and suggests lease rates have room to compress as purchase prices continue falling. If you're currently leasing and your deployment timeline extends beyond 2028, we'd recommend converting to ownership at these levels.| /24 Purchase price | $5,929 |
| /24 Lease price | $150 / mo |
| Payback period | 39.5 mo (3.3 yr) |
| Gross annual yield | 30.4% |

What This Means for You
For buyers: This is the most favorable pricing environment since 2019. Average per-IP costs have dropped nearly 30% in twelve months, and our models project further declines toward $19–$20 by year-end. If you've been waiting for a better entry point, the trend is your friend — but the pace of decline may slow as we approach what look like floor prices in the ARIN region.For sellers: Every quarter of delay has cost you roughly 8–12% in realized value. Blocks that would have cleared at $30+ in late 2024 are now moving at $22–$23. If you're holding standard ARIN or RIPE inventory without a strategic reason, the exit window is narrowing. Consider pricing aggressively to move volume before further compression.
For leasers: Monthly rates at $0.59/IP haven't adjusted downward as fast as purchase prices, creating an arbitrage opportunity for buyers. If you're leasing more than a /22, the payback period on purchasing is under 3.5 years. Run the numbers for your specific deployment.
For block holders: Leasing yields remain at 30.4% annualized, which is still highly attractive. But be aware that as purchase prices fall, lessees will increasingly do the math and convert to ownership. Lock in longer-term lease agreements where possible.
Browse verified IPv4 blocksSell IPv4 →
List your blocks with managed transferLease IPv4 →
Flexible short-term capacityLease Out IPv4 →
Turn idle blocks into recurring revenue
IPv4 Pricing by Block Size
Small blocks carry a persistent per-IP premium. A /24 at current averages costs roughly $23/IP, while larger /16 blocks in bulk deals have cleared as low as $11–$15/IP depending on region and cleanliness. The 68 /24 transactions this quarter averaged higher than the market-wide $23.16, reflecting the convenience premium buyers pay for ready-to-deploy single blocks. For buyers with flexibility on timing and block size, aggregating a few /20s or /18s still offers meaningful savings over buying equivalent /24 inventory piecemeal.| Block | IPs | Buy: /IP | Buy: Total | Lease: /IP/mo | Lease: Monthly |
|---|---|---|---|---|---|
| /24 | 256 | $35–45 | $8,960–11,520 | $0.38–0.50 | $97–128 |
| /22 | 1,024 | $28–38 | $28,672–38,912 | $0.33–0.45 | $338–461 |
| /20 | 4,096 | $22–32 | $90,112–131,072 | $0.30–0.40 | $1,229–1,638 |
| /18 | 16,384 | $20–30 | $327,680–491,520 | $0.30–0.38 | $4,915–6,226 |
| /16 | 65,536 | $18–28 | $1,179,648–1,835,008 | $0.30–0.35 | $19,661–22,938 |
IPv4 Price History: 2011–2026
IPv4 pricing has traversed a full cycle since IANA pool exhaustion in 2011. Early post-exhaustion trades cleared in the $7–$10 range. Prices climbed steadily through the mid-2010s, accelerated in 2021–2022 as cloud and remote-work demand surged, and peaked near $50–$55/IP in some RIR regions during late 2022. AWS's February 2024 decision to charge $3.60/year per public IPv4 address marked a psychological inflection point — large cloud consumers began auditing and releasing unused space. The current $23.16 average represents a roughly 55% decline from peak levels and sits at a price last seen in 2020.| Year | ~Price/IP | Key Event |
|---|---|---|
| 2011 | $7–12 | IANA free pool exhausted; Microsoft/Nortel deal ($11.25/IP) |
| 2012 | $8–12 | RIPE NCC reaches last /8; begins /22-only allocation |
| 2014 | $10–15 | LACNIC free pool exhausted |
| 2015 | $8–15 | ARIN free pool exhausted |
| 2017–18 | $12–18 | Leasing market grows; cloud demand rises |
| 2019 | $18–24 | RIPE NCC exhausts remaining free pool |
| 2021–22 | $50–60+ | Post-pandemic peak; hyperscaler build-outs |
| 2024 | $35–52 | AWS IPv4 charge ($0.005/IP/hr); large block correction |
| 2025–26 | $18–45 | Market bifurcation; /16s below $20 for first time since 2019 |
Market Structure: Who Is Buying & Selling
The buy side is dominated by mid-tier ISPs, hosting companies, and enterprises deploying hybrid cloud infrastructure. Hyperscalers are less active in the open market, having either secured inventory earlier or shifted to internal IPv6 migration. On the sell side, legacy holders — universities, government agencies, and companies that received allocations in the pre-commercial internet era — continue to be the primary source of supply, supplemented by blocks surfacing from M&A activity and corporate restructurings.IPv4 vs. Other Asset Classes
At a 30.4% annualized lease yield, IPv4 addresses outperform virtually every conventional asset class. US 10-year Treasuries yield around 4.3%. Residential real estate cap rates sit in the 5–7% range. Even private credit strategies rarely clear 15%. The catch is liquidity and depreciation risk — IPv4 addresses are a wasting asset tied to a protocol that will eventually be superseded. But "eventually" has been the operative word for over a decade, and current yields more than compensate for medium-term holding risk.| Asset Class | Typical Yield | Liquidity | Primary Risk |
|---|---|---|---|
| IPv4 | 30.4% | Moderate | IPv6 adoption, block quality |
| Commercial Real Estate | 5–8% | Low | Vacancy, rate cycle |
| Investment-Grade Bonds | 4–5% | High | Duration, credit risk |
| S&P 500 | ~1,3% | High | Market volatility |
| Money Market / T-Bills | ~4–5% | High | Rate cycle changes |
IPv6 Adoption & Why IPv4 Remains Essential
IPv6 capability continues to expand — Google reports over 45% of its traffic arriving via IPv6. But capability and dependence are different things. The vast majority of enterprise applications, VPN endpoints, IoT management platforms, and legacy SaaS products still require IPv4 connectivity. Dual-stack will remain the operational reality through at least 2030, and every new network deployment still needs at least some IPv4 space to function in production.AI & Cloud Infrastructure Demand
AI infrastructure buildout is emerging as a material demand driver for IPv4 space. Training clusters and inference farms require routable public IPs for API endpoints, model-serving nodes, and data ingestion pipelines. The proliferation of GPU cloud providers — many of them startups without existing allocations — has created a new class of IPv4 buyer that didn't exist two years ago. We estimate AI-related demand accounts for a growing share of ARIN-region /20 to /18 purchases, though exact figures remain difficult to isolate.What Determines IPv4 Block Value
Block valuation depends on several factors beyond size. Clean blocks with no blacklist history and no prior association with spam or abuse command premiums of $2–$4/IP over market average. Allocation age matters — blocks allocated before 2000 from legacy holders tend to be cleaner. RIR region affects transferability: ARIN and RIPE blocks move freely within their respective policy frameworks, while APNIC and LACNIC blocks carry additional procedural overhead that shows up in the pricing spread.Sell vs. Lease: A Decision Framework
In a declining price environment, the sell case gets stronger every quarter. Holders who leased at $0.59/IP monthly in Q4 would need to lease for 39.5 months to match today's sale price — but if sale prices drop to $19.42 by year-end as projected, that same lease would only need 33 months. For holders with clean, transferable blocks and no strategic need for the space, selling now and redeploying capital into higher-certainty assets deserves serious consideration. Those who retain blocks for leasing should focus on locking in multi-year agreements to hedge against further price compression.| /24 Purchase price | $5,929 |
| /24 Lease price | $150 / mo |
| Payback period | 39.5 mo (3.3 yr) |
| Gross annual yield | 30.4% |
RIPE NCC 24-Month Transfer Restriction
RIPE NCC's 24-month holding requirement continues to restrict supply in the European market. Any block transferred within the RIPE region cannot be re-transferred for two years, effectively removing it from speculative trading. This rule creates a supply friction that has historically kept RIPE pricing slightly above ARIN, though the gap has now compressed to under $1/IP. The rule also means RIPE blocks acquired in late 2023 are just now becoming eligible for resale, which could add incremental supply in early 2026.Deal Size Distribution
Average deal size this quarter was $104,392, up marginally from $102,956 in Q3 but down from $108,165 in Q4 2024. The distribution remains heavily skewed: 177 transactions (75% of deals) fell below $50K and totaled just $2.76 million, while 14 transactions above $1 million accounted for $27.3 million — more than the total reported market value of $24.5 million for smaller deals combined. The mid-market ($50K–$250K) saw 35 deals worth $4.55 million, a segment that tends to represent working ISPs and hosting companies buying operationally necessary space.Top Trading Countries
The United States accounted for 16 transactions, roughly 4x the next most active markets (Canada and Great Britain at 3 each). US dominance reflects ARIN's 46% market share and the sheer scale of American data center and network infrastructure. European activity was distributed across multiple countries — Bulgaria, Russia, Germany, Italy, and the UK each registered at least one deal — consistent with RIPE's geographically fragmented holder base.BEAD Broadband Program Impact
The $42.45 billion BEAD program is entering its deployment phase, with state-level subgrantee selections accelerating in late 2025. Rural broadband providers receiving BEAD funding will need routable IPv4 space to serve new subscribers, and many of these operators have minimal existing allocations. We expect BEAD-driven demand to materialize most visibly in the /20 to /18 range through 2026–2027, potentially creating localized tightness for mid-size ARIN blocks even as overall market prices trend lower.Hyperscaler IPv4 Holdings
Amazon, Microsoft, and Google collectively control an estimated 100+ million IPv4 addresses through direct holdings and acquisitions. Amazon's decision to charge for public IPv4 addresses triggered a release of underutilized space back to the market in 2024 and continues to influence supply dynamics. Any decision by a major hyperscaler to divest even a small fraction of its holdings would represent a supply shock; conversely, their continued retention of massive blocks constrains the available float and keeps the market thinner than headline numbers suggest.Macroeconomic Conditions & Market Impact
The broader macro environment is mixed for IPv4 demand. Enterprise IT budgets remain cautious heading into 2026, with many organizations extending hardware refresh cycles. Higher-for-longer interest rates have increased the cost of capital for infrastructure buildouts, particularly among smaller ISPs and startups who are the most price-sensitive IPv4 buyers. On the other hand, US federal spending on broadband and AI infrastructure provides a countervailing demand floor. The net effect has been a gradual demand softening that, combined with steady legacy supply, explains the persistent downward pricing trend.Model Update & Calibration
We reviewed our past projections against actual market outcomes and recalibrated the model for this report. The updated model places more weight on recent price movements using exponential decay, dynamically adjusts prediction bands to reflect current market conditions, and corrects for any systematic bias detected in earlier forecasts. The predicted-vs-actual comparison chart below shows how closely our past estimates tracked reality.
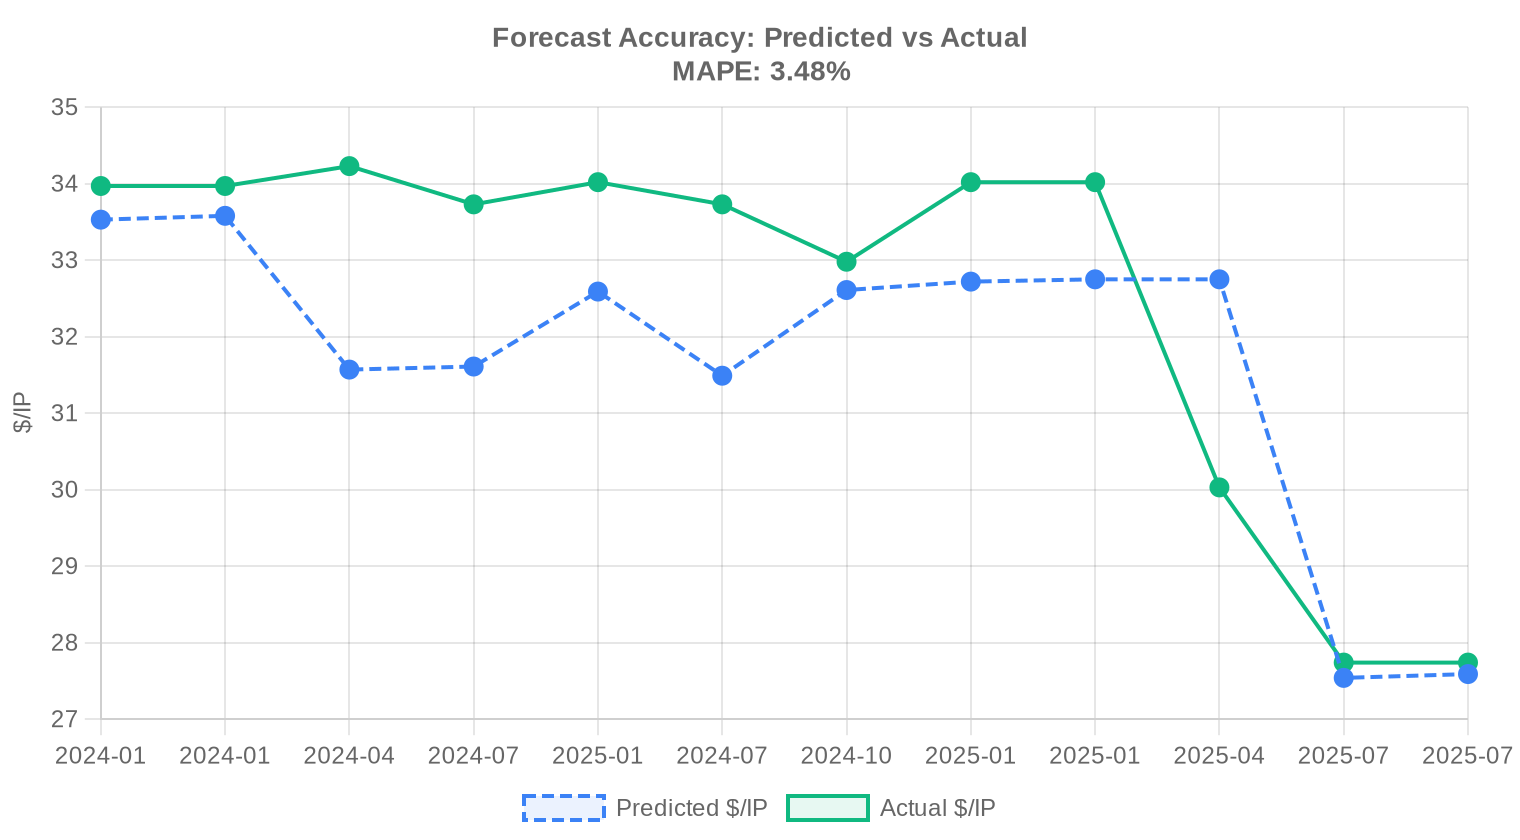
| Report Period | Target Month | Predicted | Actual | Deviation |
|---|---|---|---|---|
| 2024-Q3 | 2024-10 | $33 | $33 | -1% |
| 2024-H2 | 2025-01 | $33 | $34 | -4% |
| 2024-Q4 | 2025-01 | $33 | $34 | -4% |
| 2025-Q1 | 2025-04 | $33 | $30 | +9% |
| 2025-H1 | 2025-07 | $28 | $28 | -1% |
| 2025-Q2 | 2025-07 | $28 | $28 | -1% |
Methodology
Figures are based on completed IPv4Center marketplace transactions and RIR transfer statistics. Prices are in US dollars per IP address. Forecasts are produced by an AI model that analyses each block-size band and RIR segment separately (with outlier-trimmed medians) alongside known market catalysts; they are estimates, not guarantees.
Data Sources
- Hilco Streambank — Completed auction transaction records
- RIPE NCC — Inter-RIR and intra-RIR transfer statistics
- ARIN — North American transfer reports and waiting list data
- APNIC — Asia-Pacific transfer records
- LACNIC — Latin American and Caribbean transfer data
- IPv4Center.com — Proprietary marketplace transaction and lease pricing data
This report is generated automatically for informational purposes only and does not constitute financial advice.
Frequently Asked Questions
What was the average price per IPv4 address in Q4 2025?
The global weighted average landed at .16 per IP, with a median of . That represents an 11.73% decline from the prior period — the steepest quarterly drawdown the market has printed in some time.
How many IPv4 transactions closed in Q4 2025, and what was the total volume?
We tracked 235 priced transactions covering roughly 1.66 million addresses for an aggregate market value of .5 million. The average deal size ran about 104,392 IPs, skewed heavily by a handful of large ARIN blocks.
Which RIR region commanded the highest per-IP prices this quarter?
LACNIC space was the priciest at .17 per IP on average, a 21.7% premium over ARIN's .41. Scarcity in the Latin American registry, combined with limited supply and cumbersome transfer mechanics, continues to support that premium. APNIC ran second at .27.
Why is ARIN space trading cheaper than APNIC or LACNIC when ARIN has the most transactions?
ARIN accounted for 46% of deal flow and 1.26 million of the 1.66 million IPs transacted — by far the deepest liquidity pool. More supply, more willing sellers, and standardized transfer processes compress the bid-ask spread. ARIN's average of .41 and median of reflect a mature, efficiently priced market. Thinner registries command scarcity premia.
What was the price range observed across all transactions in Q4 2025?
The floor was per IP (likely a very large ARIN block with legacy encumbrances or limited routing confidence) and the ceiling was , also in ARIN. That spread is wide, underscoring how much block size, cleanliness, and registry provenance still matter.
How did RIPE NCC transfer activity compare to ARIN this quarter?
RIPE logged 1,845 total inter-RIR and intra-RIR transfers versus ARIN's 794 — RIPE accounted for roughly 59.7% of all recorded transfer activity over the trailing 36 months. However, ARIN dominated priced sale volume with 108 transactions to RIPE's 99, and moved nearly four times the IP count (1.26M vs. 333K).
Is it cheaper to buy or lease IPv4 addresses at current Q4 2025 rates?
Buy. At .16 per IP versus a lease rate of roughly .59/month, the purchase breaks even in about 39.5 months — just 3.3 years. The implied annual yield on leased space is 30.4%, which is extraordinarily generous for lessors and punitive for lessees on any time horizon beyond three years.
What does a /24 block cost to buy versus lease right now?
A /24 (256 IPs) runs approximately ,929 at the current average. Leasing the same block costs roughly 0 per month, or ,800 annually. If you need the space for more than 39 months, the math favors ownership unambiguously.
What mistakes should buyers avoid in the current declining-price environment?
First, don't overpay for small blocks out of urgency — /24s accounted for 68 of 235 transactions, and supply is ample. Second, avoid locking into a long-term lease when the buy-versus-lease breakeven is only 3.3 years. Third, don't ignore RIR-specific pricing; you may save –6 per IP choosing ARIN over LACNIC space if your use case permits.
What are the risks of buying IPv4 addresses given the forecast points to further price declines?
Our model projects a year-end 2025 average of .42, implying another 16% downside from the current .16. Buyers face mark-to-market depreciation risk on their balance sheets. That said, the operational utility of routable address space doesn't diminish with price — this is more relevant for speculative holders and brokers carrying inventory.
How reliable is the forecast for continued price declines through year-end 2025?
We flag this forecast as reliable based on consistent trend data. The model projects a next-month average of .58 and a December 2025 exit rate of .42. The 11.73% quarter-over-quarter decline provides a solid trend anchor, though exogenous demand shocks — a major cloud buildout, regulatory changes — could arrest the slide.
Were there any transactions from AFRINIC in Q4 2025?
Zero. AFRINIC recorded no priced transactions and no transfers this quarter. The registry's ongoing governance and legal challenges continue to effectively freeze its transfer market. We do not expect meaningful AFRINIC deal flow in the near term.
Which block size was most frequently traded in Q4 2025?
The /24 (256 addresses) was the most commonly transacted prefix, appearing in 68 of 235 deals — roughly 29% of all transactions. This is the minimum independently routable block and remains the entry-level unit for small enterprises, hosting providers, and email reputation management.
Which countries generated the most IPv4 buying activity?
The United States led with 16% of deals, followed by Canada and the United Kingdom at 3% each. Bulgaria, Russia, Germany, and Italy each contributed about 1%. The geographic concentration in North America tracks with ARIN's dominance of priced volume.
How is the market segmented by deal size?
Small deals under K dominated by count — 177 of 235 transactions (75%) — but contributed only .76M in value. The 14 deals exceeding M each accounted for .3M, or roughly 70% of total notional value. This is a barbell market: lots of retail /24 trades at one end, a handful of institutional block purchases at the other.
What risks do sellers face if they delay liquidating IPv4 holdings?
With prices trending down 11.73% quarter-over-quarter and the year-end forecast at .42, every quarter of delay could cost –4 per IP in realized value. On a /16 block (65,536 addresses), that's potentially 0K–0K in erosion. Sellers with no operational need for the space should be moving now.
Is IPv6 adoption the reason IPv4 prices are declining?
Partially, but the relationship is slower and more structural than headlines suggest. IPv6 deployment is gradually reducing incremental IPv4 demand at the margin — particularly among hyperscalers and mobile carriers — but the Q4 decline is more directly attributable to growing secondary-market supply from corporate divestitures and a softening demand environment. IPv6 is the long-term headwind; near-term pricing is driven by supply-demand mechanics.
How long does a typical IPv4 transfer take to complete in Q4 2025?
Timelines vary by registry. ARIN transfers typically close in 3–6 weeks given established processes and responsive staff. RIPE inter-RIR transfers can run 4–8 weeks. APNIC and LACNIC transfers are less predictable, often stretching to 8–12 weeks due to lower volumes and manual review steps.
What should a first-time buyer budget for a /24 block beyond the purchase price?
Plan on ,929 for the addresses themselves at the current average, plus 0–,500 in broker and escrow fees, and annual registry maintenance fees of roughly 0–0 depending on RIR. Some buyers also incur legal costs for purchase agreement review — typically ,000–,000. All-in, budget ,500–,700 for year one.
Why is there such a wide spread between the minimum () and maximum () per-IP prices?
Block size is the primary driver — large /14 and /15 blocks trade at steep volume discounts, while clean /24s with established routing history and no blacklist issues command premiums. Registry region matters too: LACNIC space at .17 average versus ARIN at .41 shows a .76 per-IP RIR premium. Provenance, abuse history, and buyer urgency fill in the rest.
What are the risks of leasing IPv4 space instead of buying at current rates?
At .59 per IP per month, a lessee paying for three-plus years will have spent more than the outright purchase price with zero residual asset to show for it. Lessees also face counterparty risk — if the lessor sells the block, service disruption follows. With the buy-lease breakeven at 39.5 months and an implied lessee cost-of-capital of 30.4% annualized, leasing only makes sense for genuinely short-duration needs.
How does APNIC pricing compare to other registries, and why?
APNIC averaged .27 per IP on just 19 transactions covering 26,880 addresses. That's a 12.8% premium over ARIN and a 9.3% premium over RIPE. Limited transferable supply in the Asia-Pacific region, combined with strong demand from cloud and hosting operators in Southeast Asia, sustains the markup. But APNIC's thin volume means a few deals can skew the average considerably.
What does the 30,058-transfer trailing count over 36 months tell us about market maturity?
It tells us this is a functioning, liquid secondary market. Over 30,000 recorded transfers across RIPE (59.7% share) and ARIN (40.3% share) over three years represents deep institutional engagement. The December 2024 peak month suggests seasonal clustering around budget cycles and year-end network planning. The market is maturing, not contracting — prices are simply finding a lower equilibrium.
Should enterprises accelerate IPv6 deployment instead of buying IPv4 at per address?
It depends on the use case. For internal infrastructure and new greenfield deployments, IPv6 is the rational long-term play — especially with IPv4 forecast to slide toward by year-end. But for customer-facing services, email infrastructure, and legacy application stacks, IPv4 remains non-optional. Most enterprises will run dual-stack for years. The question isn't either/or; it's allocation.
What drove the 11.73% quarter-over-quarter price decline — demand weakness or supply surplus?
Both, working in concert. Supply-side, we're seeing more corporate divestitures and portfolio optimization as CFOs monetize underutilized blocks. Demand-side, the hyperscaler buildout cycle that buoyed prices through 2023–2024 has moderated, and mid-market buyers are increasingly comfortable with CGNAT and IPv6 alternatives. The result is a market repricing that our models suggest has further to run.