15 min read
This report analyzes the IPv4 transfer market for First Half 2025, based on completed IPv4Center marketplace transactions and official RIR transfer records.
Executive Summary
The IPv4 transfer market moved 1,954,304 addresses across 420 transactions in the first half of 2025, generating $49.7 million in total deal value. Average pricing settled at $31.15 per IP — down 5.6% from $33.00 in H2 2024 and off 6.2% year-over-year versus H1 2024. The median held at $31, indicating the decline is broad-based rather than driven by a handful of distressed sales. Transaction volume actually ticked up 2.7% from the prior half, so this isn't a demand collapse — it's a repricing. The trend is clearly down, with the weighted regression showing a -1.1% drift across the period.Market Overview
| Transactions | 420 |
| IP Addresses Traded | 1,954,304 |
| Estimated Market Value | $49,699,677 |
| Average Price / IP | $31.15 |
| Median Price / IP | $31.00 |
| RIR Transfers | 5,485 |
Year-over-Year Comparison
| Metric | This period | A year earlier (H1 2024) | Change |
|---|---|---|---|
| Transactions | 420 | 343 | +22.4% |
| IP Addresses Traded | 1,954,304 | 641,792 | +204.5% |
| Estimated Market Value | $49,699,677 | $21,813,123 | +127.8% |
| Average Price / IP | $31.15 | $33.22 | -6.2% |
| RIR Transfers | 5,485 | 5,171 | +6.1% |
Price Dynamics
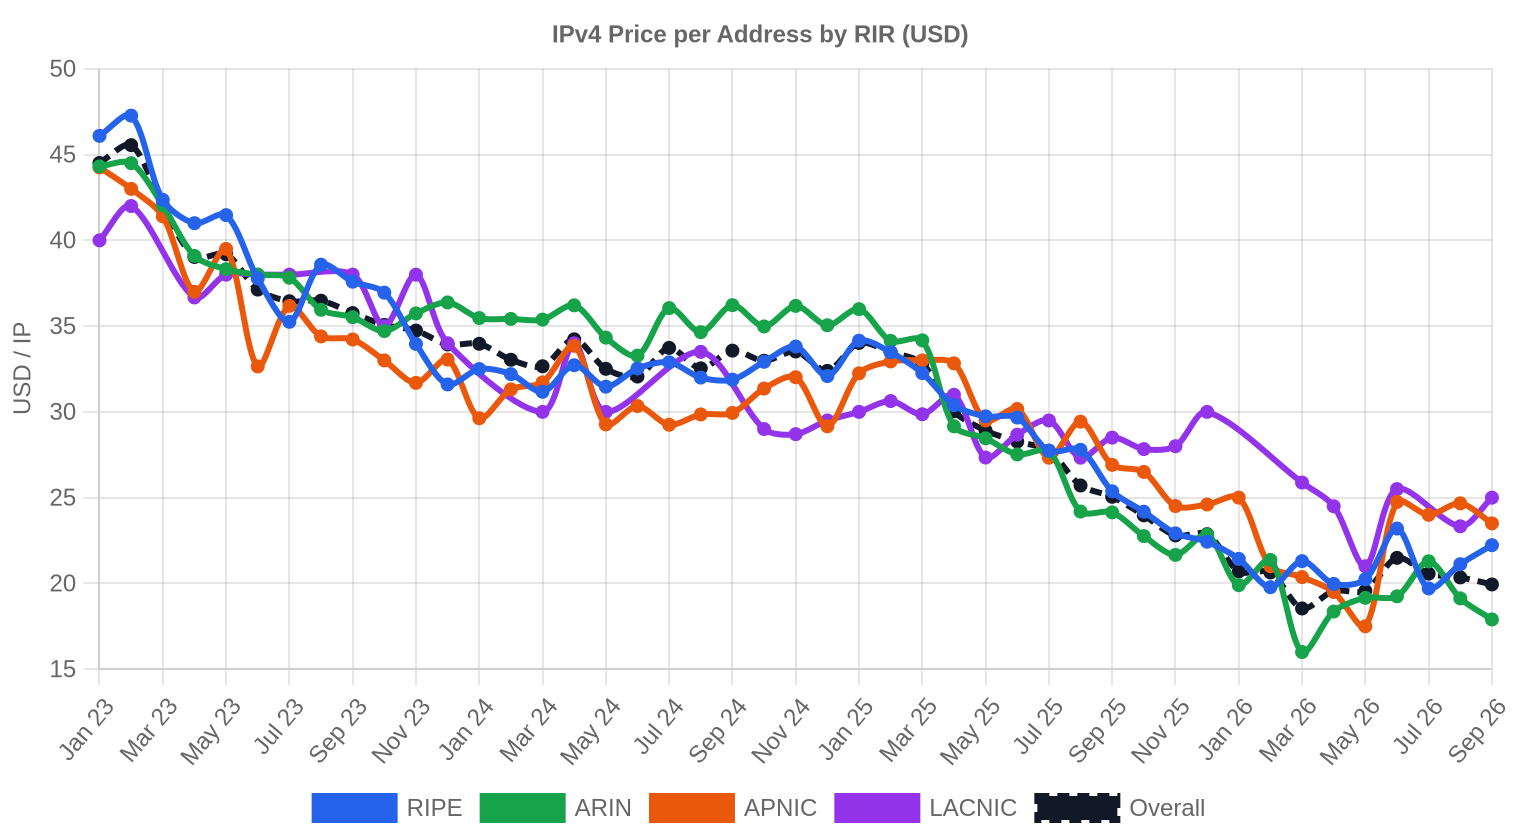
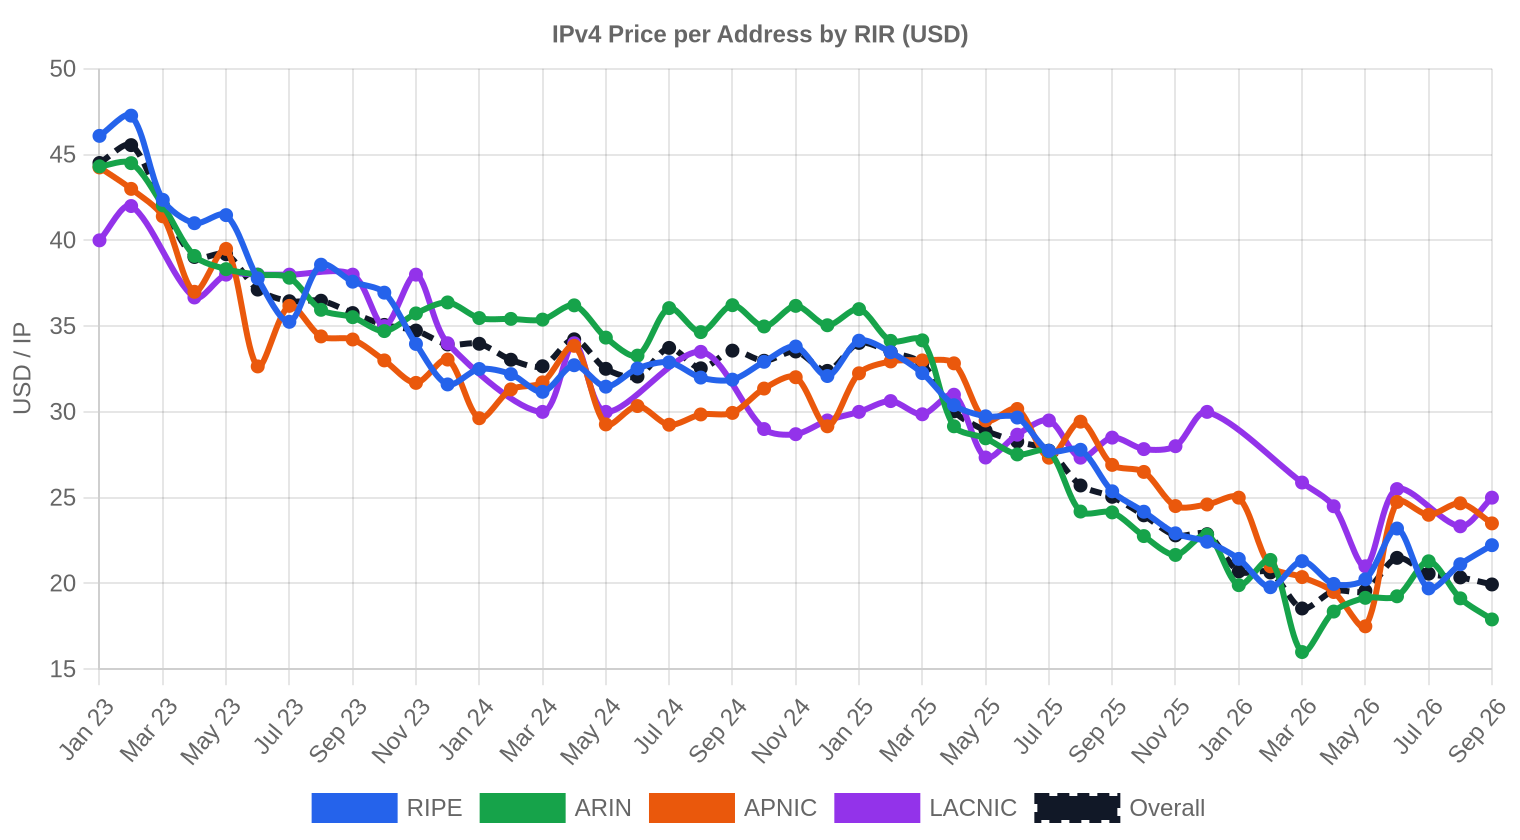
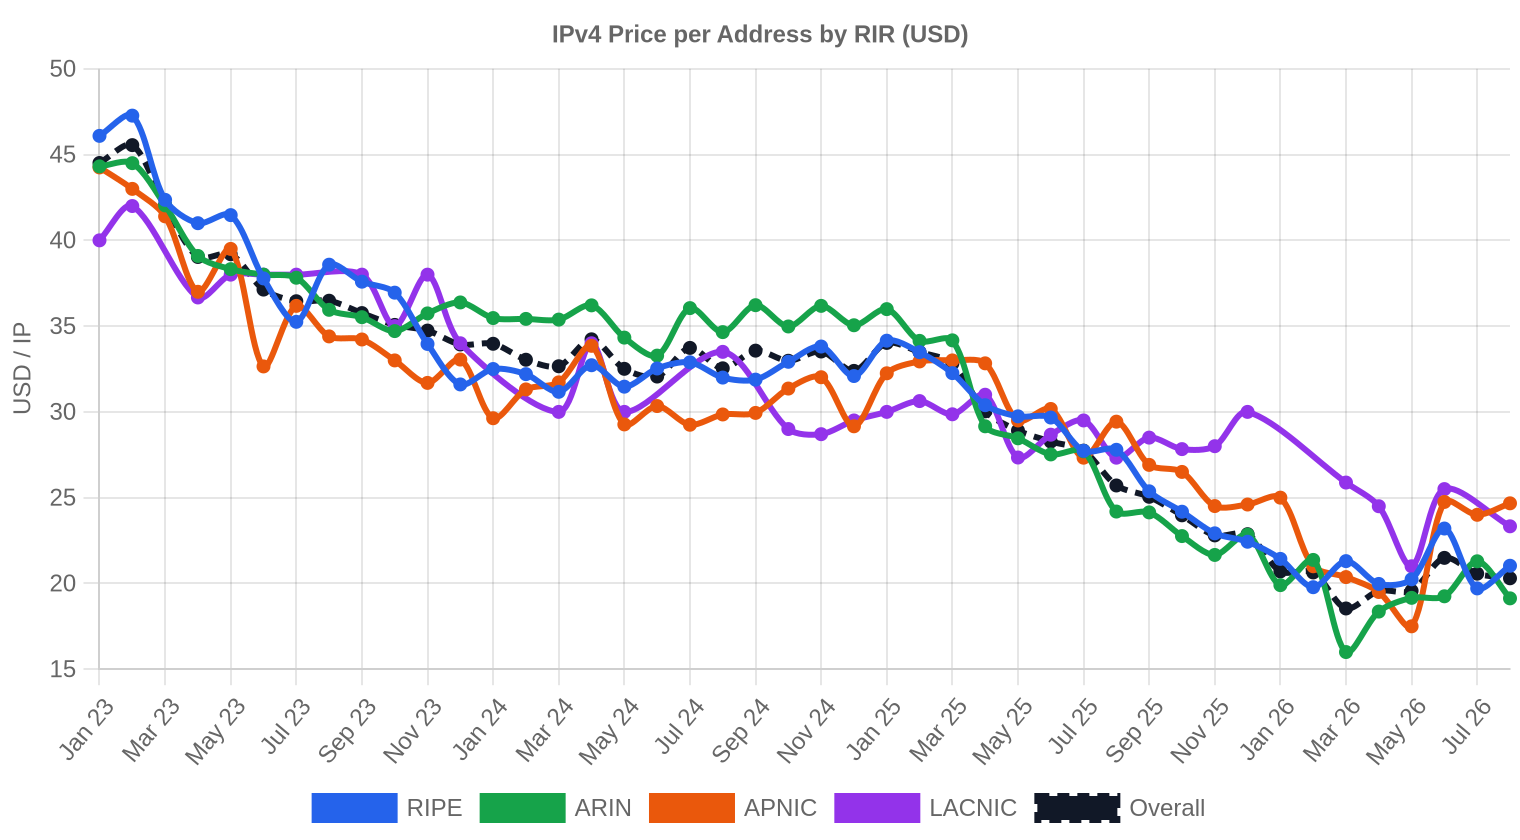
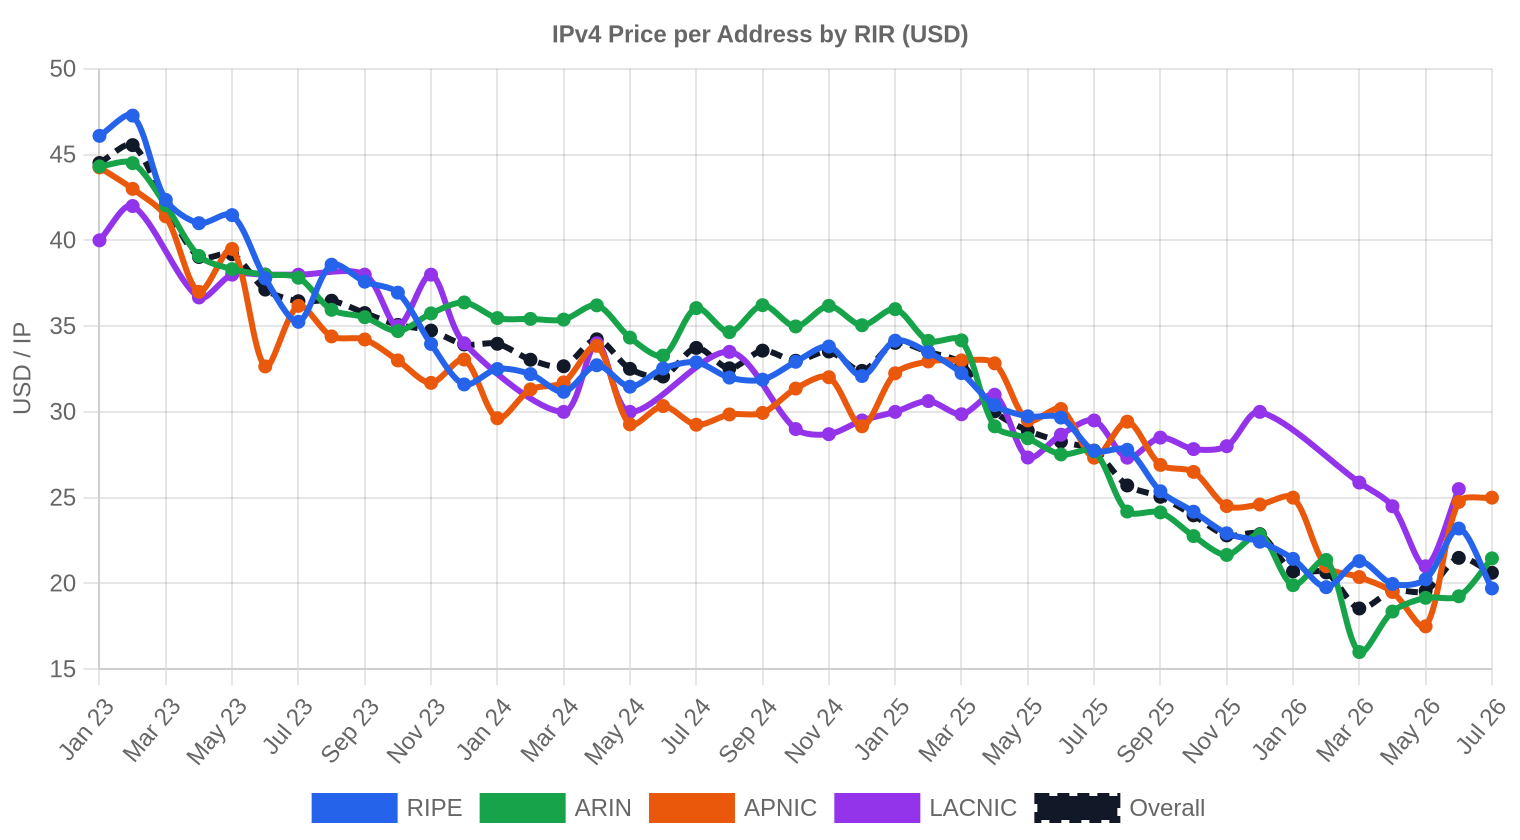
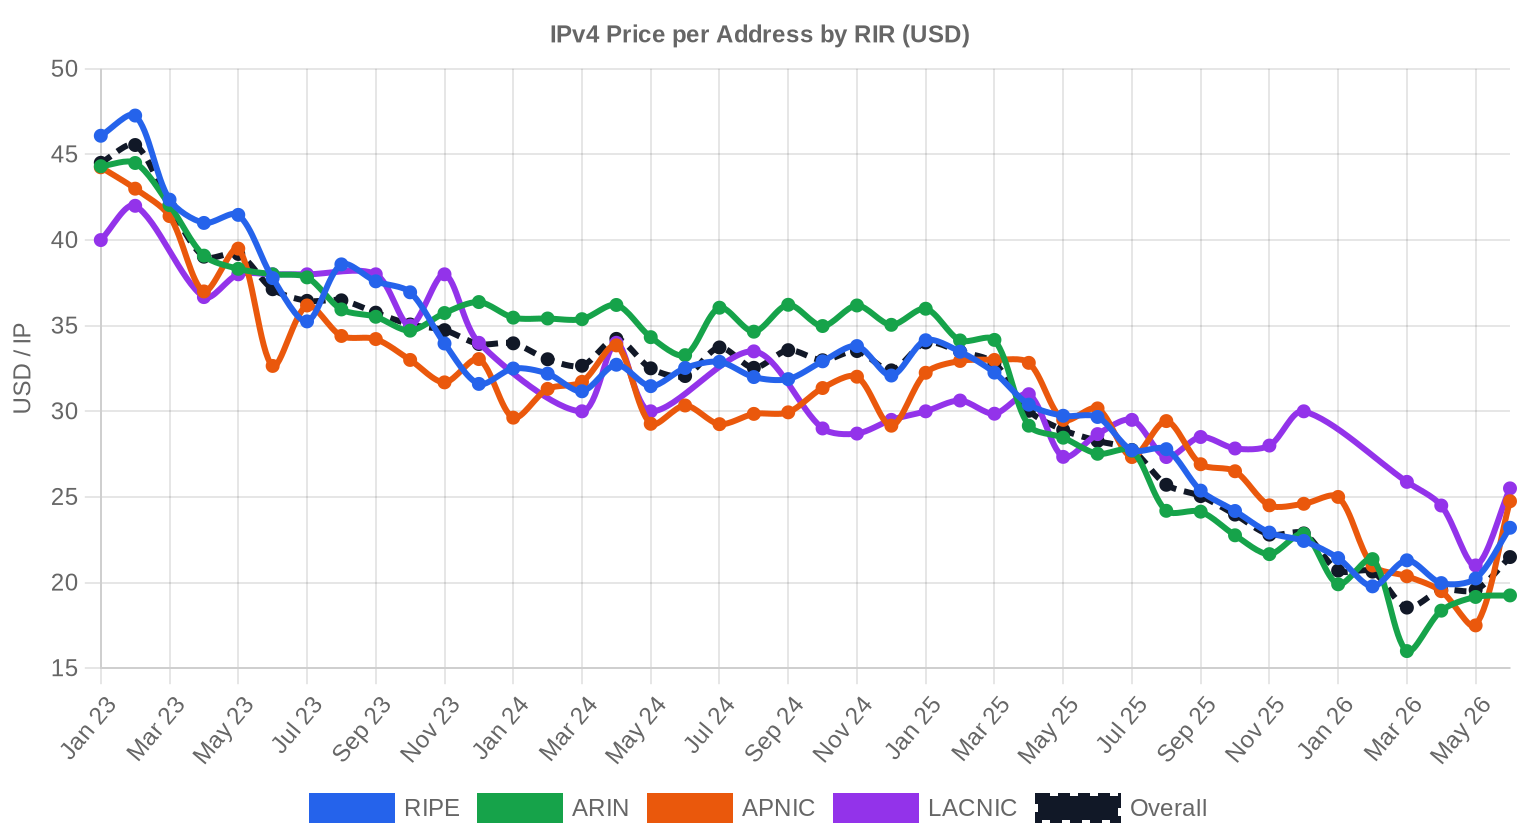
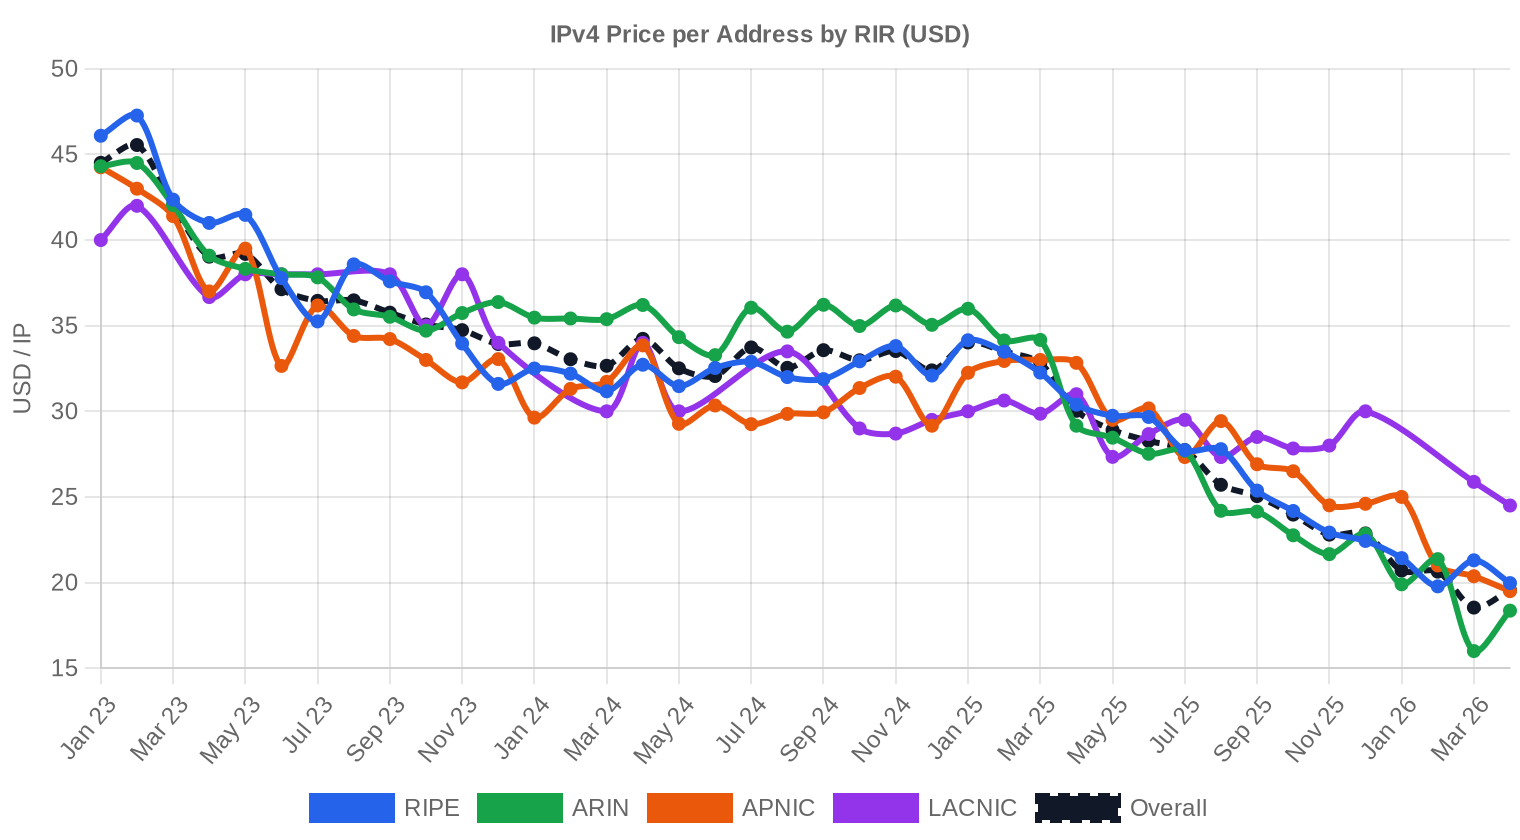
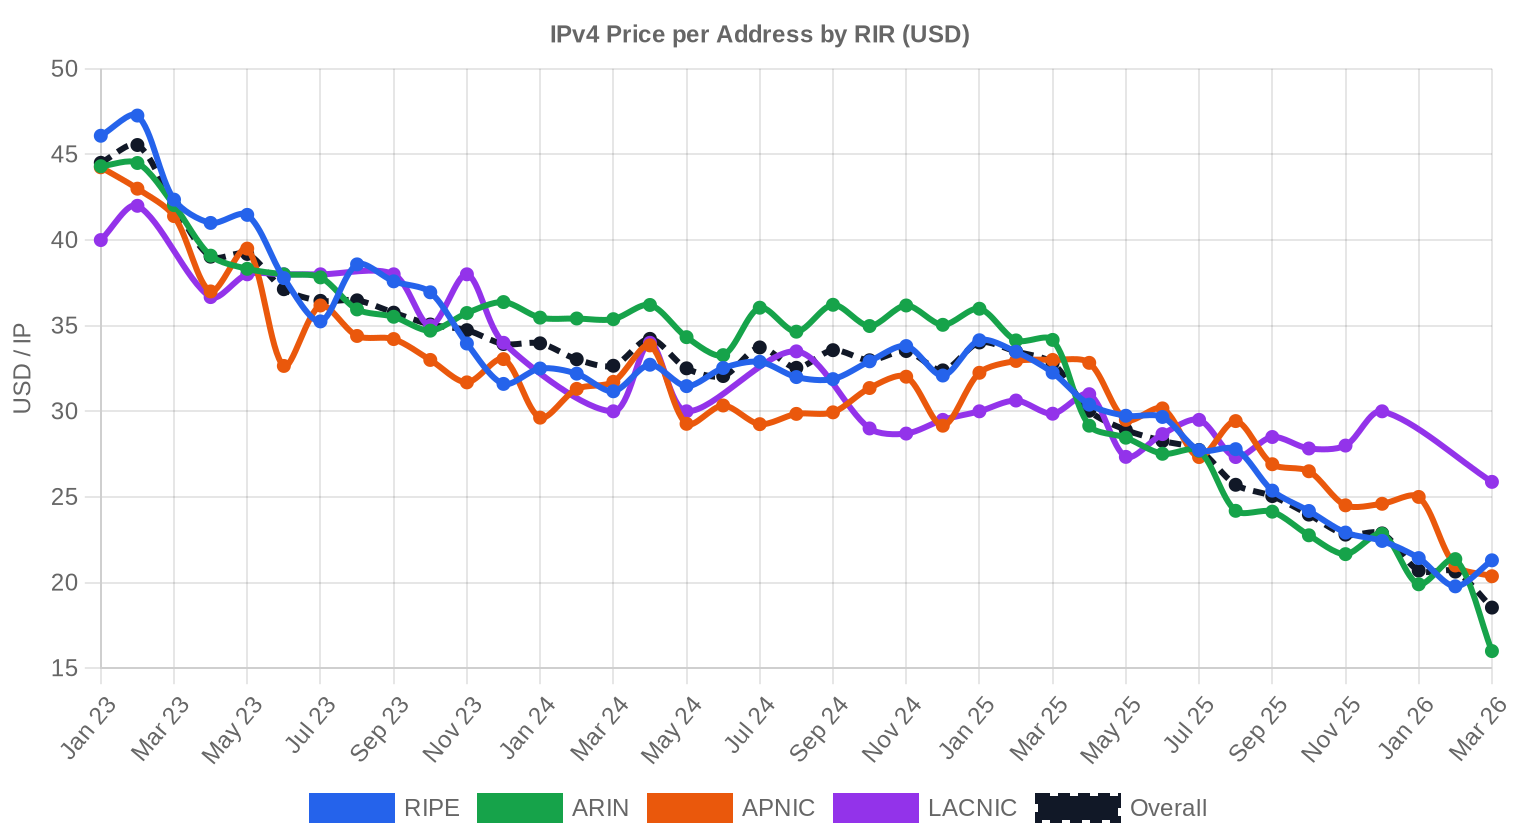
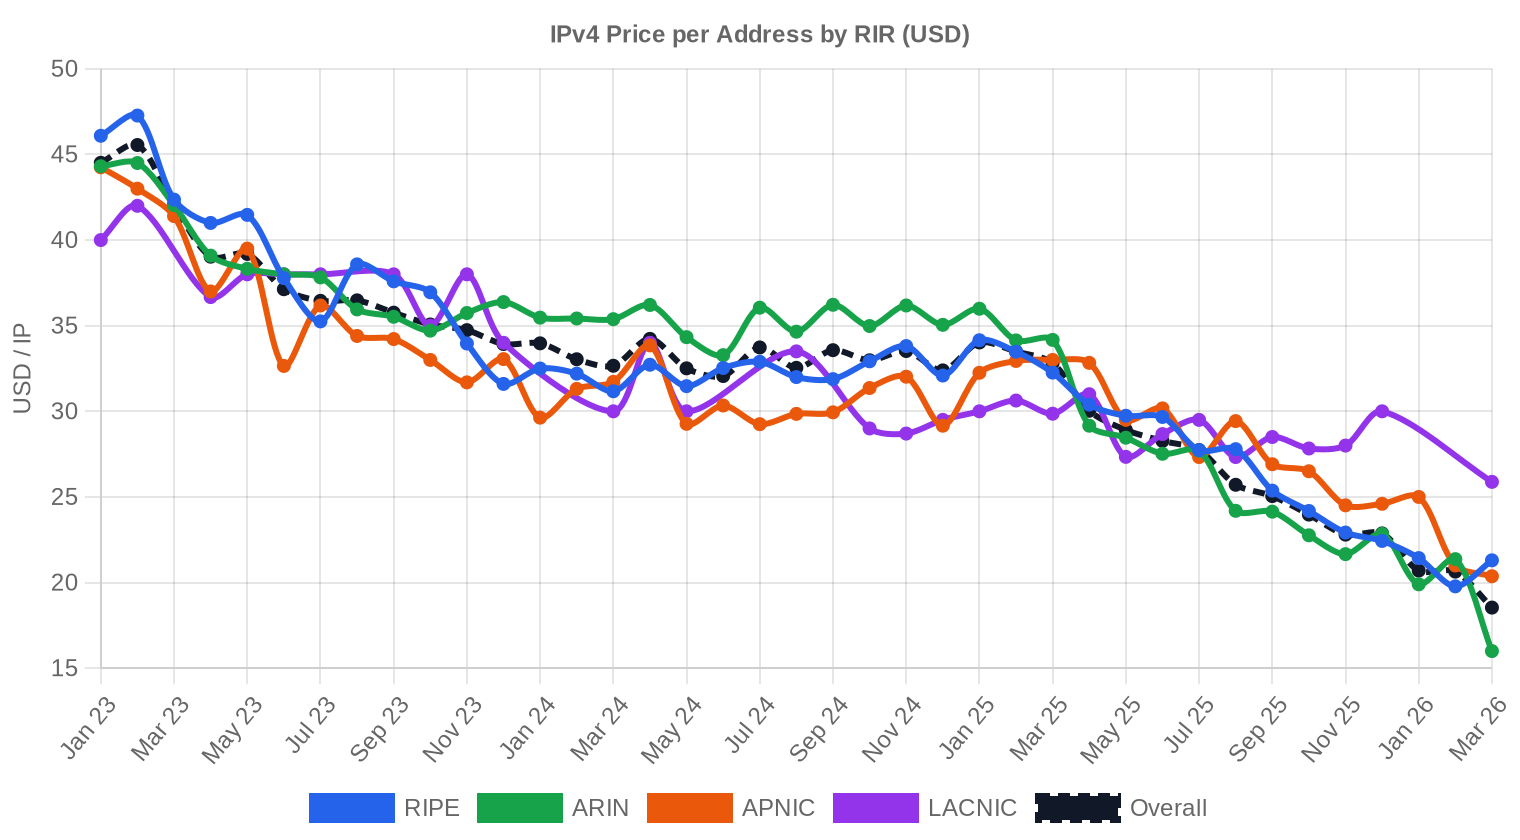
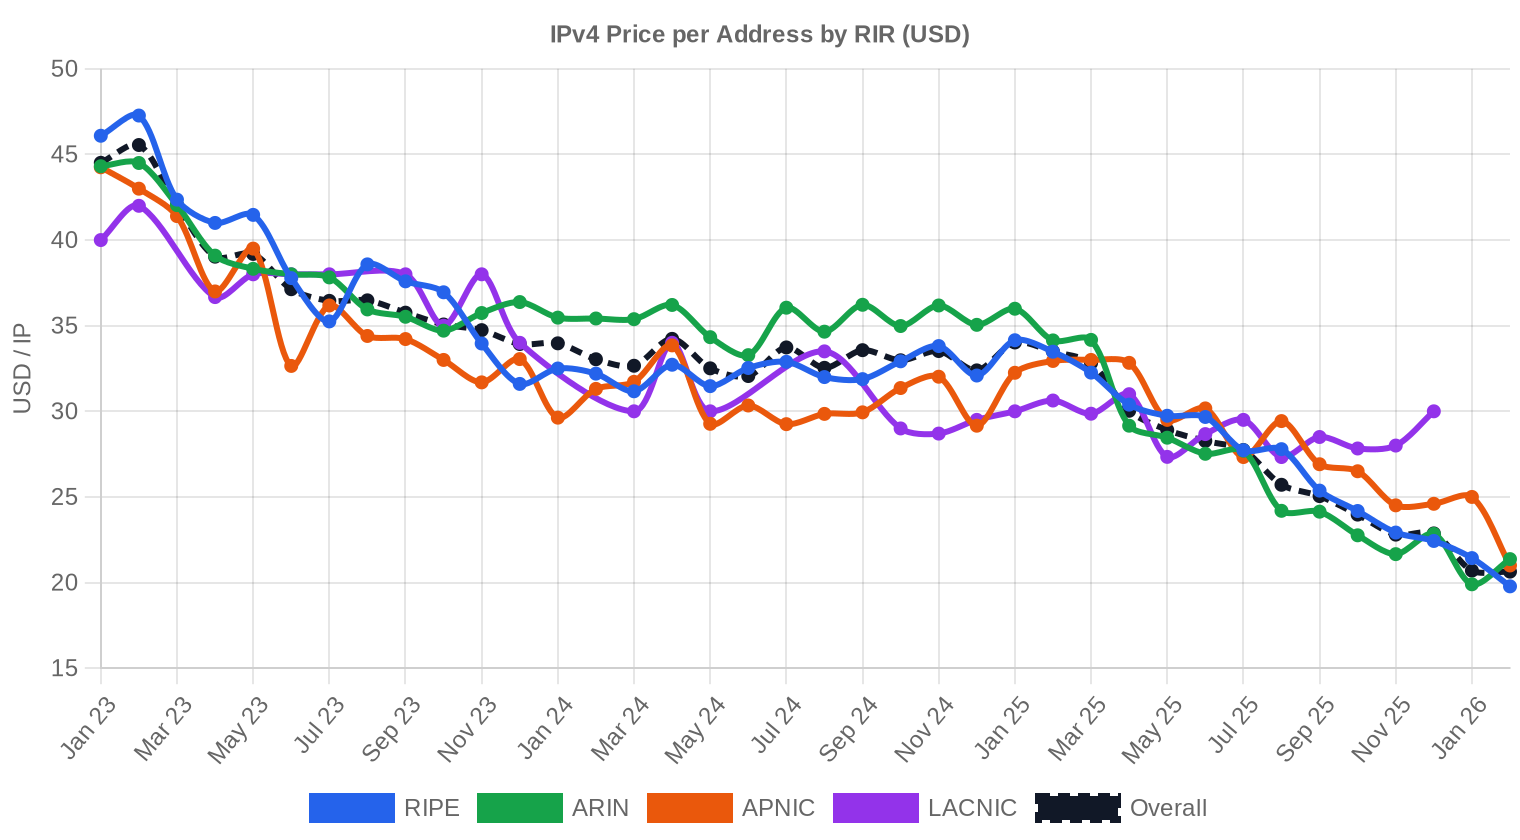
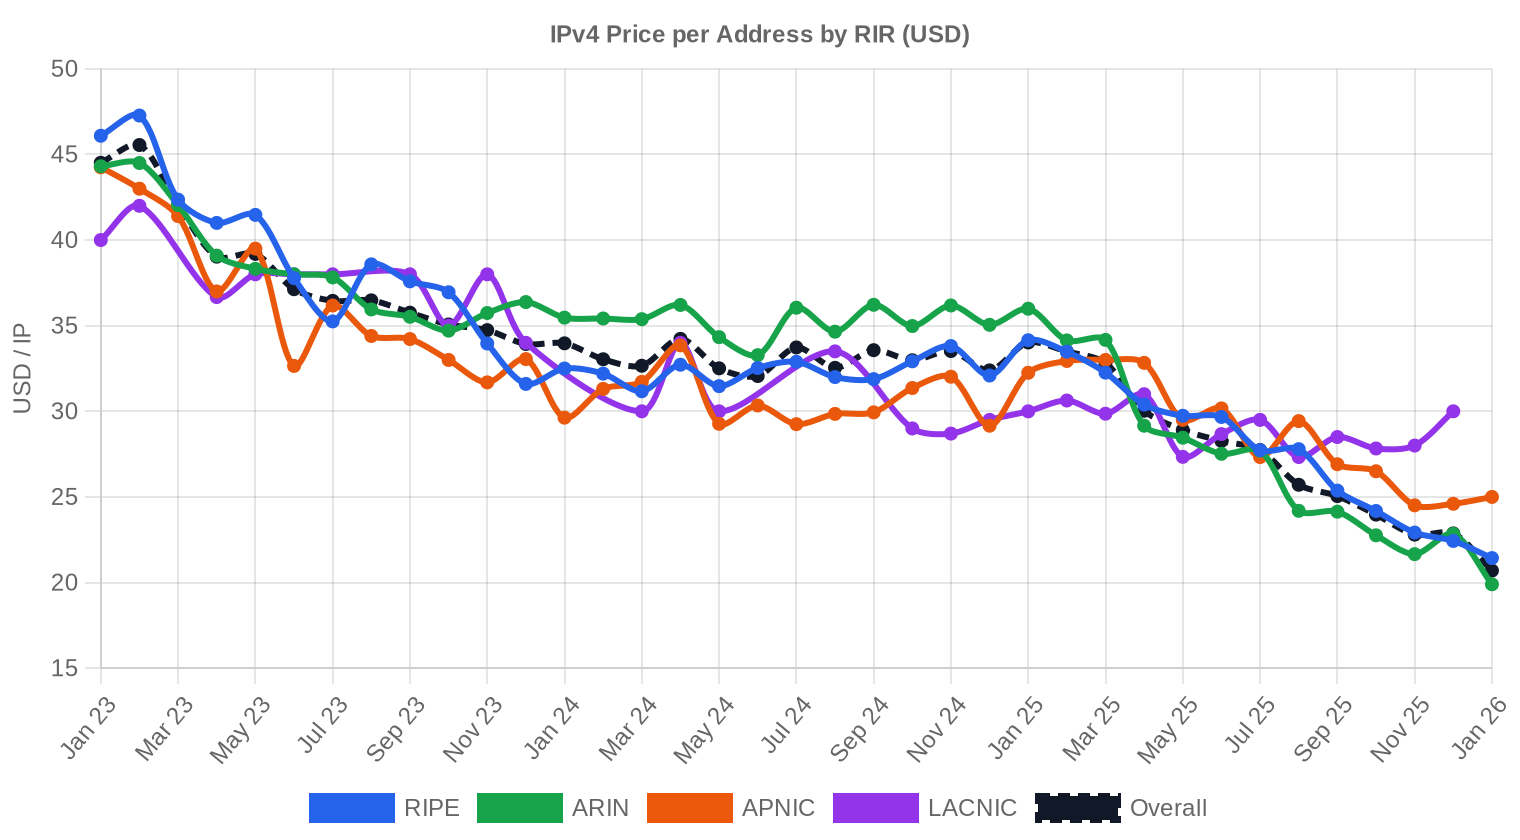
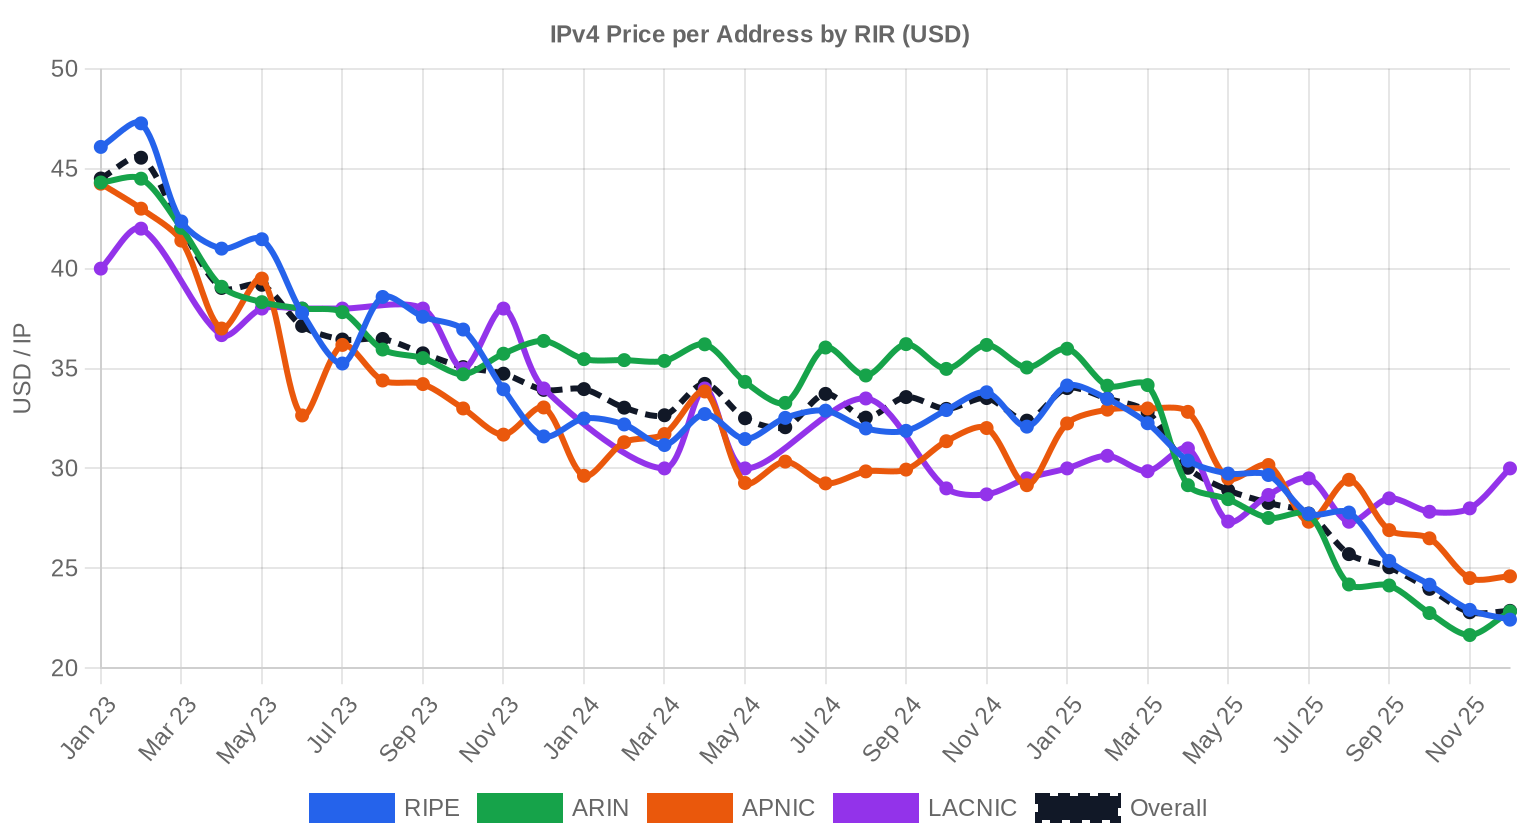
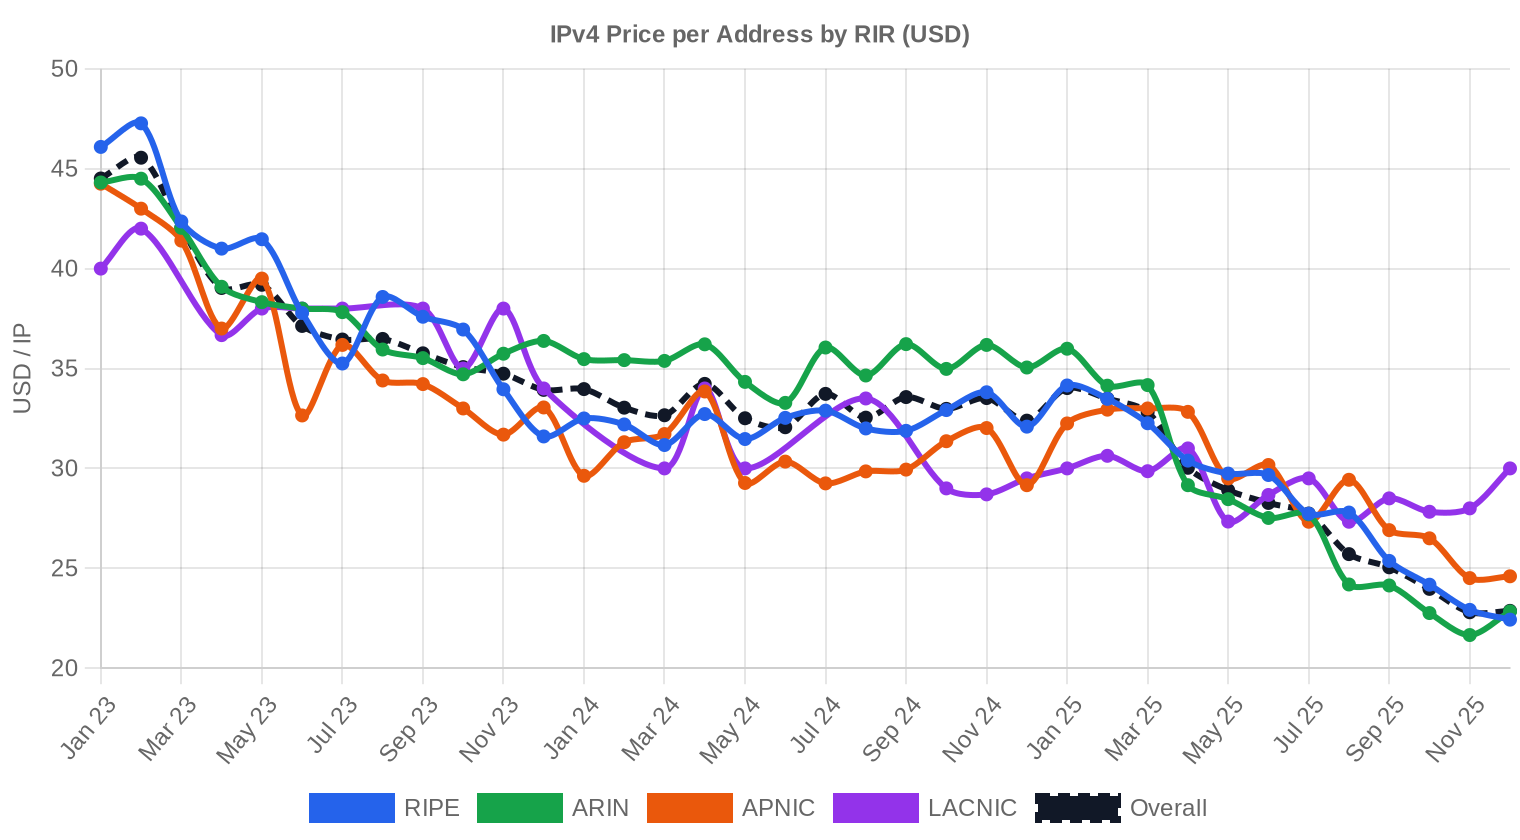
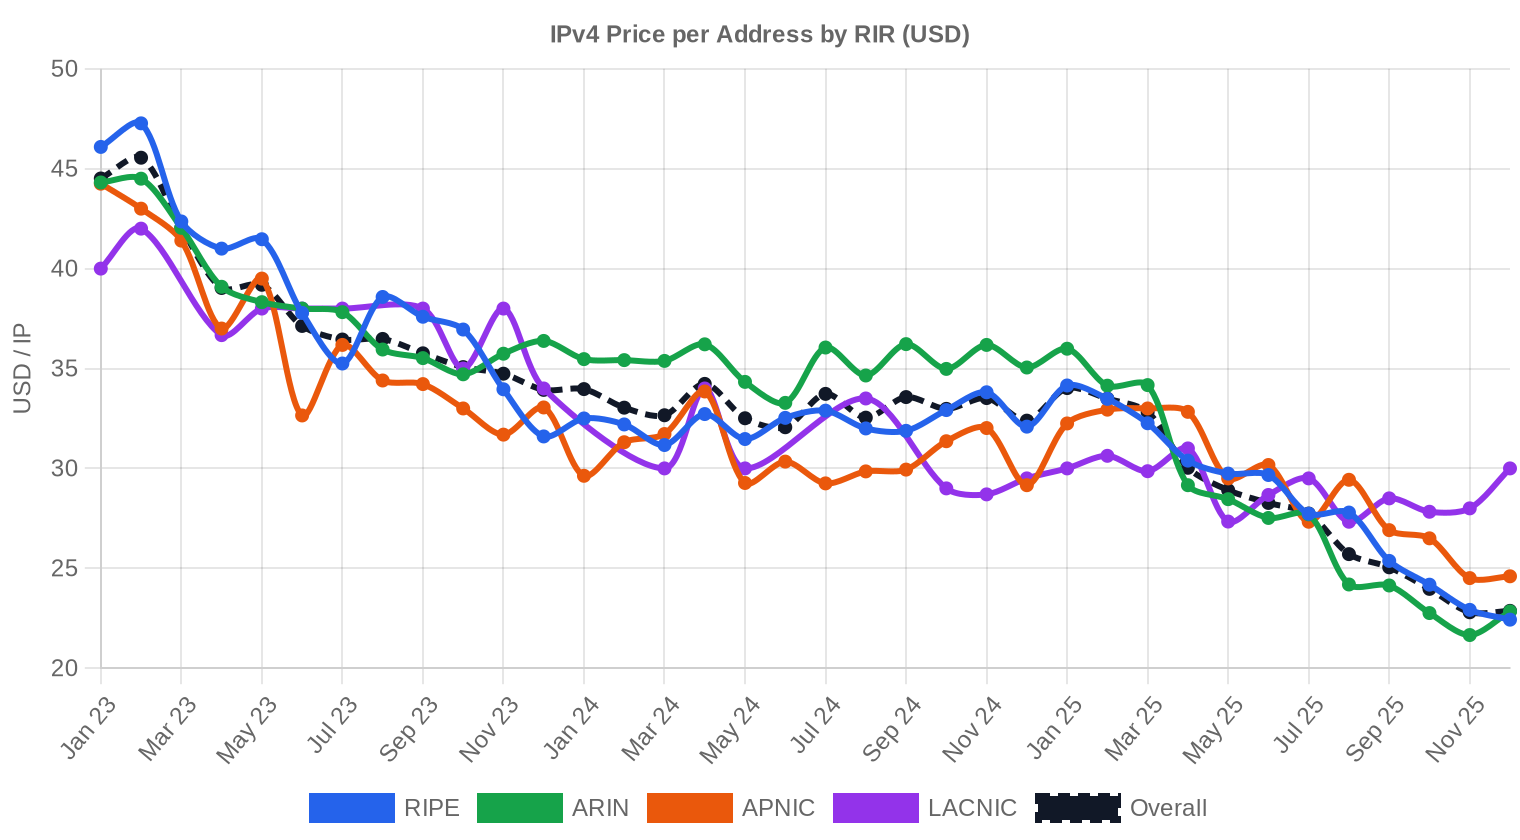
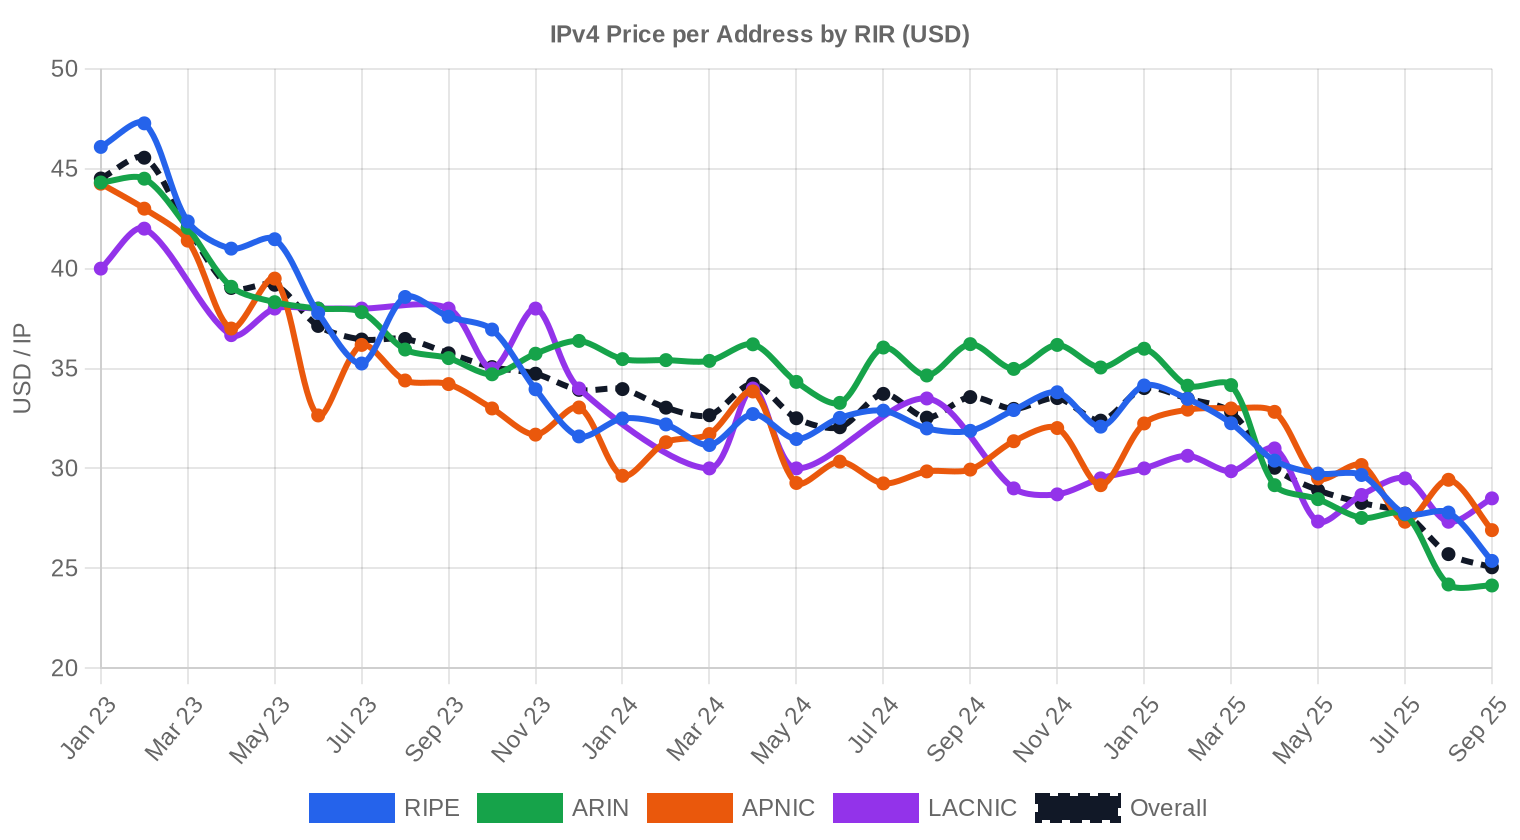
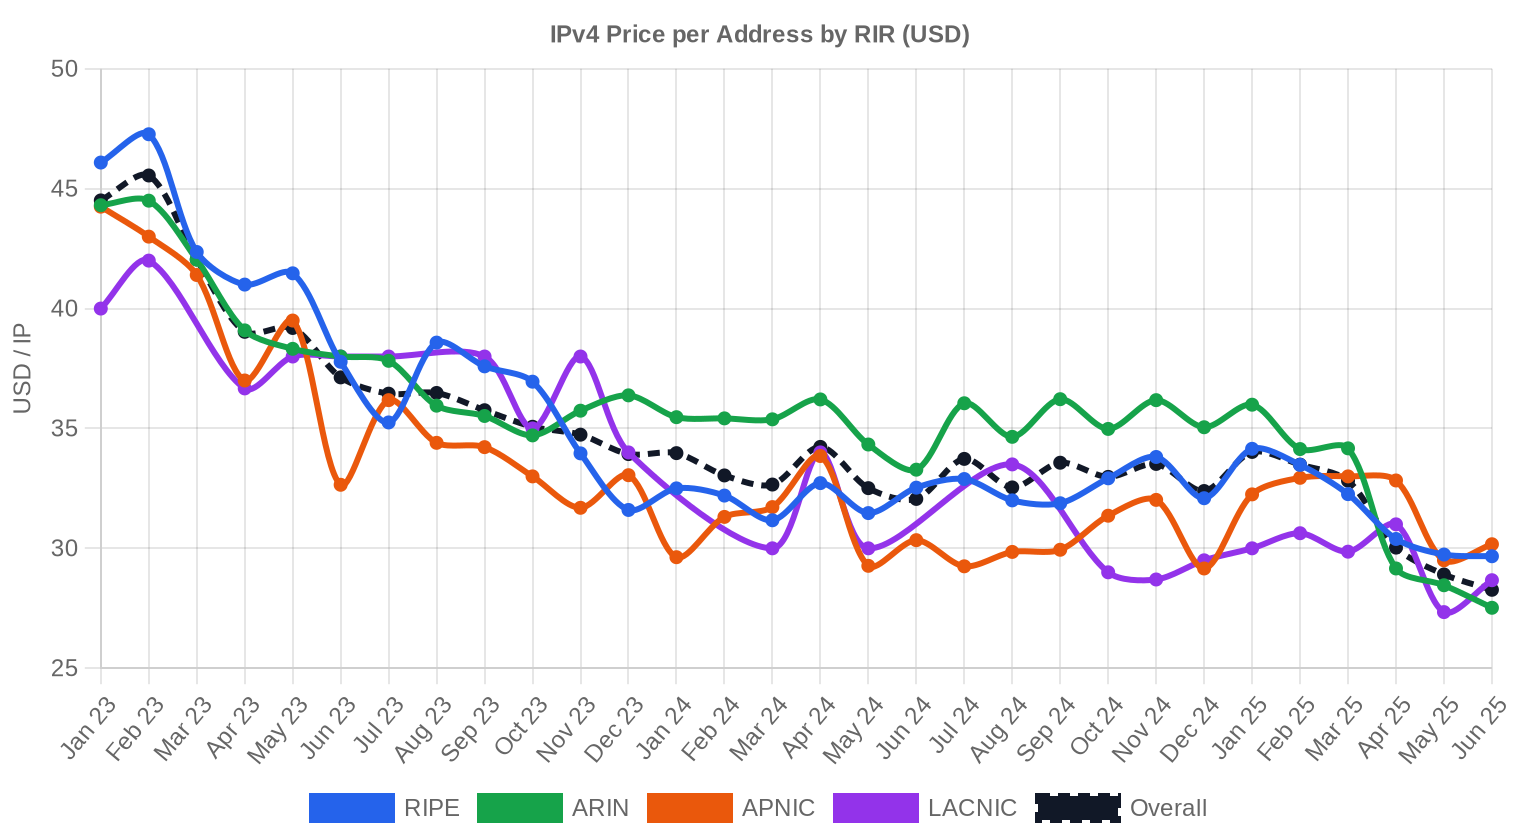
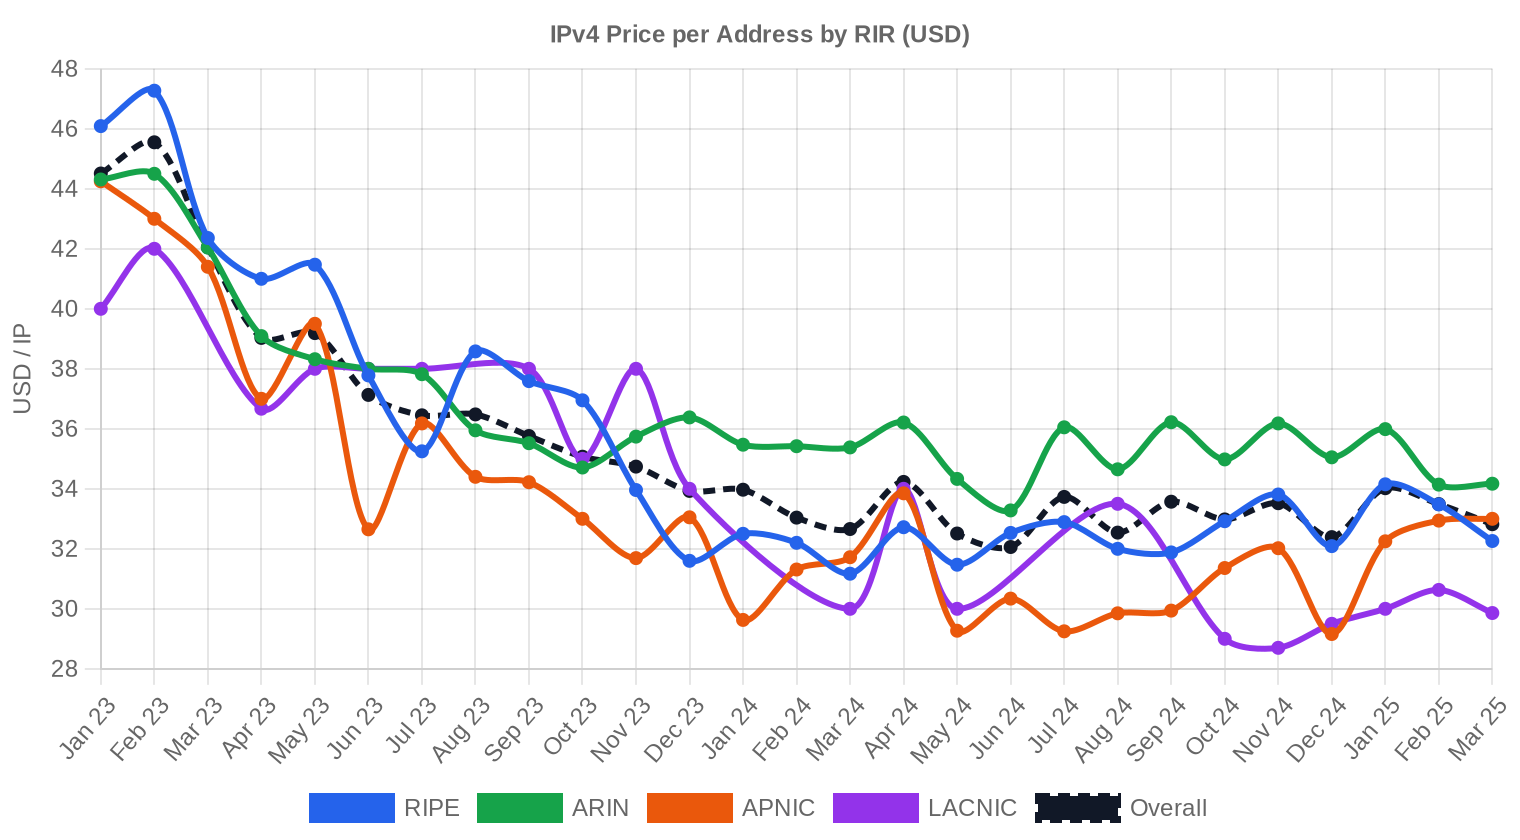
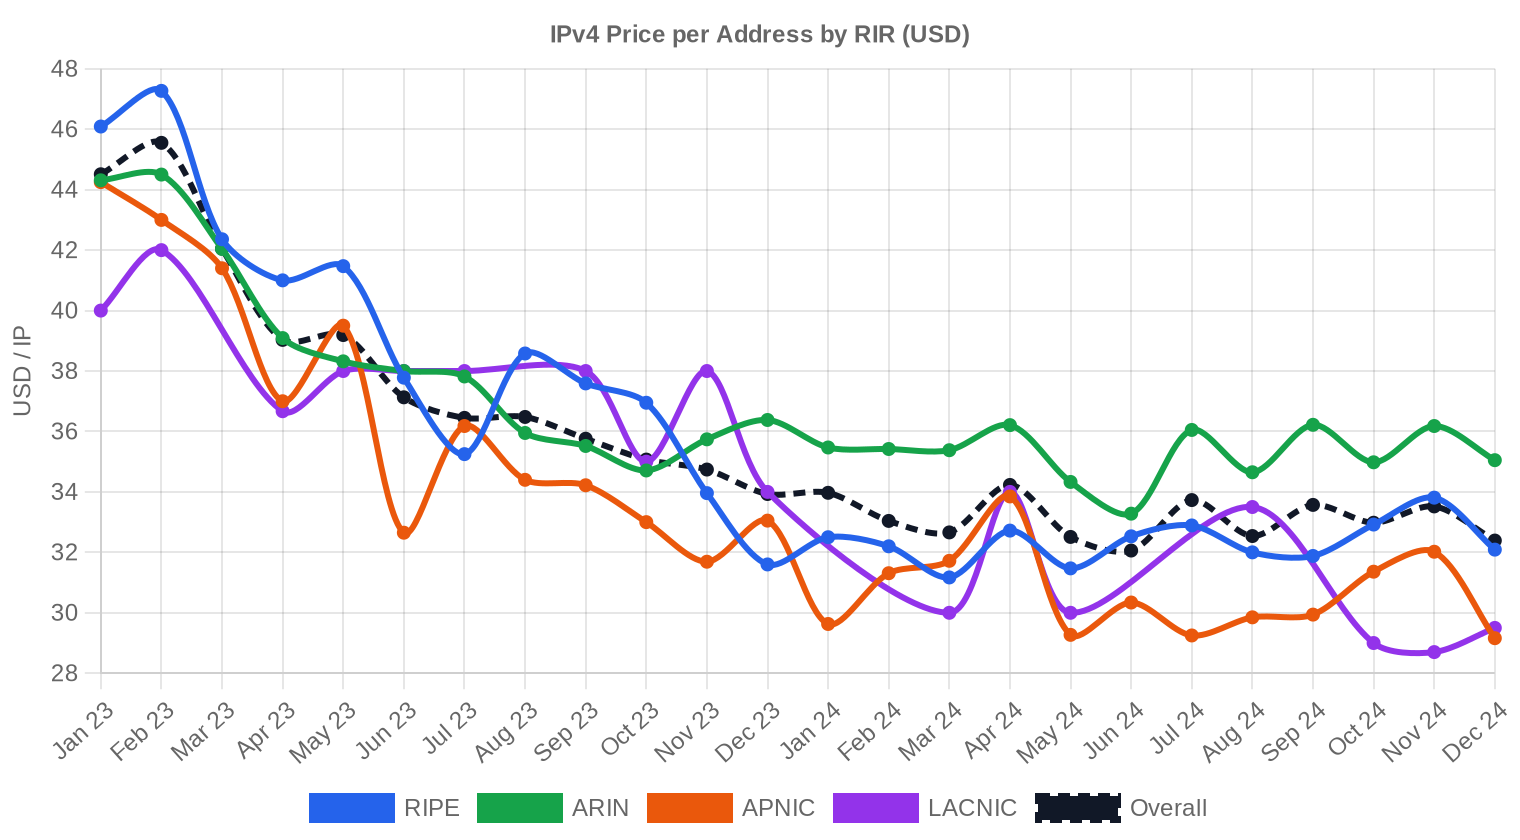
Prices ranged from $17.80 at the floor to $50.00 at the ceiling, a $32.20 spread that reflects the persistent premium gap between small, clean blocks and large legacy lots with encumbrances. The $17.80 low likely represents an oversized ARIN block sold under time pressure — the kind of deal that surfaces once or twice a half and drags the minimum down. The $50 high almost certainly sits in APNIC territory, where a small clean /24 with no blacklist history can still command a premium well above the market mean. Relative to H2 2024, the 5.6% decline in average pricing marks the steepest half-over-half drop we've tracked since the post-AWS correction began in late 2023. The regression line is pointing squarely at the mid-$20s by year-end.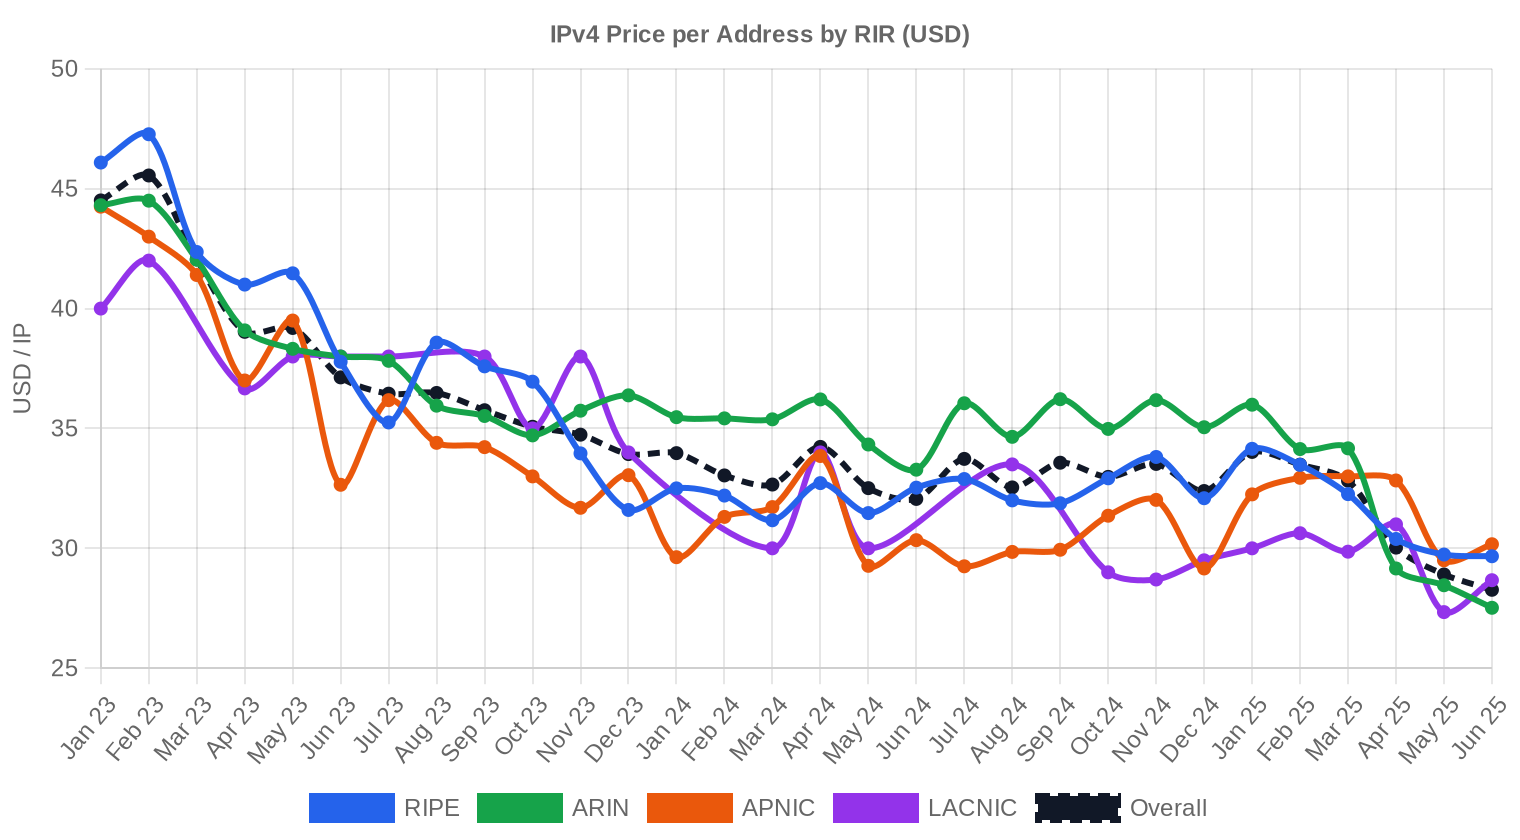
Pricing by RIR
APNIC remains the priciest registry at $32.08 average per IP, though on thin volume — just 36 transactions covering 48,384 addresses. RIPE came in at $31.64, roughly 80 cents above the global mean, with a respectable 147 deals. ARIN, as usual, dominated volume and set the market's center of gravity at $30.85 across 208 transactions and 1.43 million IPs. The ARIN-RIPE spread has compressed to $0.79 — about as narrow as we've seen in three years, which suggests ARIN supply is loosening or RIPE demand is cooling, or both. LACNIC priced at the bottom of the stack at $29.72, with a remarkably tight $27–$34.50 range across 29 deals.ARIN: $30.85 per IP across 208 transactions (49.5% of volume).
RIPE NCC: $31.64 per IP across 147 transactions (20.9% of volume).
APNIC: $32.08 per IP across 36 transactions (2.5% of volume).
LACNIC: $29.72 per IP across 29 transactions (3.2% of volume).
AFRINIC: No recorded transactions this period.
| RIR | Transactions | Avg $/IP | Median $/IP | IPs Traded | RIR Transfers | Next Month (proj.) | Year-End (proj.) |
|---|---|---|---|---|---|---|---|
| RIPE | 147 | $31.64 | $31.00 | 408,576 | 2,201 | $28.50 | $27.00 |
| ARIN | 208 | $30.85 | $30.00 | 1,434,112 | 3,284 | $26.50 | $25.00 |
| APNIC | 36 | $32.08 | $31.00 | 48,384 | 0 | $30.00 | $29.00 |
| LACNIC | 29 | $29.72 | $30.00 | 63,232 | 0 | $29.00 | $28.00 |
Transaction Volume


Supply & Block Sizes
/24 blocks dominated the market again, accounting for 144 of 420 transactions — about 34% of all deals. This is the default unit of trade for enterprises and small ISPs who need a single routable block for mail reputation, BGP announcements, or a discrete service deployment. Larger blocks (/20 and above) made up the bulk of dollar volume but were concentrated in fewer, bigger deals — 16 transactions above $1 million accounted for $39.8 million, or 80% of total market value.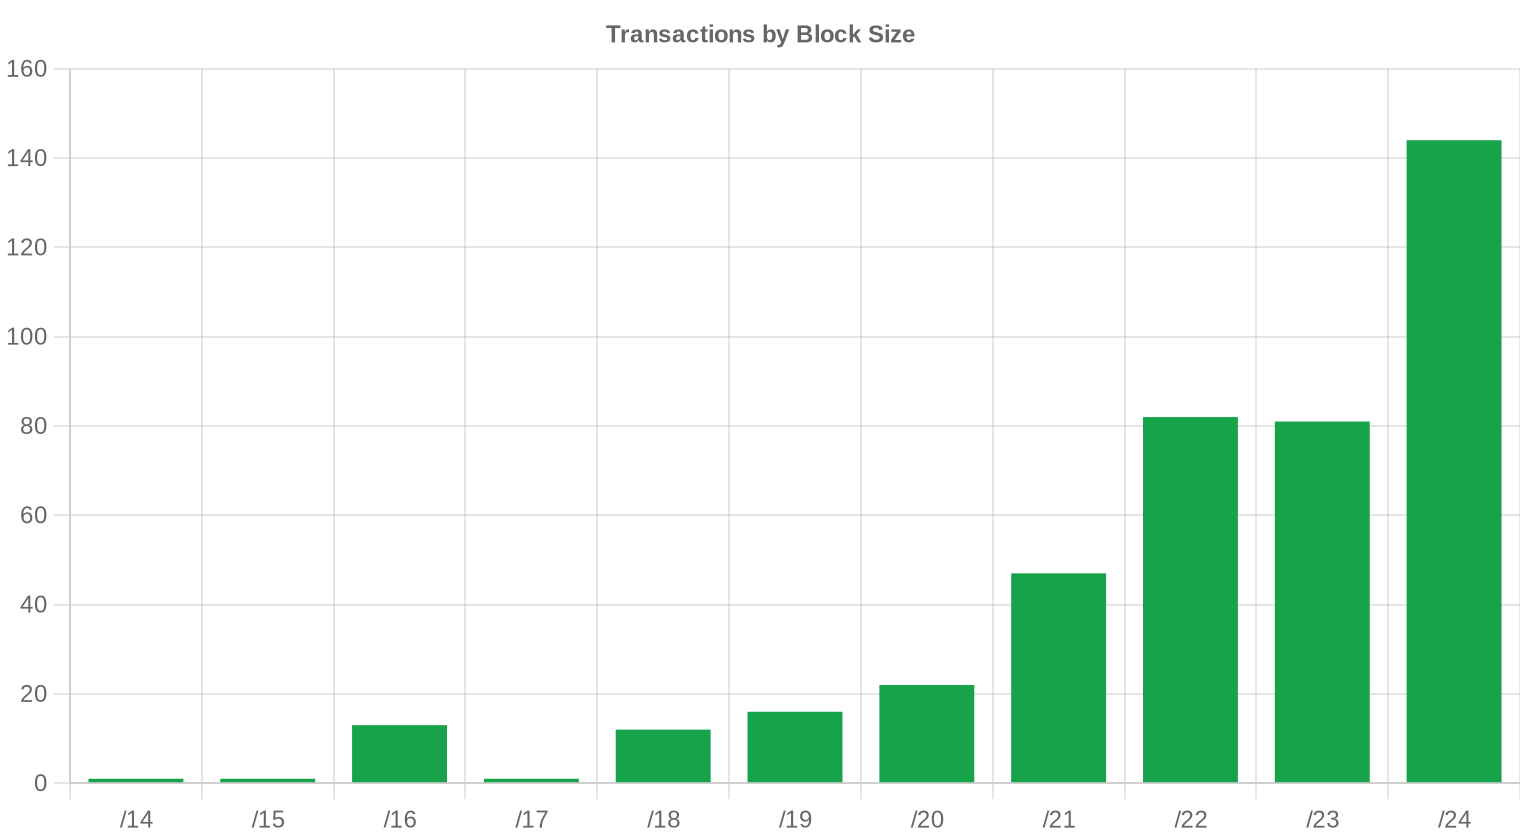
Geographic Activity
Country-level distribution data was not reported for this period. Based on RIR transaction shares, North American buyers (ARIN region) drove roughly half the market, with European (RIPE) activity making up the next largest chunk. Asia-Pacific activity through APNIC was limited to 36 deals, reflecting tighter local supply and higher price sensitivity.Registry Transfer Activity
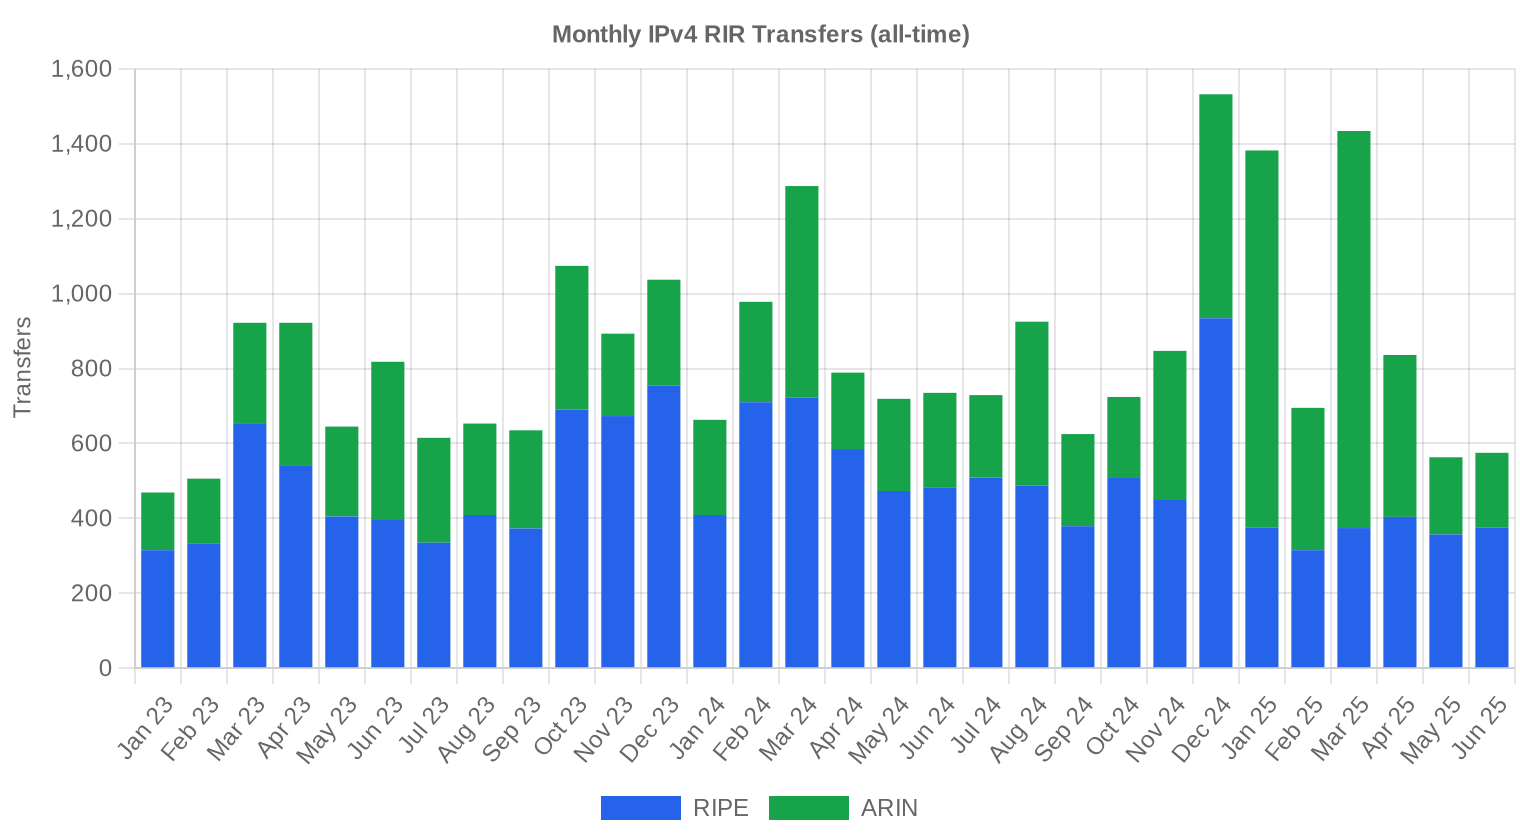
RIR-recorded transfers totaled 5,485 for the half — a figure that runs well above the 420 priced transactions in our dataset, as it includes intra-organization moves, policy-based reassignments, and transfers where pricing is not disclosed. ARIN led with 3,284 recorded transfers (59.9% of the total), followed by RIPE at 2,201. APNIC, LACNIC, and AFRINIC registered zero formal transfer records in this period's data feed.Long-Run Transfer Trends
Over the trailing 30 months, we've tracked 25,227 total RIR transfers. The peak month was December 2024, consistent with the year-end rush pattern we see every cycle as organizations clear budgets and close deals before fiscal year-end. RIPE accounts for 58.4% of total transfer volume over this window, with ARIN at 41.6% — the RIPE share is elevated partly because of the registry's more granular transfer record-keeping.| RIR | RIR Transfers |
|---|---|
| RIPE | 14,731 |
| ARIN | 10,496 |
| RIR Transfers | 25,227 |
Outlook & Forecast
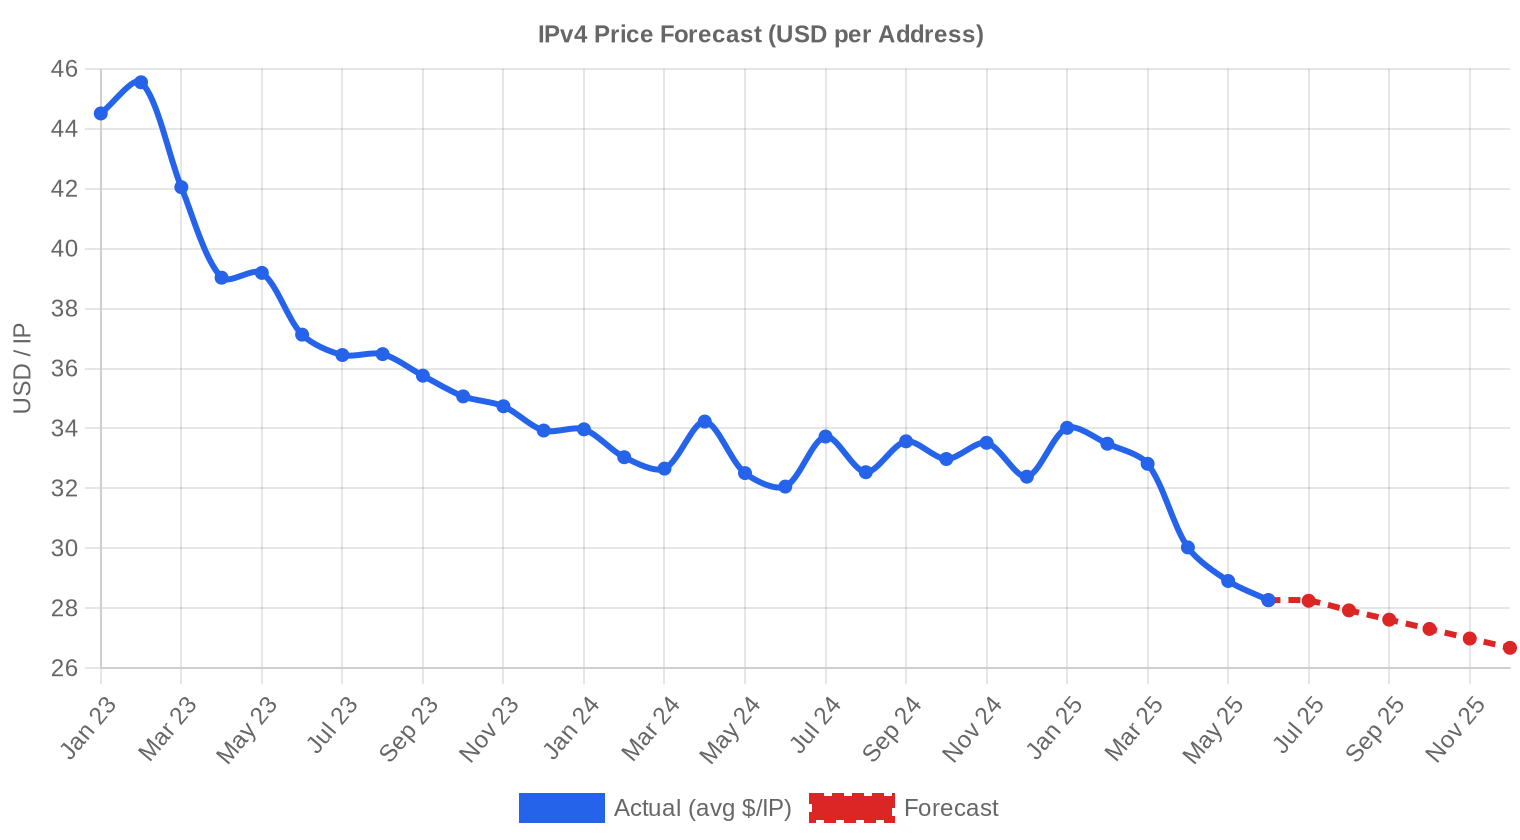
Forecasting each block-size band and RIR separately with our AI model:
The overall average price per IP is projected to reach $26.68 by December 2025, with a next-month estimate of $27.54 per IP.
- RIPE: projected at $28.50 per IP next month, trending toward $27.00 by December 2025.
- ARIN: projected at $26.50 per IP next month, trending toward $25.00 by December 2025.
- APNIC: projected at $30.00 per IP next month, trending toward $29.00 by December 2025.
- LACNIC: projected at $29.00 per IP next month, trending toward $28.00 by December 2025.
- AFRINIC: insufficient data for a reliable forecast.
Forecast by Block Size
| Block | Current $/IP | Next Month | Year-End | Confidence |
|---|---|---|---|---|
| /24 | $29.00 | $29.00 (0.0%) | $28.00 (-3.4%) | medium |
| /23 | $29.75 | $29.50 (-0.8%) | $28.50 (-4.2%) | medium |
| /22 | $27.00 | $26.50 (-1.9%) | $25.50 (-5.6%) | medium |
| /21 | $26.00 | $25.50 (-1.9%) | $25.00 (-3.8%) | low |
| /20 | $27.00 | $27.00 (0.0%) | $27.00 (0.0%) | low |
| /19 | $24.50 | $24.00 (-2.0%) | $23.00 (-6.1%) | low |
| /18-/16 | $22.00 | $21.50 (-2.3%) | $21.00 (-4.5%) | low |
| /15-up | $17.80 | $17.00 (-4.5%) | $17.00 (-4.5%) | low |
Editor's Take: Buy vs. Lease
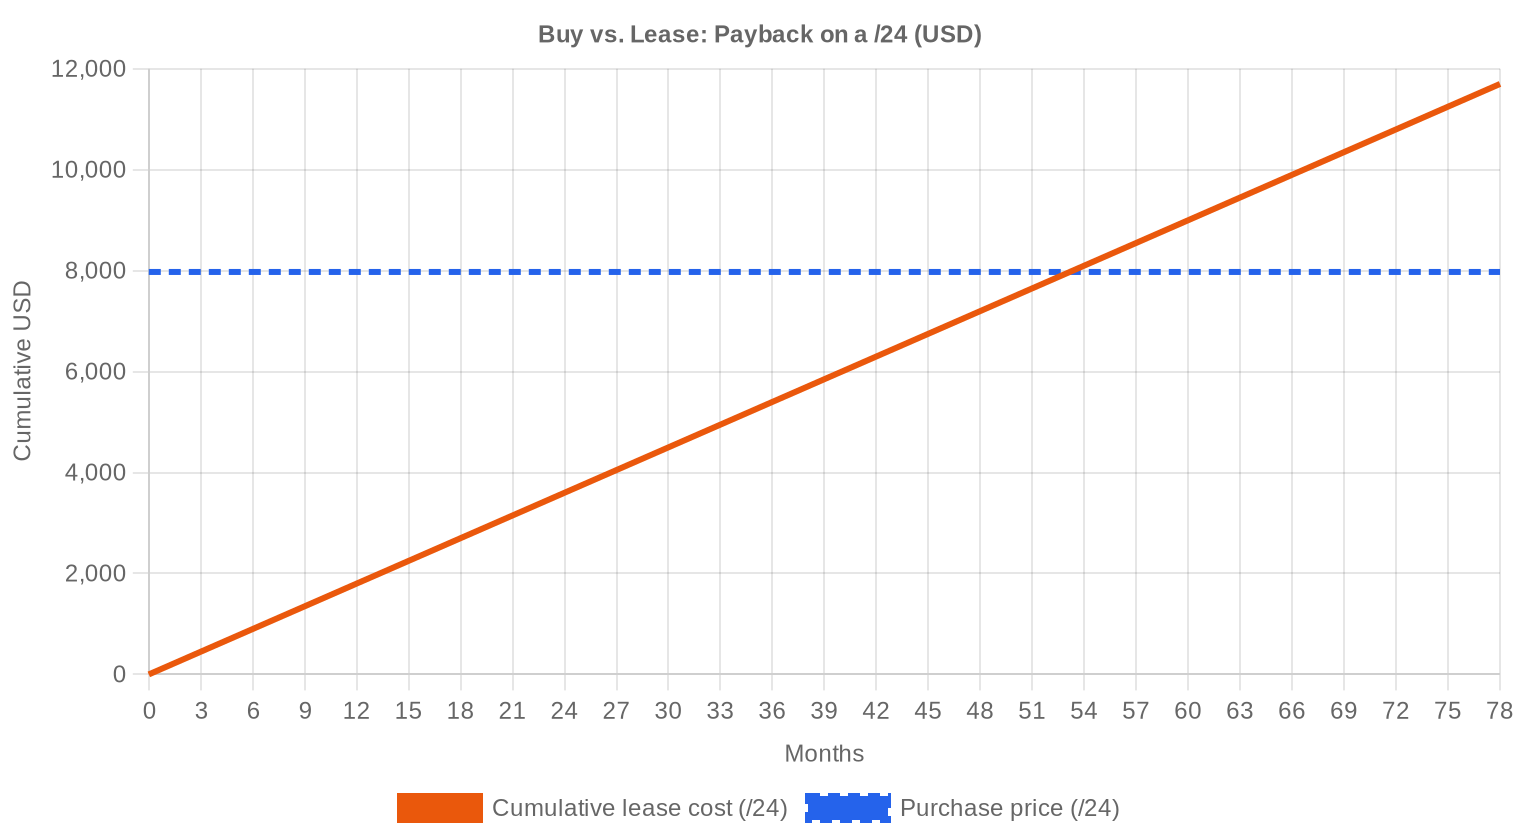
The buy-vs-lease math has shifted again this half, but still favors buying for anyone with a holding horizon beyond 4.4 years. At $31.15 per IP purchase cost and $0.5859 per IP monthly lease rate, the break-even payback is 53.2 months. That's roughly four and a half years — tight, but still on the buy side for infrastructure operators planning to hold addresses through the decade. The implied annual yield for lessors sits at 22.6%, which is extraordinary by any fixed-income standard and explains why financial buyers continue to accumulate blocks for lease-back. But here's the tension: if prices fall to $26.68 by year-end as projected, buyers who wait six months save 14% on acquisition cost while lessors face capital depreciation that eats into that 22.6% yield. For pure operators who need addresses now, buy. For speculative accumulators, the falling-knife risk is real — wait for the regression to flatten before loading up.| /24 Purchase price | $7,974 |
| /24 Lease price | $150 / mo |
| Payback period | 53.2 mo (4.4 yr) |
| Gross annual yield | 22.6% |
What This Means for You
For Buyers: You have pricing leverage you haven't had in two years. The $31 average is heading toward the mid-$20s by December if the current trajectory holds. Unless you have an urgent deployment, negotiate aggressively and consider phased acquisitions — the trend is working in your favor.For Sellers: Every quarter you hold is costing you roughly 3% in realized value. If you're sitting on blocks you don't need operationally, the time to list was last year, but today is better than next quarter. Large blocks (> /18) still command buyer interest from cloud operators and BEAD-funded ISPs, so those can be marketed at tighter spreads.
For Leasers: Monthly lease rates at $0.59 per IP ($150 per /24) remain stable even as purchase prices fall, which means the lease-vs-buy breakeven is compressing. If your need is temporary — under four years — leasing still makes financial sense. Beyond that window, purchase becomes the better play.
For Block Holders Generating Lease Income: Your yield looks phenomenal on paper at 22.6% annualized, but asset depreciation is a real drag on total return. Consider locking in longer-term lease contracts now to secure cash flow before purchase prices decline enough to pull lease rates down with them.
Browse verified IPv4 blocksSell IPv4 →
List your blocks with managed transferLease IPv4 →
Flexible short-term capacityLease Out IPv4 →
Turn idle blocks into recurring revenue
IPv4 Pricing by Block Size
The per-IP premium for /24 blocks remains substantial. A single /24 (256 IPs) trades around $7,974 — roughly $31.15 per IP at the market average. Move up to a /20 or /16 and the per-IP cost drops meaningfully as buyers gain volume efficiency. The 16 deals above $1 million this half averaged much larger block sizes, where per-IP pricing likely dipped into the mid-to-high $20s. Small-block buyers continue to pay a 15–25% premium over large-lot pricing for the convenience and routability of a standalone /24.| Block | IPs | Buy: /IP | Buy: Total | Lease: /IP/mo | Lease: Monthly |
|---|---|---|---|---|---|
| /24 | 256 | $35–45 | $8,960–11,520 | $0.38–0.50 | $97–128 |
| /22 | 1,024 | $28–38 | $28,672–38,912 | $0.33–0.45 | $338–461 |
| /20 | 4,096 | $22–32 | $90,112–131,072 | $0.30–0.40 | $1,229–1,638 |
| /18 | 16,384 | $20–30 | $327,680–491,520 | $0.30–0.38 | $4,915–6,226 |
| /16 | 65,536 | $18–28 | $1,179,648–1,835,008 | $0.30–0.35 | $19,661–22,938 |
IPv4 Price History: 2011–2026
IPv4 addresses first acquired monetary value following IANA free-pool exhaustion in 2011, initially trading in the $5–$8 range. Prices climbed steadily through the 2010s, accelerating sharply during 2021–2022 when pandemic-driven cloud demand pushed averages past $50 in some registries. The tide turned in mid-2023 when AWS began charging $0.005/hour for public IPv4 addresses — roughly $43.80 annually — which forced a repricing of how enterprises valued address holdings. We're now 18 months into that correction, with the market bifurcating between operational buyers (who still need addresses and will pay market) and speculative holders (who are watching their unrealized gains erode quarter by quarter).| Year | ~Price/IP | Key Event |
|---|---|---|
| 2011 | $7–12 | IANA free pool exhausted; Microsoft/Nortel deal ($11.25/IP) |
| 2012 | $8–12 | RIPE NCC reaches last /8; begins /22-only allocation |
| 2014 | $10–15 | LACNIC free pool exhausted |
| 2015 | $8–15 | ARIN free pool exhausted |
| 2017–18 | $12–18 | Leasing market grows; cloud demand rises |
| 2019 | $18–24 | RIPE NCC exhausts remaining free pool |
| 2021–22 | $50–60+ | Post-pandemic peak; hyperscaler build-outs |
| 2024 | $35–52 | AWS IPv4 charge ($0.005/IP/hr); large block correction |
| 2025–26 | $18–45 | Market bifurcation; /16s below $20 for first time since 2019 |
Market Structure: Who Is Buying & Selling
The buy side remains dominated by cloud infrastructure providers, mid-tier ISPs expanding footprint, and enterprises standing up private networks that require dedicated address space. The sell side is increasingly populated by legacy corporate holders who inherited allocations from the pre-commercial internet era and are monetizing unused blocks, along with bankruptcy estates and M&A dispositions. Financial intermediaries — firms that buy blocks to lease back — have become a meaningful third category, representing perhaps 15–20% of transaction volume by our estimate.IPv4 vs. Other Asset Classes
At a 22.6% annualized lease yield, IPv4 blocks outperform virtually every mainstream asset class on a current-income basis — investment-grade corporate bonds yield 5–6%, S&P 500 dividend yield sits around 1.3%, and even well-located commercial real estate rarely clears 8% cap rates. The catch is depreciation: if the underlying asset declines 14% in value over the next six months as projected, your net total return drops to roughly 8–9% annualized after capital losses. That's still respectable, but the risk profile is closer to high-yield debt than the blue-chip reputation IPv4 enjoyed two years ago.| Asset Class | Typical Yield | Liquidity | Primary Risk |
|---|---|---|---|
| IPv4 | 22.6% | Moderate | IPv6 adoption, block quality |
| Commercial Real Estate | 5–8% | Low | Vacancy, rate cycle |
| Investment-Grade Bonds | 4–5% | High | Duration, credit risk |
| S&P 500 | ~1,3% | High | Market volatility |
| Money Market / T-Bills | ~4–5% | High | Rate cycle changes |
IPv6 Adoption & Why IPv4 Remains Essential
IPv6 adoption continues its glacial crawl. Google's public statistics show roughly 45% of traffic reaching its services over IPv6, but enterprise adoption remains patchy, and most cloud service configurations still default to dual-stack or IPv4-only. The practical reality is that IPv4 and IPv6 will coexist for at least another decade, and any operator running production services needs IPv4 addresses regardless of their IPv6 deployment status.AI & Cloud Infrastructure Demand
AI infrastructure buildout is generating meaningful incremental demand for IPv4 addresses. Training clusters and inference farms require dedicated IP space for API endpoints, model-serving infrastructure, and internal service mesh connectivity. Hyperscale AI labs are not just leasing cloud capacity — many are building or colocating their own racks, which means acquiring address space directly rather than relying on a cloud provider's pool. This demand segment didn't exist three years ago and now represents a growing fraction of ARIN-region transactions.What Determines IPv4 Block Value
Block valuation depends on several concrete factors beyond size. Blacklist and spam-reputation history can knock 10–20% off an otherwise clean block's price — buyers run Spamhaus and UCEPROTECT checks as standard diligence. Allocation vintage matters too: older blocks with long, traceable WHOIS histories tend to command premiums because they signal legitimacy to receiving networks. RIR transferability rules, particularly RIPE's 24-month holding period, also affect pricing by constraining near-term supply of recently acquired blocks.Sell vs. Lease: A Decision Framework
In a declining-price environment, selling now locks in value before further erosion — a holder sitting on a /20 at $31/IP today could be looking at $27/IP by December. Leasing makes more sense if you believe the price decline will stabilize and you want to capture that 22.6% annualized cash flow while retaining ownership. The optimal strategy for large holders may be a hybrid: sell a portion of excess inventory at current levels to monetize before further drops, and lease the rest to generate income while waiting for a price floor to form.| /24 Purchase price | $7,974 |
| /24 Lease price | $150 / mo |
| Payback period | 53.2 mo (4.4 yr) |
| Gross annual yield | 22.6% |
RIPE NCC 24-Month Transfer Restriction
RIPE NCC's 24-month holding requirement continues to act as a supply throttle in the European market. Any block transferred within the RIPE region cannot be re-transferred for two years, which locks up inventory and prevents the kind of rapid block-flipping that can occur in ARIN. This rule partly explains why RIPE pricing ($31.64) still runs above ARIN ($30.85) despite the broader downtrend — constrained supply supports price even when demand cools.Deal Size Distribution
Average deal size jumped to $118,333 — up 24.7% from $94,902 in H2 2024 and nearly double the $63,595 average from H1 2024. The distribution is heavily skewed: 307 transactions (73%) fell below $50,000 and accounted for just $5.1 million in value, while 16 deals above $1 million generated $39.8 million — 80% of total market value. The market is increasingly bifurcated between a high-frequency small-block segment and a low-frequency whale segment where a handful of large transfers move the needle on aggregate volume and pricing.Top Trading Countries
Country-level transaction data was not available for this reporting period. Historically, the United States dominates ARIN-region activity, with Canada and Brazil contributing smaller shares. In the RIPE zone, the UK, Germany, and the Netherlands consistently rank as the most active markets, driven by dense hosting and ISP ecosystems.BEAD Broadband Program Impact
The $42.45 billion BEAD broadband program is beginning to move from award phase to procurement phase, and ISPs building out last-mile infrastructure will need IPv4 addresses for CPE management, CGNAT deployments, and customer-facing services. Mid-size blocks (/20 to /18) are the sweet spot for BEAD-funded buildouts, and we expect this demand to begin hitting the market in earnest in H2 2025 and into 2026. For sellers holding blocks in this size range, BEAD-funded buyers represent a motivated, well-capitalized counterparty — potentially the best exit opportunity of the next 12 months.Hyperscaler IPv4 Holdings
Amazon, Microsoft, and Google collectively hold millions of IPv4 addresses — Amazon alone is estimated to control over 100 million. AWS's decision to charge for public IPv4 usage has already depressed external market demand by making enterprises rationalize their address consumption, and any large-scale release of hyperscaler-held blocks could accelerate the downward price trend. For now, the hyperscalers appear to be holding, but their inventory represents a latent supply overhang that the market cannot ignore.Macroeconomic Conditions & Market Impact
Interest rates in the US and EU have begun easing from their 2023–2024 peaks, which should support IT capital expenditure budgets in H2 2025. Lower borrowing costs make large infrastructure purchases — including IPv4 blocks — more palatable for debt-funded ISPs and data center operators. That said, enterprise IT spending remains cautious outside of AI-related line items, which is contributing to the overall softness in IPv4 demand from traditional buyers.Model Update & Calibration
We reviewed our past projections against actual market outcomes and recalibrated the model for this report. The updated model places more weight on recent price movements using exponential decay, dynamically adjusts prediction bands to reflect current market conditions, and corrects for any systematic bias detected in earlier forecasts. The predicted-vs-actual comparison chart below shows how closely our past estimates tracked reality.

| Report Period | Target Month | Predicted | Actual | Deviation |
|---|---|---|---|---|
| 2024 | 2025-01 | $33 | $34 | -4% |
| 2024-Q2 | 2024-07 | $31 | $34 | -7% |
| 2024-Q3 | 2024-10 | $33 | $33 | -1% |
| 2024-H2 | 2025-01 | $33 | $34 | -4% |
| 2024-Q4 | 2025-01 | $33 | $34 | -4% |
| 2025-Q1 | 2025-04 | $33 | $30 | +9% |
Methodology
Figures are based on completed IPv4Center marketplace transactions and RIR transfer statistics. Prices are in US dollars per IP address. Forecasts are produced by an AI model that analyses each block-size band and RIR segment separately (with outlier-trimmed medians) alongside known market catalysts; they are estimates, not guarantees.
Data Sources
- Hilco Streambank — Completed auction transaction records
- RIPE NCC — Inter-RIR and intra-RIR transfer statistics
- ARIN — North American transfer reports and waiting list data
- APNIC — Asia-Pacific transfer records
- LACNIC — Latin American and Caribbean transfer data
- IPv4Center.com — Proprietary marketplace transaction and lease pricing data
This report is generated automatically for informational purposes only and does not constitute financial advice.
Frequently Asked Questions
What was the average price per IPv4 address in H1 2025?
The market-wide average settled at .15 per address, with a median of .00 — a remarkably tight spread that signals genuine price consensus. The overall trend for the period was down, with prices declining approximately 1.1% as supply continued to outpace incremental demand.
How many IPv4 transactions closed in the first half of 2025?
We tracked 420 priced transactions encompassing roughly 1.95 million addresses and approximately .7 million in aggregate deal value. The average deal size was approximately 118,333 addresses, though that figure is heavily skewed by a handful of large ARIN block trades.
Which RIR region commanded the highest per-IP prices in H1 2025?
APNIC addresses were the priciest at .08 per IP on average, edging out RIPE at .64 and ARIN at .85. The premium reflects constrained supply in the Asia-Pacific region and the additional compliance friction involved in inter-RIR transfers into APNIC space.
Why is ARIN so dominant by transaction volume when it's not the priciest region?
ARIN accounted for 49.5% of all transactions (208 of 420) and roughly 1.43 million of the 1.95 million addresses traded. North American blocks tend to be larger and more plentiful on the secondary market, and ARIN's transfer policy — while not frictionless — is well understood by institutional buyers. Volume begets liquidity, which begets more volume.
What does the price range of .80 to .00 per IP tell us about market segmentation?
It tells us block size still matters enormously. The .80 floor likely reflects large legacy /16 or bigger blocks sold in bulk via ARIN, where per-unit economics favor the buyer. The .00 ceiling was also in ARIN, probably a clean small block — a /24 or modest /23 — with pristine reputation and no encumbrances. APNIC also hit .00 on the high end.
How did RIPE NCC transfers compare to ARIN transfers in H1 2025?
RIPE recorded 147 priced transactions covering about 409K addresses at an average of .64 per IP, while ARIN logged 208 transactions covering 1.43 million addresses at .85. In the broader transfer ledger (including non-priced administrative moves), ARIN posted 3,284 transfers versus RIPE's 2,201 — together accounting for virtually all registered transfer activity.
Were there any AFRINIC market transactions in H1 2025?
Zero. AFRINIC recorded no priced transactions and no registered transfers in our dataset. The region remains effectively frozen for secondary-market activity amid ongoing governance and legal challenges. Buyers seeking African-region addresses continue to route around this by using RIPE or ARIN space.
What was the most popular block size traded?
The /24 (256 addresses) was the most frequently transacted prefix, appearing in 144 of the 420 deals — roughly 34% of all transactions. This is consistent with /24 being the smallest independently routable block on the public internet and the default unit for small-to-mid-size operators.
What mistakes should buyers avoid in the current market environment?
The biggest mistake is overpaying for small blocks when prices are trending down. With our forecast pointing to .54 next month and .68 by year-end 2025, urgency premiums are hard to justify. Buyers should also avoid neglecting reputation checks — a block with a blacklisted history can cost more to clean than the discount it was purchased at.
What are the risks of waiting too long to buy if prices are declining?
The risk is modest but real: a sudden supply contraction or regulatory change (e.g., tighter ARIN needs-assessment enforcement) could snap prices back upward. More practically, specific high-quality blocks — clean /22s or /21s with good geolocation — may sell even as average prices soften. Waiting for the absolute bottom is a fool's errand in any illiquid market.
Is it cheaper to lease or buy IPv4 addresses at current rates?
At the current lease rate of .59 per IP per month (0/month for a /24) and a purchase price of .15 per IP, the buy-versus-lease breakeven is approximately 53 months — about 4.4 years. If you expect to need the addresses for longer than that, buying is the clear economic winner. Our model's verdict: buy.
What annual yield does an IPv4 block generate if leased out at current market rates?
Approximately 22.6% annually, based on a .15 acquisition cost and .03 per IP in annual lease revenue. That's an eye-catching return, though it assumes full occupancy, no churn, and stable lease pricing — assumptions that deserve scrutiny as IPv6 adoption creeps forward.
What are the risks of treating IPv4 addresses as a yield investment?
The obvious risk is asset depreciation. Our year-end 2025 forecast of .68 implies roughly a 14% capital loss from the current .15 average, which would eat significantly into that 22.6% gross yield. There's also counterparty risk on leases and the long-tail risk that accelerating IPv6 deployment erodes demand for leased IPv4 space entirely.
Where is the IPv4 price headed by year-end 2025?
Our forecast model, which we rate as reliable, projects the average price declining to approximately .54 in the near term and .68 by December 2025. That represents a meaningful pullback from the current .15 average and extends the downward trend observed across H1.
How is the deal-size distribution shaping up in H1 2025?
The market is bifurcated. A long tail of 307 transactions (73%) fell below K in deal value, representing just .1 million in aggregate — the retail tier. At the other extreme, 16 deals exceeded million each and accounted for .8 million, or roughly 80% of total market value. The institutional end of this market is where the real capital flows.
How does LACNIC pricing compare to the rest of the market?
LACNIC was the cheapest region at .72 per IP on average across 29 transactions, with a tight range of .00 to .50. The discount likely reflects lower demand for Latin American–geolocated addresses and a thinner buyer pool. The median of .00 was essentially in line with ARIN.
What drove the 1.1% price decline in H1 2025?
No single catalyst — more of a grinding rebalancing. Supply continues to trickle into the market from legacy holders monetizing unused allocations, while demand growth has moderated as cloud providers increasingly deploy IPv6-capable infrastructure. The 1.1% decline is modest, but the directional signal is clear.
Should enterprises accelerate IPv6 deployment instead of buying more IPv4?
From a pure cost-of-capital perspective, buying IPv4 at .15 and using it for 5+ years still pencils. But the strategic calculus is shifting. Every dollar spent on IPv4 is a dollar not invested in dual-stack or IPv6-native infrastructure. For greenfield deployments, IPv6 is the rational choice; for brownfield operations with legacy dependencies, IPv4 procurement remains a necessary evil.
What does the transfer registry data (5,485 total transfers) tell us beyond priced transactions?
It tells us the priced market is the tip of the iceberg. Only 420 of 5,485 registered transfers had associated pricing — roughly 7.7%. The remainder includes intra-company reorganizations, M&A-related transfers, and administrative moves. ARIN led with 3,284 total transfers (59.9%) versus RIPE's 2,201 (40.1%). APNIC, LACNIC, and AFRINIC registered zero non-priced transfers in our dataset.
How long does a typical IPv4 transfer take to complete?
Timelines vary by RIR. ARIN transfers generally close in 30–60 days, assuming clean documentation and satisfied needs assessment. RIPE transfers can be faster — sometimes 2–3 weeks — due to a more streamlined policy. APNIC inter-RIR transfers are the slowest, frequently stretching past 90 days. Factor these timelines into any deployment plan.
What should buyers watch for when acquiring ARIN blocks specifically?
ARIN's needs-based justification requirement remains the primary gating factor. Buyers must demonstrate a 24-month utilization plan, and ARIN staff review these with real scrutiny. Also note that ARIN posted a price range of .80 to .00 in H1 — the widest of any RIR — so due diligence on block size, reputation, and geolocation is critical to avoid overpaying.
What risks does the AFRINIC governance situation pose to the broader market?
Direct pricing impact is minimal — AFRINIC had zero transactions in H1 2025 and negligible historical volume. The real risk is precedential: if AFRINIC's governance crisis results in policy frameworks that restrict or revoke legacy holdings, it could spook holders in other regions and either accelerate or freeze supply depending on how holders react. It's a tail risk, but one worth monitoring.
Is the December 2024 peak month for transfers a seasonal pattern?
Our 30-month transfer history data flagged December 2024 as the peak month for total transfers. Year-end spikes are a recurring phenomenon — driven by budget-flush cycles, tax-year optimization, and enterprises closing out procurement backlogs. Don't confuse seasonal volume with a demand signal; Q1 typically normalizes.
At 0 per month, is leasing a /24 still viable for small operators?
It depends on the use case. At ,800 per year for 256 usable addresses, the per-IP annual cost is about .03 — manageable for a hosting provider or ISP generating revenue per IP. For a small enterprise that just needs a handful of public-facing addresses, a /24 lease is overkill; NAT or a smaller allocation via your upstream provider is more economical.
What's the single most important number in this report?
The year-end forecast of .68. If it holds, it implies a further 14% decline from current levels and would mark the most significant annual price erosion the IPv4 market has seen in years. For buyers, that's a green light to be patient. For holders and lessors, it's a prompt to stress-test portfolio assumptions.