15 min read
This report analyzes the IPv4 transfer market for May 2026, based on completed IPv4Center marketplace transactions and official RIR transfer records.
Executive Summary
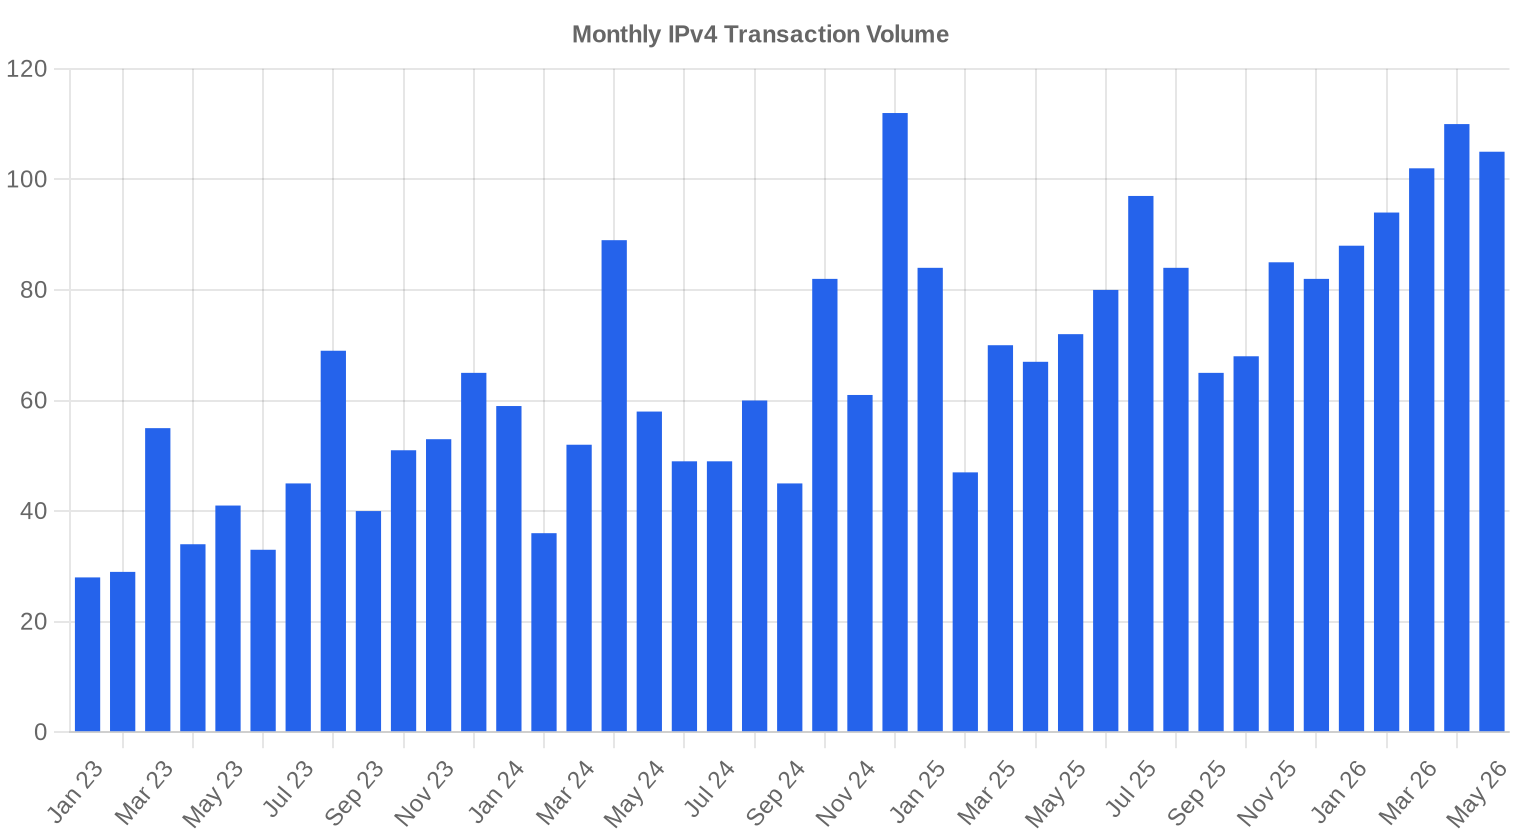
The IPv4 transfer market posted 105 transactions in May 2026, moving 402,688 addresses at a weighted average of $19.57 per IP — virtually flat against April's $19.47 (+0.1%) but down a striking 32.3% from May 2025's levels. Total transaction value came in at $5.75 million. The median held at $19.50, tight against the average, which signals a market that has largely found its clearing level after two years of sustained compression. Transaction volume slipped 4.5% from April, and the overall trend remains firmly down.Market Overview
| Transactions | 105 |
| IP Addresses Traded | 402,688 |
| Estimated Market Value | $5,745,222 |
| Average Price / IP | $19.57 |
| Median Price / IP | $19.50 |
| RIR Transfers | 587 |
Year-over-Year Comparison
| Metric | This period | A year earlier (May 2025) | Change |
|---|---|---|---|
| Transactions | 105 | 72 | +45.8% |
| IP Addresses Traded | 402,688 | 444,672 | -9.4% |
| Estimated Market Value | $5,745,222 | $9,098,981 | -36.9% |
| Average Price / IP | $19.57 | $28.91 | -32.3% |
| RIR Transfers | 587 | 563 | +4.3% |
Price Dynamics
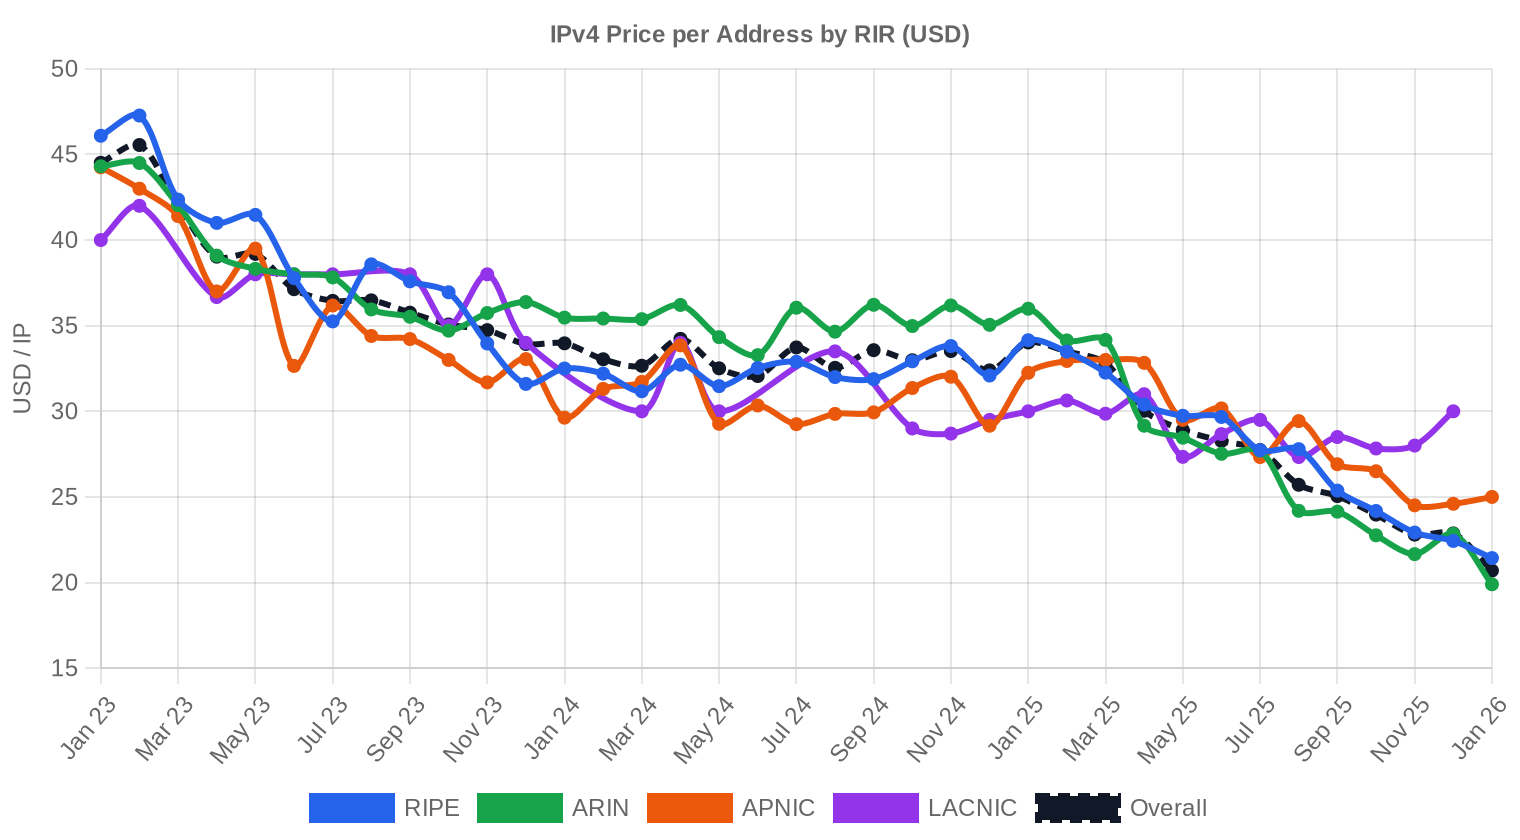
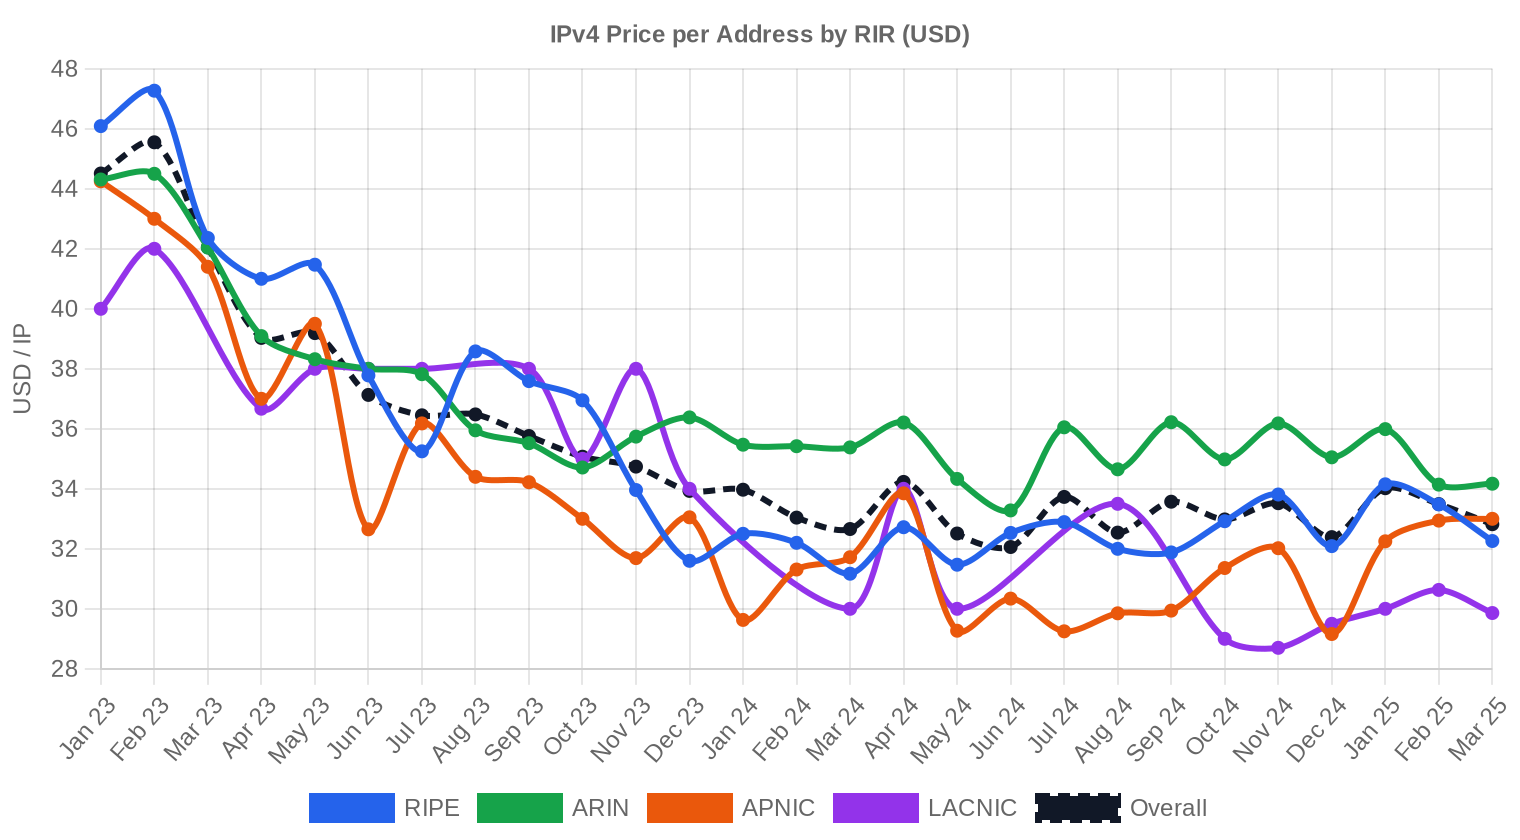
The spread between the cheapest and most expensive addresses traded in May was enormous: $10 to $41 per IP. That $41 ceiling showed up in ARIN, likely a clean /24 with legacy provenance — the kind of block that still commands a premium even in a buyer's market. The floor at $10 also originated in ARIN, probably a larger aggregated block where per-IP pricing naturally compresses. The regression line is basically flat month-over-month (+$0.10), which tells us the rapid price erosion that characterized late 2024 and most of 2025 has slowed to a crawl. We're in a grinding, low-volatility regime now. The 32.3% year-over-year decline — from roughly $28.90 in May 2025 — represents the market still digesting the structural demand shift triggered by AWS's public IPv4 charge and the broader industry reckoning with address economics.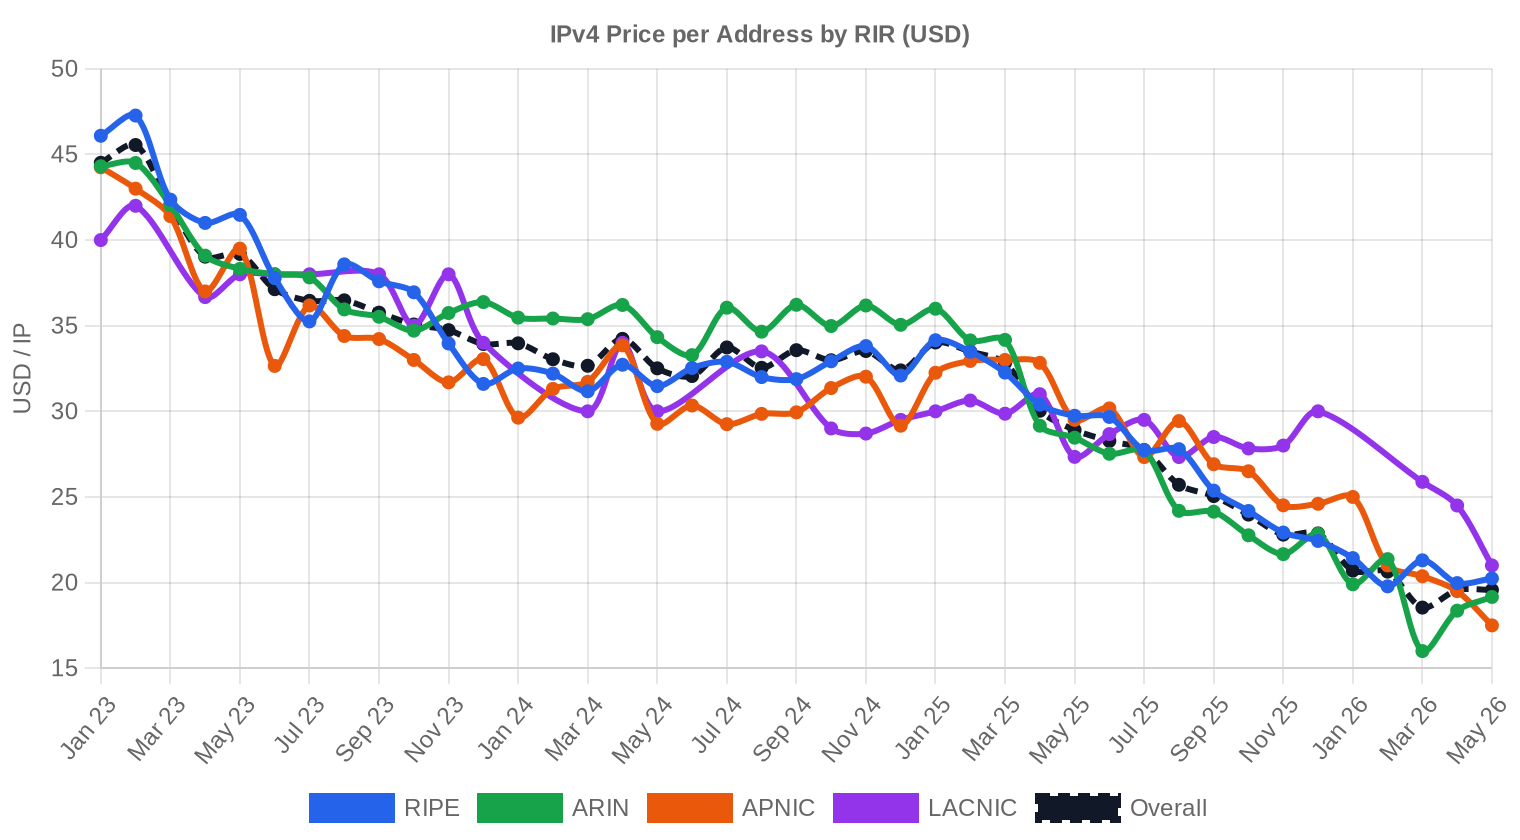
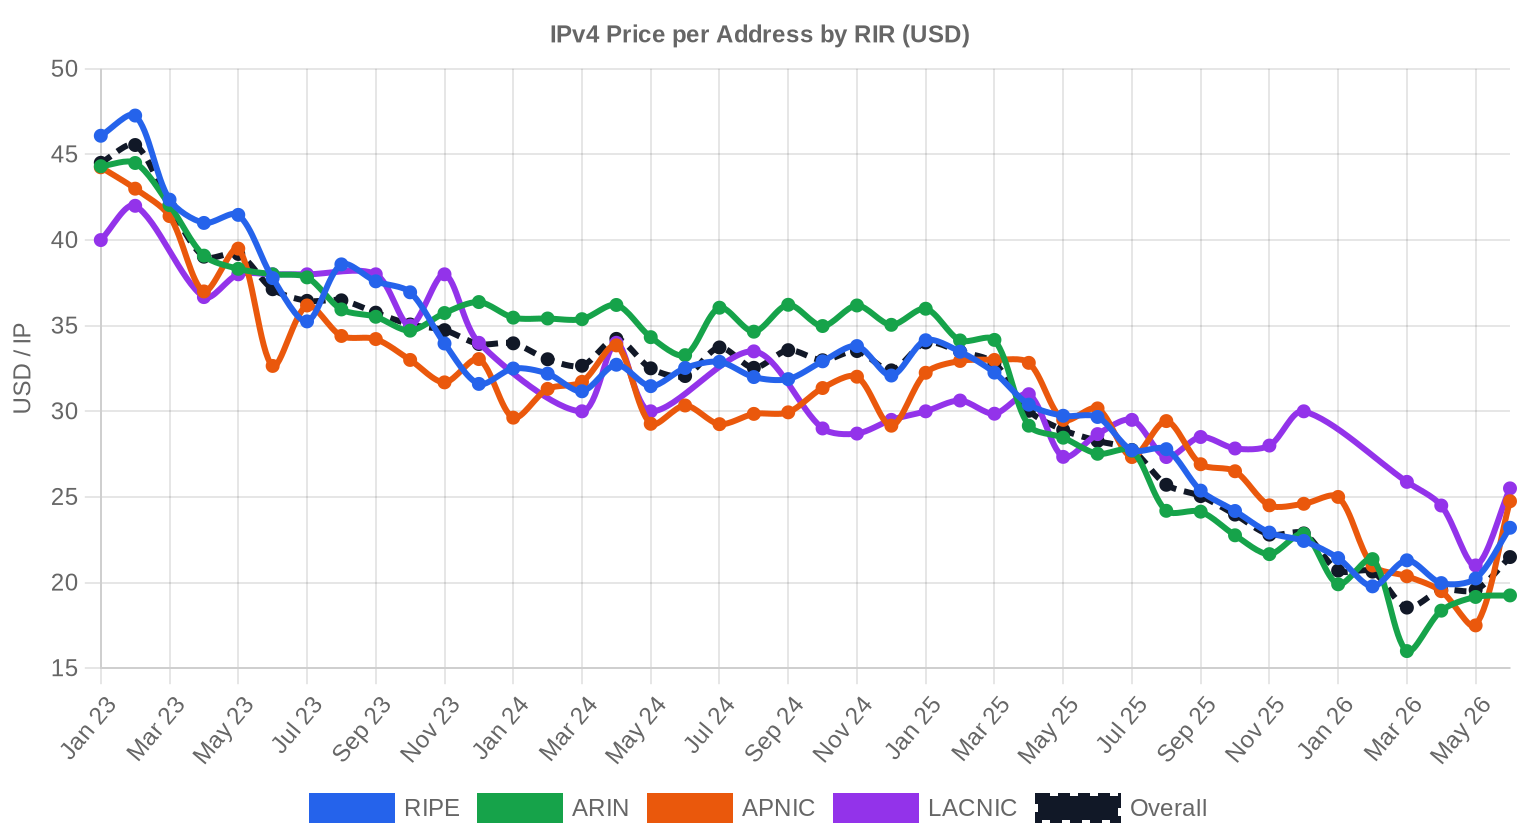
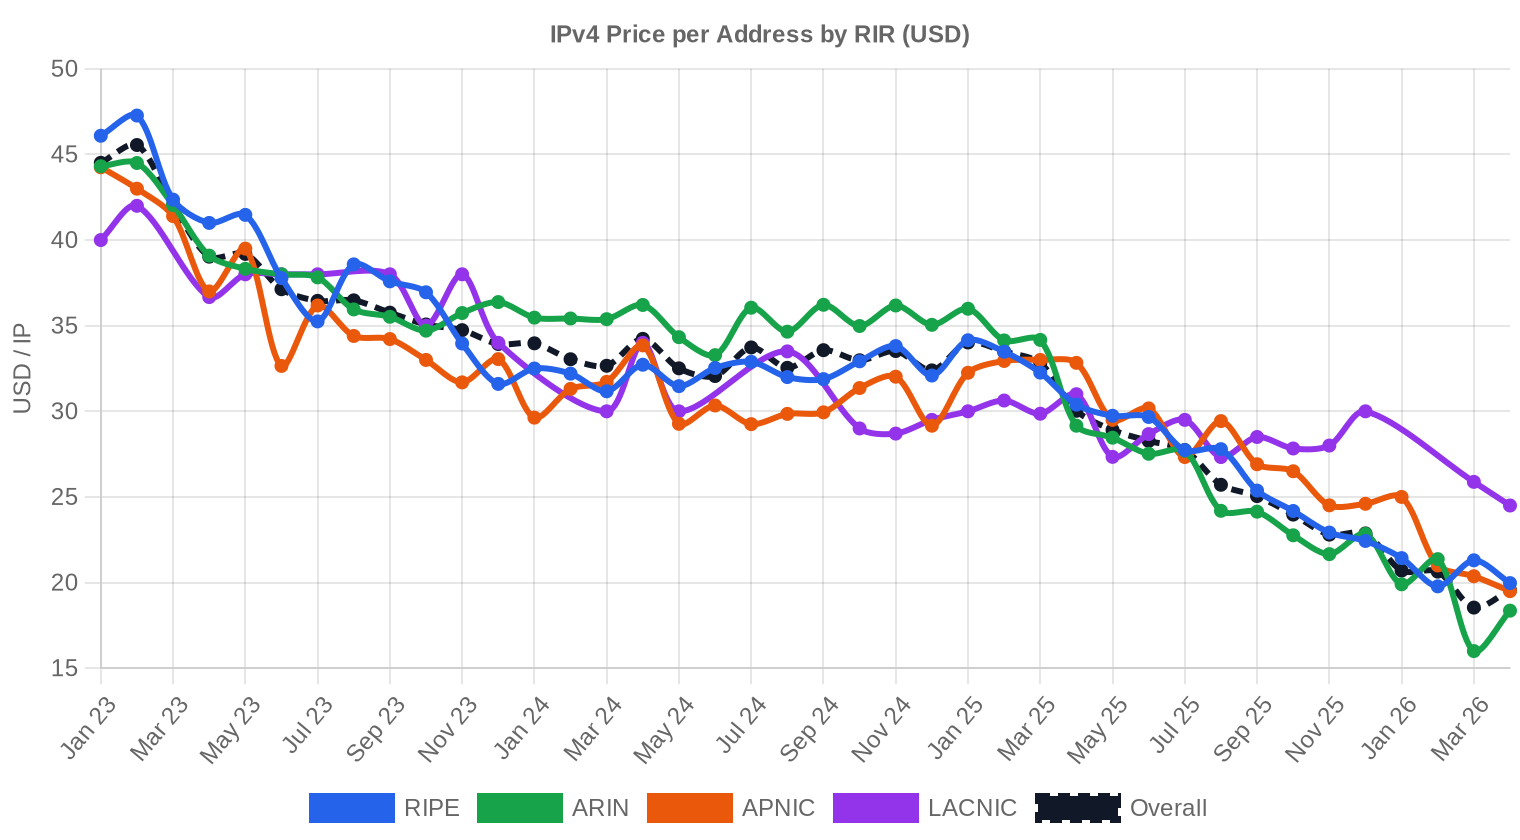
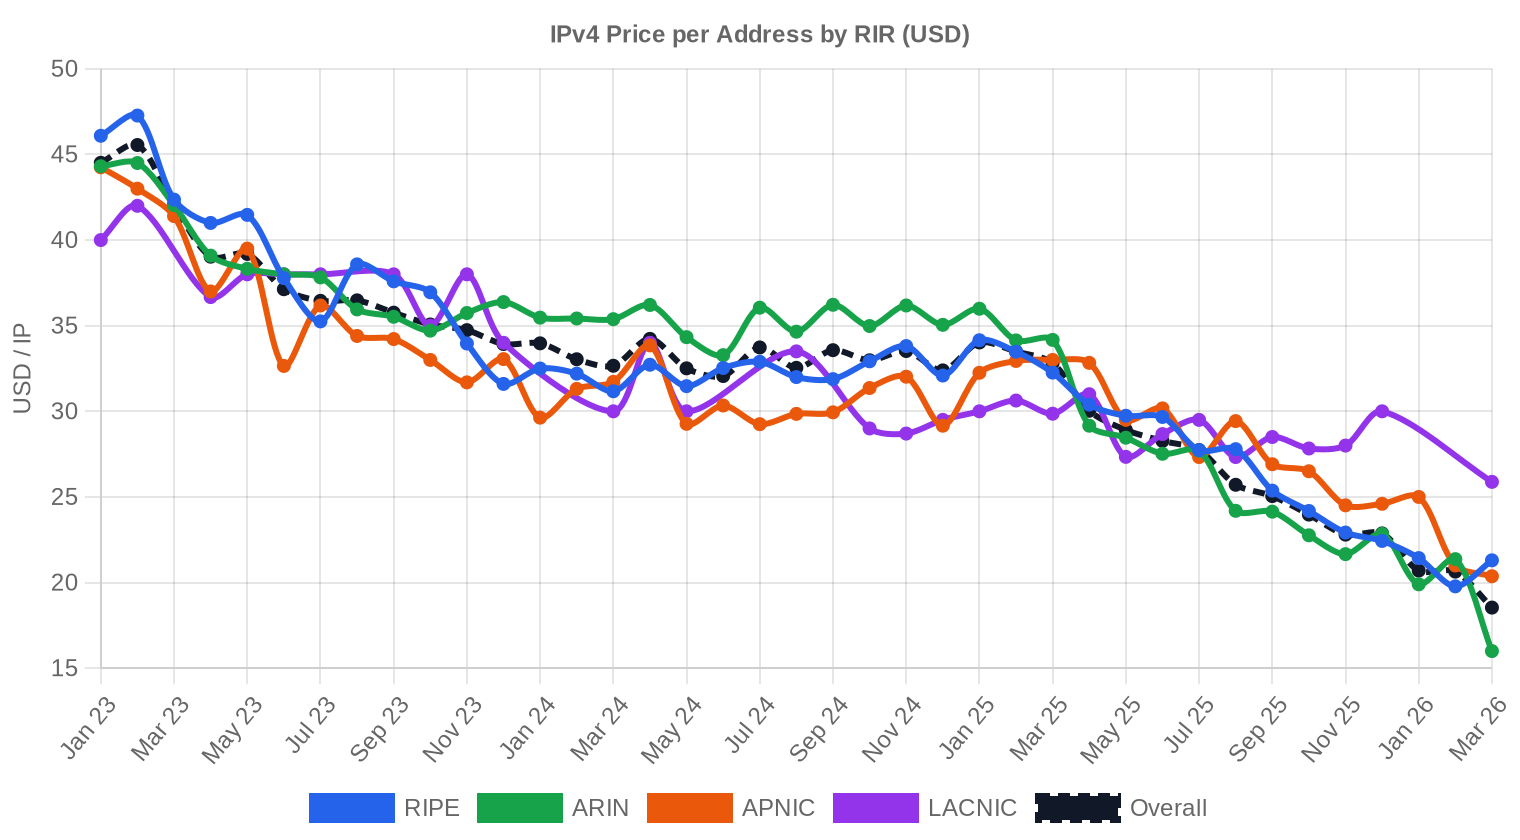
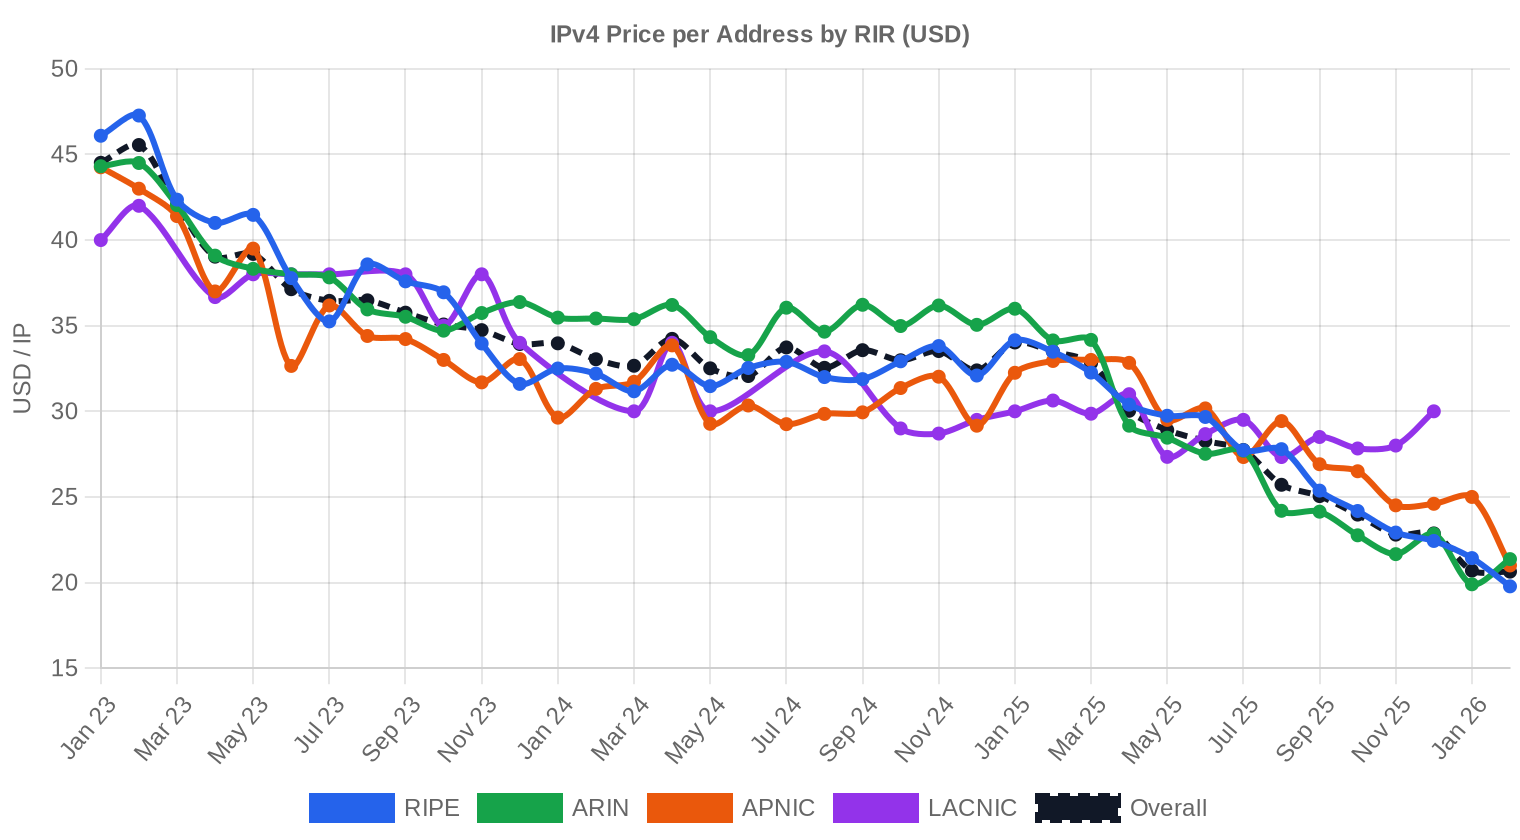
Pricing by RIR
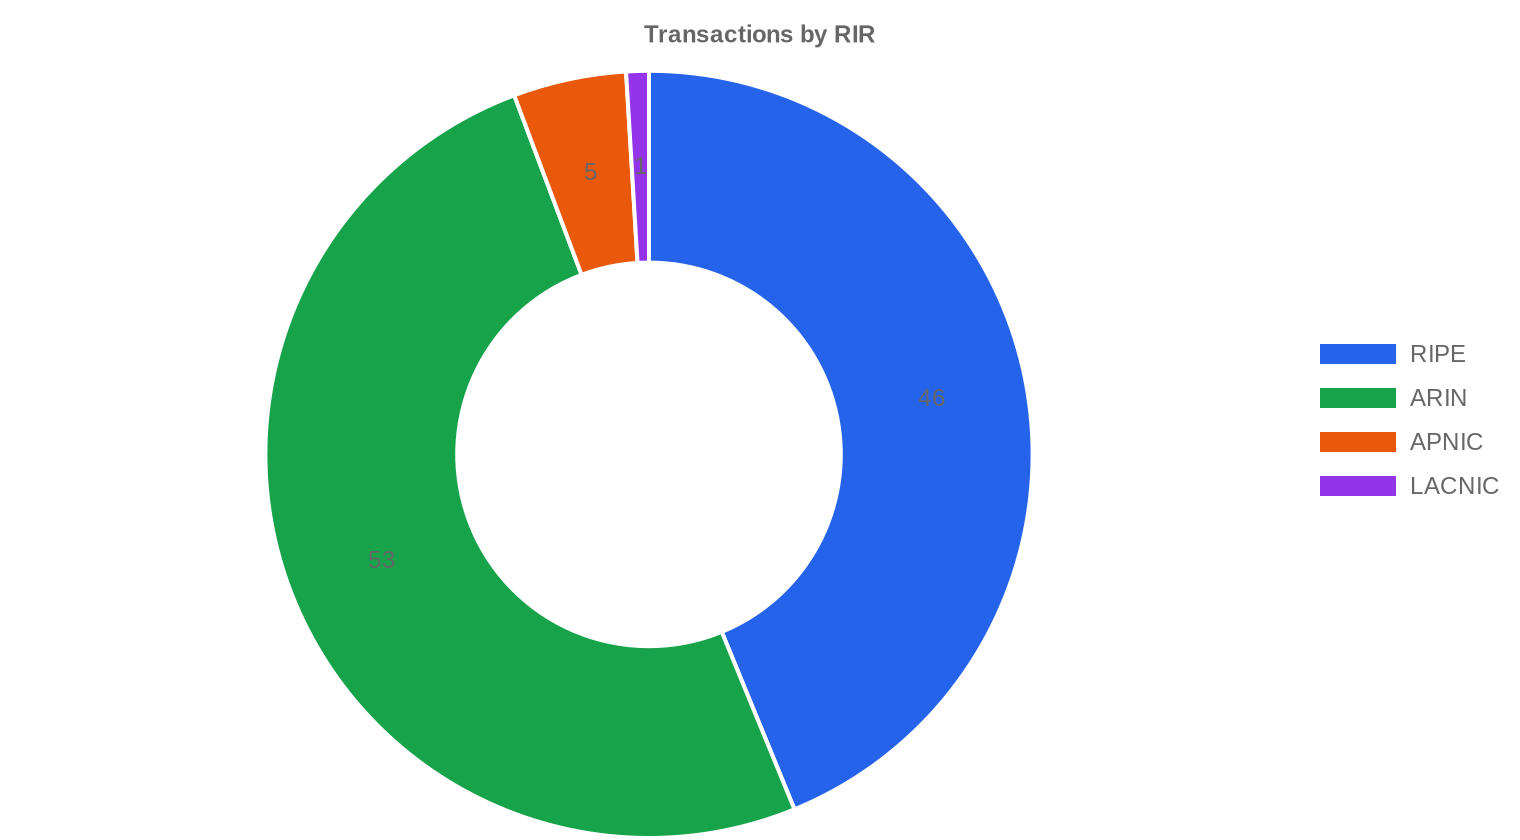
ARIN dominated volume at 50.5% of IPs traded, but RIPE led on transaction count with 46 deals versus ARIN's 53 — reflecting smaller average block sizes in the RIPE region. The pricing gap between the two is narrowing but still present: RIPE averaged $20.24/IP (median $21.13) versus ARIN at $19.16 (median $18.25). That $1.08 average premium for RIPE blocks has compressed from historical norms of $3–5 and suggests the two registries are converging fast. APNIC came in at $17.50 across just 5 transactions totaling 80,896 IPs — the discount there reflects both larger block sizes and thinner regional demand. LACNIC posted a single deal at $21.00/IP, the priciest RIR average this month, though one transaction is hardly a trend.ARIN: $19.16/IP across 53 transactions (49.6% of volume).
RIPE: $20.24/IP across 46 transactions (29.3% of volume).
APNIC: $17.50/IP across 5 transactions (20.1% of volume).
LACNIC: $21.00/IP across 1 transaction (1.0% of volume).
AFRINIC: No recorded transactions.
| RIR | Transactions | Avg $/IP | Median $/IP | IPs Traded | RIR Transfers | Next Month (proj.) | Year-End (proj.) |
|---|---|---|---|---|---|---|---|
| RIPE | 46 | $20.24 | $21.13 | 118,016 | 404 | $21.00 | $19.50 |
| ARIN | 53 | $19.16 | $18.25 | 199,680 | 183 | $17.50 | $16.00 |
| APNIC | 5 | $17.50 | $17.00 | 80,896 | 0 | $16.50 | $14.50 |
| LACNIC | 1 | $21.00 | $21.00 | 4,096 | 0 | $22.00 | $20.00 |
Transaction Volume
Supply & Block Sizes
The /24 remained the most frequently traded prefix, accounting for 27 of 105 transactions — roughly a quarter of all deals. Buyers continue to favor /24s for single-subnet deployments, email reputation management, and geo-targeted hosting, even though the per-IP premium on a 256-address block runs well above bulk pricing. The average deal size dropped to 3,835 IPs (54,716 total IPs ÷ adjusted), down sharply from 80,193 in April, indicating a shift toward smaller, retail-oriented transactions this month.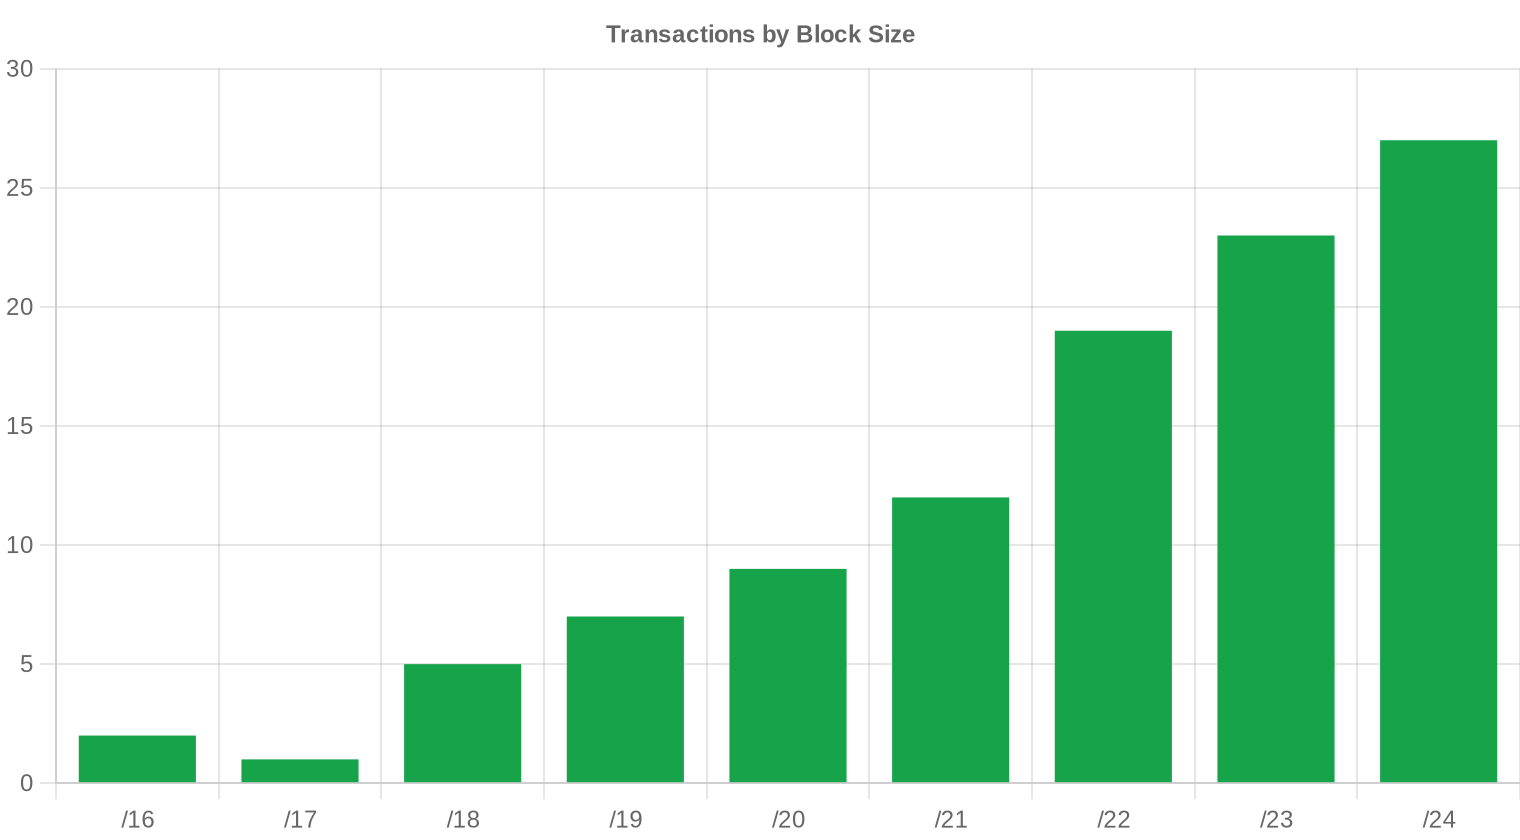
Geographic Activity
The United States led with 42 transactions, followed by Great Britain at 17 and Canada at 11. Together these three markets accounted for roughly 67% of all deals — a concentration that has held remarkably steady over the past two years. The Netherlands and Ireland each posted 4 transactions, reflecting continued hosting and data center demand in Western Europe. Sporadic activity from Hong Kong, Japan, Australia, and Venezuela rounds out the geographic picture but doesn't move aggregate pricing.Registry Transfer Activity
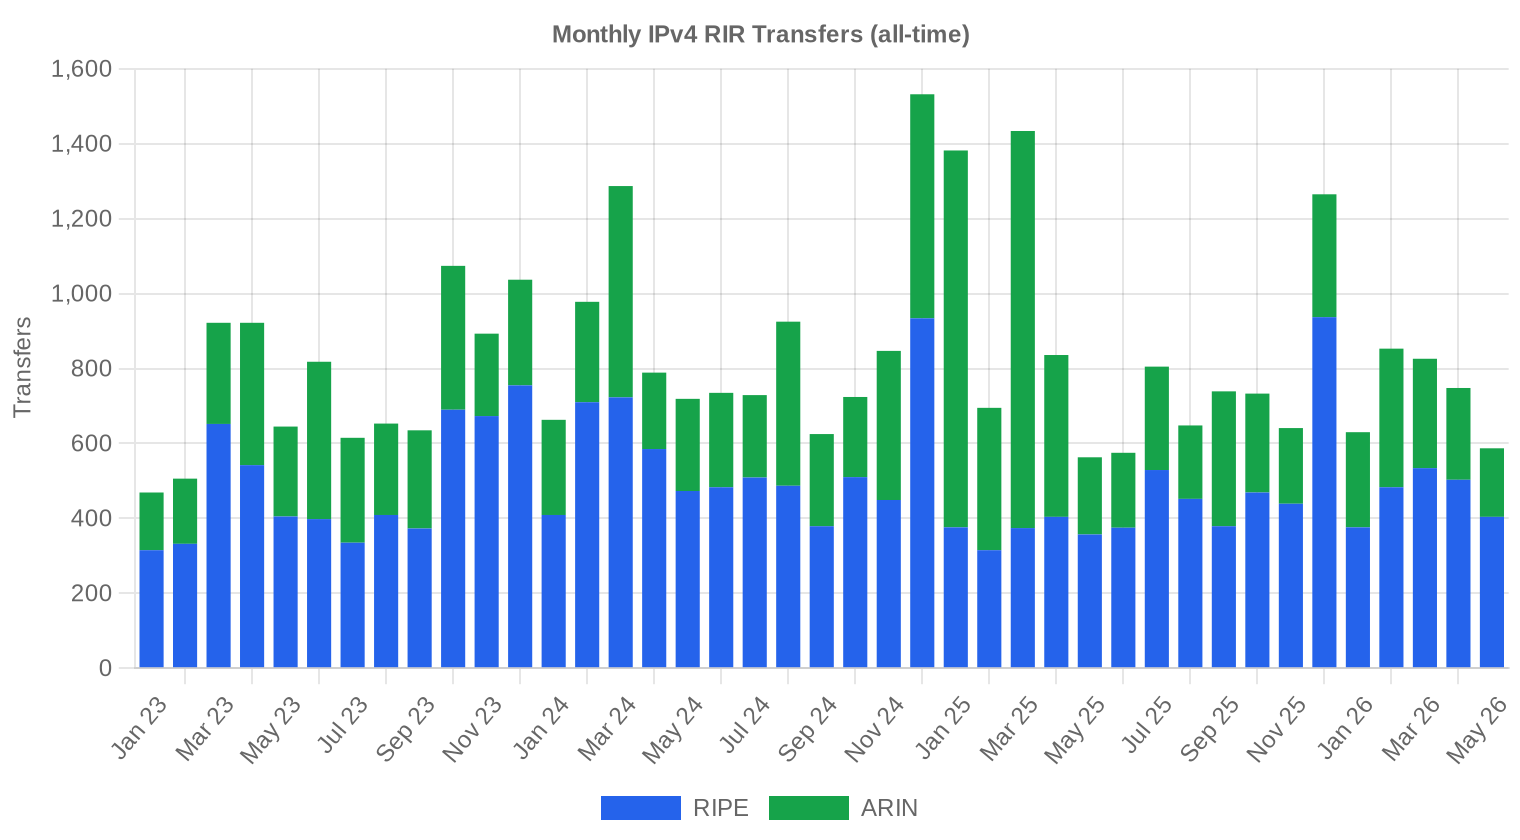
Official RIR transfer registrations totaled 587 in May, well above the 105 priced transactions in our dataset — the gap represents intra-company transfers, pre-arranged moves, and legacy reassignments that don't hit the open market. RIPE led with 404 recorded transfers, dwarfing ARIN's 183. That RIPE-heavy skew in administrative transfers versus ARIN's dominance in commercial transactions is a structural feature of the market: RIPE's transfer framework captures more non-commercial activity.Long-Run Transfer Trends
Across our 41-month tracking window, cumulative transfers stand at 33,702. The peak month was December 2024, which coincided with year-end portfolio optimization and the final wave of aggressive selling ahead of anticipated price declines. Monthly transfer volumes have since settled into a lower, steadier cadence — consistent with a market that has moved past the panic-selling phase and into equilibrium.| RIR | RIR Transfers |
|---|---|
| RIPE | 20,236 |
| ARIN | 13,466 |
| RIR Transfers | 33,702 |
Outlook & Forecast
Forecasting each block-size band and RIR separately with our AI model:
The overall average price per IP is projected to reach $18.26 by December 2026, with a next-month estimate of $19.45 per IP.
- RIPE: projected at $21.00 per IP next month, trending toward $19.50 by December 2026.
- ARIN: projected at $17.50 per IP next month, trending toward $16.00 by December 2026.
- APNIC: projected at $16.50 per IP next month, trending toward $14.50 by December 2026.
- LACNIC: projected at $22.00 per IP next month, trending toward $20.00 by December 2026.
- AFRINIC: insufficient data for a reliable forecast.

Forecast by Block Size
| Block | Current $/IP | Next Month | Year-End | Confidence |
|---|---|---|---|---|
| /24 | $25.00 | $24.50 (-2.0%) | $23.00 (-8.0%) | medium |
| /23 | $21.13 | $21.00 (-0.6%) | $19.50 (-7.7%) | medium |
| /22 | $18.50 | $18.00 (-2.7%) | $17.00 (-8.1%) | medium |
| /21 | $16.50 | $16.50 (0.0%) | $15.50 (-6.1%) | medium |
| /20 | $15.88 | $15.75 (-0.8%) | $15.00 (-5.5%) | medium |
| /19 | $14.50 | $14.50 (0.0%) | $13.50 (-6.9%) | low |
| /18-/16 | $13.50 | $13.00 (-3.7%) | $12.50 (-7.4%) | low |
| /15-up | $10.00 | $10.00 (0.0%) | $9.50 (-5.0%) | low |
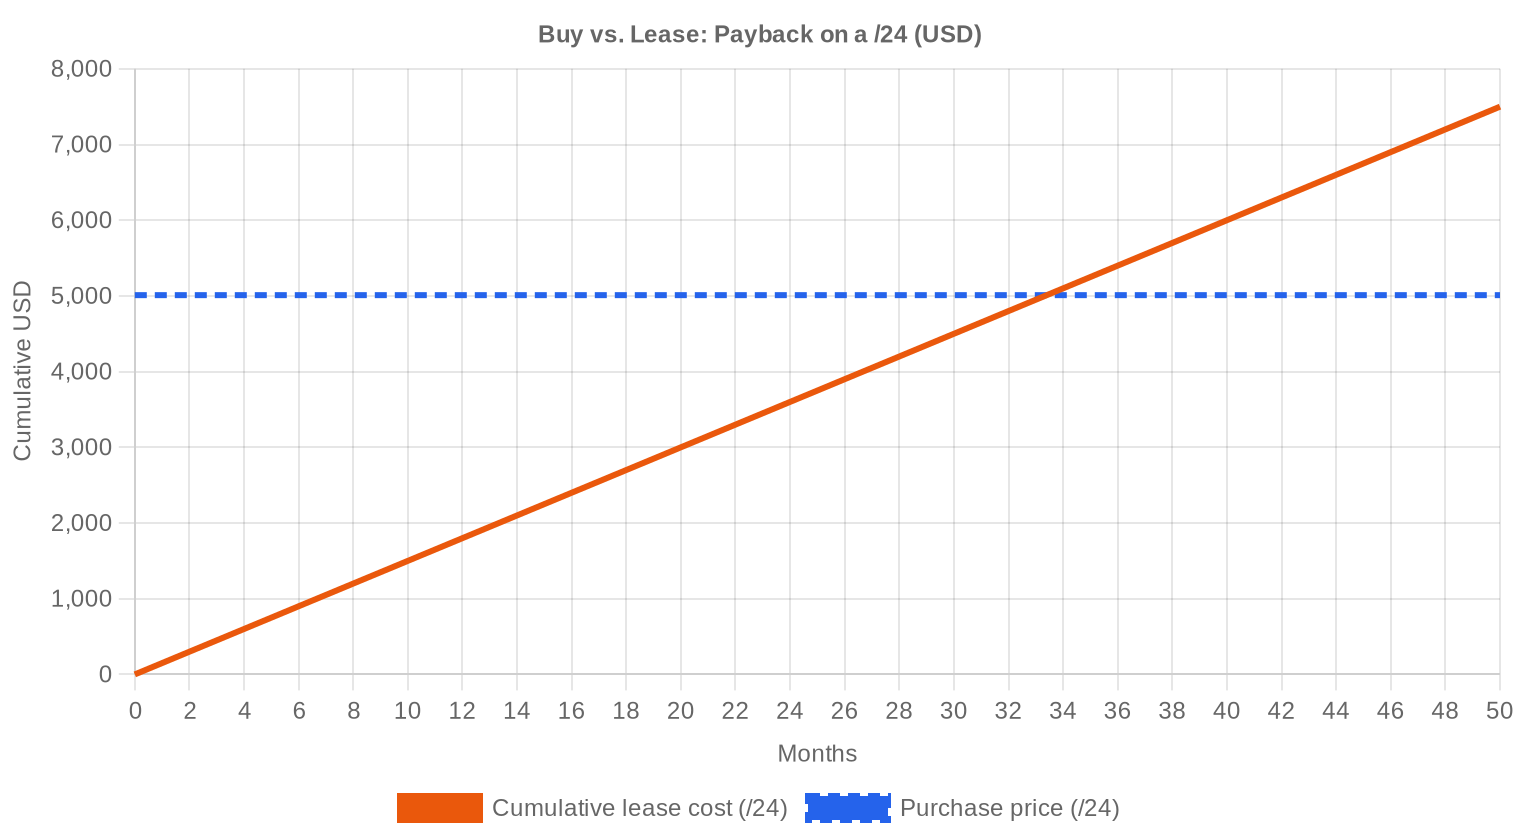
Editor's Take: Buy vs. Lease
At current pricing, the buy-versus-lease calculus tilts firmly toward buying. A /24 costs roughly $5,010 to purchase outright. Leasing the same block runs $150/month, or $1,800/year. That means the break-even on a purchase arrives at just 33.4 months — under three years. For any organization planning to hold addresses beyond that horizon, buying is the rational choice. The implied annual yield for a lessor sits at 35.9%, which is extraordinary by any fixed-income standard. But that yield reflects counterparty risk, operational overhead, and the secular price decline in the underlying asset. If you're sitting on unused blocks, leasing generates strong cash flow while prices continue to erode — but don't wait too long. A year-end price of $18.26 means your asset is depreciating at roughly 7% over seven months.| /24 Purchase price | $5,010 |
| /24 Lease price | $150 / mo |
| Payback period | 33.4 mo (2.8 yr) |
| Gross annual yield | 35.9% |
What This Means for You
Buyers: You're operating in the most favorable pricing environment since the IANA free pool dried up. At $19.57/IP, mid-size blocks (/20 to /22) offer the best value per address. Don't rush — the forecast shows continued softening — but don't get greedy waiting for $15 either. The floor is closer than it looks.Sellers: If you've been holding out for a price recovery, the data isn't cooperating. Prices are down 32.3% year-over-year and the trend line points lower. Every month you wait costs you roughly 1% in asset value. Consider partial liquidation now and lease the remainder.
Leasers: Monthly rates of $0.59/IP ($150 per /24) remain attractive for short-term needs — testing, campaigns, seasonal capacity. But if your time horizon exceeds 33 months, you're overpaying relative to purchase.
Block Holders: Leasing yields of 35.9% annualized are hard to ignore, but they come with management costs and the risk of tenant-related blacklisting. Vet your lessees carefully. Clean blocks command premiums; damaged ones don't.
Browse verified IPv4 blocksSell IPv4 →
List your blocks with managed transferLease IPv4 →
Flexible short-term capacityLease Out IPv4 →
Turn idle blocks into recurring revenue
IPv4 Pricing by Block Size
The /24 segment continues to carry a meaningful per-IP premium — blocks at that size traded near the upper end of the $18–$30 range, while /16-equivalent volumes cleared closer to $14–$18. The per-IP discount for bulk (/18 and larger) runs 15–25% below /24 pricing, which is consistent with historical norms. Buyers who can aggregate smaller blocks into contiguous space still capture arbitrage, though those opportunities are increasingly scarce.| Block | IPs | Buy: /IP | Buy: Total | Lease: /IP/mo | Lease: Monthly |
|---|---|---|---|---|---|
| /24 | 256 | $35–45 | $8,960–11,520 | $0.38–0.50 | $97–128 |
| /22 | 1,024 | $28–38 | $28,672–38,912 | $0.33–0.45 | $338–461 |
| /20 | 4,096 | $22–32 | $90,112–131,072 | $0.30–0.40 | $1,229–1,638 |
| /18 | 16,384 | $20–30 | $327,680–491,520 | $0.30–0.38 | $4,915–6,226 |
| /16 | 65,536 | $18–28 | $1,179,648–1,835,008 | $0.30–0.35 | $19,661–22,938 |
IPv4 Price History: 2011–2026
IPv4 addresses first acquired meaningful market value after IANA exhausted its free pool in 2011. Prices climbed steadily through the 2010s, accelerating sharply during 2021–2022 when averages briefly exceeded $50/IP for clean /24s. The structural break came in mid-2024 when AWS began charging $0.005/hour for public IPv4 addresses, prompting a wave of address returns and forced rationalization across the cloud ecosystem. Since that peak, prices have bifurcated: small blocks retain modest premiums, while bulk inventory has repriced aggressively — down more than 60% from the 2022 highs in some cases.| Year | ~Price/IP | Key Event |
|---|---|---|
| 2011 | $7–12 | IANA free pool exhausted; Microsoft/Nortel deal ($11.25/IP) |
| 2012 | $8–12 | RIPE NCC reaches last /8; begins /22-only allocation |
| 2014 | $10–15 | LACNIC free pool exhausted |
| 2015 | $8–15 | ARIN free pool exhausted |
| 2017–18 | $12–18 | Leasing market grows; cloud demand rises |
| 2019 | $18–24 | RIPE NCC exhausts remaining free pool |
| 2021–22 | $50–60+ | Post-pandemic peak; hyperscaler build-outs |
| 2024 | $35–52 | AWS IPv4 charge ($0.005/IP/hr); large block correction |
| 2025–26 | $18–45 | Market bifurcation; /16s below $20 for first time since 2019 |
Market Structure: Who Is Buying & Selling
The buy side is dominated by mid-tier cloud providers, regional ISPs expanding footprint, and hosting companies backfilling address needs. Enterprise buyers have thinned out — most large corporates now optimize existing allocations or lean on NAT/CGN rather than acquire new space. The sell side is a mix of legacy holders monetizing dormant allocations, distressed telecom assets, and private equity portfolio companies executing IP-to-cash conversions.IPv4 vs. Other Asset Classes
At a 35.9% implied annual lease yield, IPv4 addresses outperform virtually every conventional asset class on a current-income basis. U.S. Treasuries yield around 4.5%; investment-grade real estate caps hover near 6%; even high-yield corporate debt doesn't crack 10%. The catch is depreciation: the underlying asset is losing roughly 7–10% annually in market value. Net of depreciation, the effective yield still clears 25% — attractive, but only for holders who can manage the operational side and absorb the residual risk of IPv6 adoption eventually compressing demand to zero.| Asset Class | Typical Yield | Liquidity | Primary Risk |
|---|---|---|---|
| IPv4 | 35.9% | Moderate | IPv6 adoption, block quality |
| Commercial Real Estate | 5–8% | Low | Vacancy, rate cycle |
| Investment-Grade Bonds | 4–5% | High | Duration, credit risk |
| S&P 500 | ~1,3% | High | Market volatility |
| Money Market / T-Bills | ~4–5% | High | Rate cycle changes |
IPv6 Adoption & Why IPv4 Remains Essential
IPv6 adoption continues its glacial advance. Google reports roughly 45% of traffic reaching its services over IPv6, and mobile carriers have largely transitioned — but enterprise networks, legacy infrastructure, and much of the hosting ecosystem remain stubbornly v4-dependent. The coexistence period stretches out at least another decade. IPv4 addresses remain a functional necessity for any network operator that needs to reach the full internet without translation overhead.AI & Cloud Infrastructure Demand
AI infrastructure buildout is a tangible but not dominant driver of IPv4 demand in 2026. Large-scale training clusters typically sit behind a handful of public IPs with heavy NATing, but inference farms — especially those serving edge workloads and API endpoints — require routable address space at scale. Several hyperscaler-adjacent AI companies have appeared in the /20 to /18 transaction range this year, quietly accumulating blocks. The demand isn't overwhelming the market, but it is providing a floor under mid-size block pricing.What Determines IPv4 Block Value
Block valuation depends on five key variables: blacklist cleanliness (a block on Spamhaus drops 20–40% in value), allocation vintage (older legacy blocks carry fewer transfer restrictions), RIR region (RIPE and ARIN command premiums over APNIC), prefix contiguity (aggregatable space is worth more), and transfer history (blocks that have changed hands multiple times in short periods raise flags). Buyers should always run a full reputation check before closing — the cost of remediation often exceeds the discount obtained.Sell vs. Lease: A Decision Framework
For holders with clean blocks and no operational use for them, leasing at $0.59/IP/month generates 35.9% annualized returns — hard to beat. But if your forecast aligns with ours and you expect another 7% of price erosion by December, selling now and redeploying capital elsewhere may be the better risk-adjusted move. The decision hinges on your operational capacity to manage lease relationships and your conviction about the pace of price decline.| /24 Purchase price | $5,010 |
| /24 Lease price | $150 / mo |
| Payback period | 33.4 mo (2.8 yr) |
| Gross annual yield | 35.9% |
RIPE NCC 24-Month Transfer Restriction
RIPE's 24-month holding requirement continues to constrain short-term speculative activity in the European market. Blocks acquired through RIPE transfers cannot be re-transferred for two years, which locks up supply and creates a natural inventory bottleneck. This rule partly explains why RIPE per-IP pricing ($20.24) runs above ARIN ($19.16) — the friction cost of reduced liquidity gets priced in. Buyers should factor the holding period into any RIPE acquisition strategy.Deal Size Distribution
The market is increasingly retail. Eighty-one of 105 transactions (77%) fell under $50,000 in value, though they accounted for only $1.23 million — just 21% of total dollar volume. The heavy lifting came from 8 deals above $250K, which together represented $4.81 million or 84% of total value. Average deal size dropped to roughly 3,835 IPs from 80,193 in April — a sharp shift toward smaller, opportunistic purchases. Two deals exceeded $1 million, contributing $2.57 million between them.Top Trading Countries
The United States accounted for 40% of all transactions, consistent with its position as both the largest source and consumer of IPv4 space. Great Britain posted 17 deals, driven by London's dense hosting and financial services ecosystem. Canada's 11 transactions reflect steady ISP demand in a market with limited domestic supply. The Netherlands and Ireland, both major European data center hubs, contributed 4 deals each.BEAD Broadband Program Impact
The $42.45 billion BEAD program is beginning to flow into state-level broadband buildouts, and the IPv4 implications are real. Rural ISPs and fixed wireless operators receiving BEAD funding will need routable address space for subscriber deployments — typically /20 to /18 blocks. As construction timelines accelerate through 2026–2027, expect incremental demand pressure on mid-size blocks, particularly in ARIN. This could create a localized tightening even as aggregate prices drift lower.Hyperscaler IPv4 Holdings
Microsoft, Amazon, Apple, and Google collectively control millions of IPv4 addresses, much of it acquired through M&A or legacy allocations. Amazon's decision to charge for public IPv4 usage was the single most impactful market event of the past three years — it triggered mass address returns and fundamentally repriced the asset class. Any move by a major holder to monetize a large block would flood supply and push prices sharply lower. For now, hyperscalers appear content to hold, but this overhang remains the market's biggest tail risk.Macroeconomic Conditions & Market Impact
Enterprise IT budgets remain constrained heading into H2 2026, with CIOs prioritizing AI/ML spending over network infrastructure. Higher-for-longer interest rates have kept the cost of capital elevated, reducing appetite for large IPv4 portfolio acquisitions that require upfront cash. The macro backdrop is mildly bearish for IPv4 pricing — when capital is expensive, buyers negotiate harder and sellers have fewer bidders.Model Update & Calibration
We reviewed our past projections against actual market outcomes and recalibrated the model for this report. The updated model places more weight on recent price movements using exponential decay, dynamically adjusts prediction bands to reflect current market conditions, and corrects for any systematic bias detected in earlier forecasts. The predicted-vs-actual comparison chart below shows how closely our past estimates tracked reality.
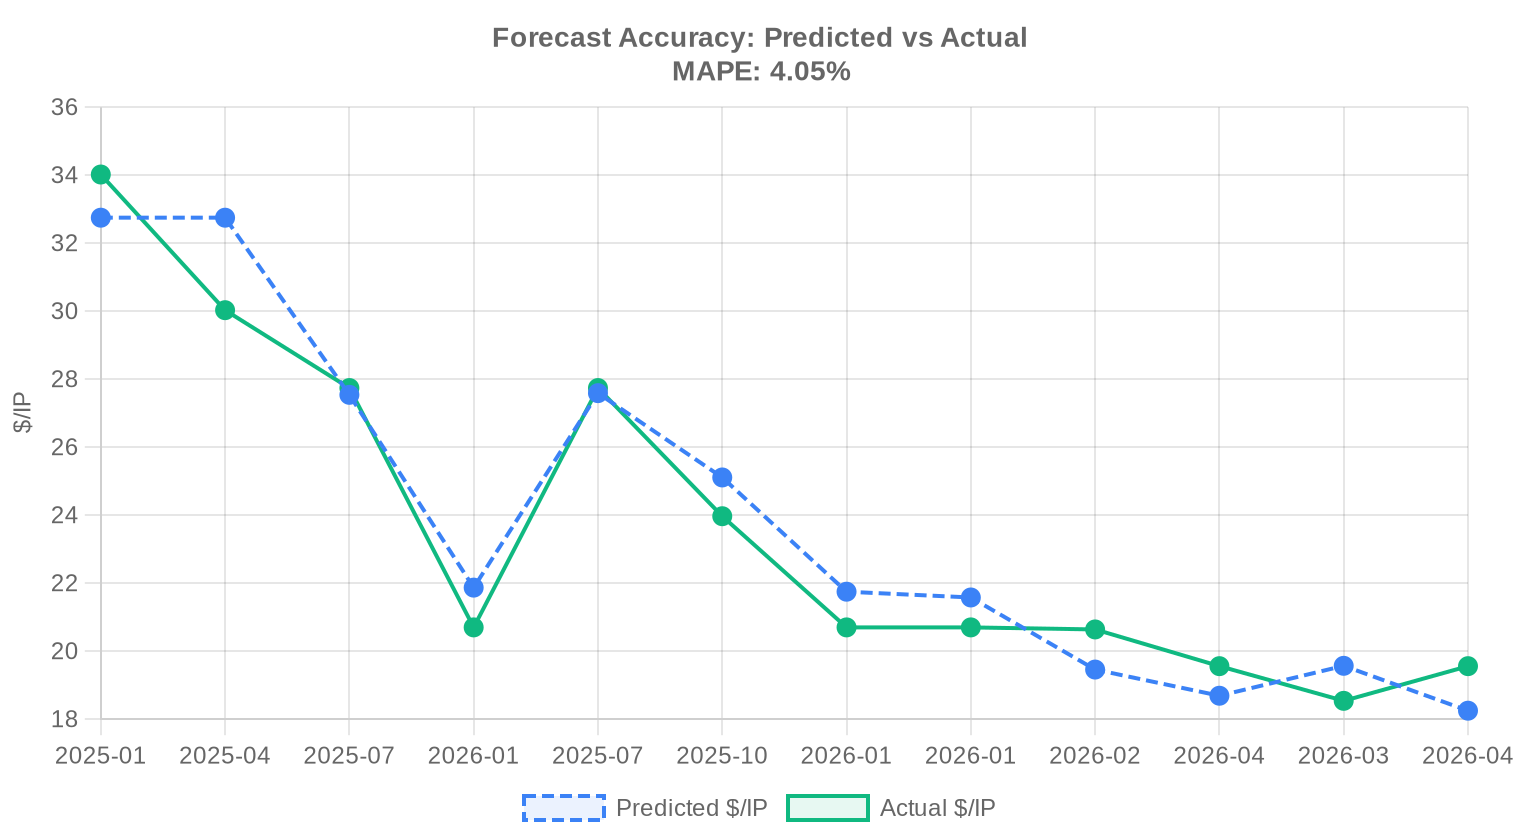
| Report Period | Target Month | Predicted | Actual | Deviation |
|---|---|---|---|---|
| 2025-H2 | 2026-01 | $22 | $21 | +5% |
| 2025-Q4 | 2026-01 | $22 | $21 | +4% |
| 2026-01 | 2026-02 | $19 | $21 | -6% |
| 2026-Q1 | 2026-04 | $19 | $20 | -4% |
| 2026-02 | 2026-03 | $20 | $19 | +6% |
| 2026-03 | 2026-04 | $18 | $20 | -7% |
Methodology
Figures are based on completed IPv4Center marketplace transactions and RIR transfer statistics. Prices are in US dollars per IP address. Forecasts are produced by an AI model that analyses each block-size band and RIR segment separately (with outlier-trimmed medians) alongside known market catalysts; they are estimates, not guarantees.
Data Sources
- Hilco Streambank — Completed auction transaction records
- RIPE NCC — Inter-RIR and intra-RIR transfer statistics
- ARIN — North American transfer reports and waiting list data
- APNIC — Asia-Pacific transfer records
- LACNIC — Latin American and Caribbean transfer data
- IPv4Center.com — Proprietary marketplace transaction and lease pricing data
This report is generated automatically for informational purposes only and does not constitute financial advice.
Frequently Asked Questions
What was the average price per IPv4 address in May 2026?
The global weighted average landed at .57 per IP, with a median of .50. The spread between the two is negligible — a sign of a market that has largely converged on a consensus valuation band.
How many transactions closed in May 2026, and what was the total volume?
We recorded 105 sale transactions encompassing 402,688 addresses for a combined consideration of roughly .75 million. Average deal size was approximately 54,716 IPs — skewed upward by a handful of large-block trades.
Which RIR commanded the highest per-IP prices this month?
LACNIC space topped the board at .00 per IP, though on a single transaction of 4,096 addresses — hardly a statistically robust sample. Among RIRs with meaningful volume, RIPE averaged .24, roughly a dollar above ARIN's .16.
Why is ARIN space trading at a discount to RIPE when ARIN had the most transactions?
ARIN dominated transaction count (53 deals, 50.5% share) and IP volume (199,680 addresses), which tends to compress unit pricing — deeper liquidity usually means tighter bids. ARIN's median of .25 versus RIPE's .13 reflects this dynamic, plus somewhat looser supply in the North American pool.
What was the price range across all deals in May 2026?
The floor was per IP (an ARIN block, likely a large legacy allocation) and the ceiling was per IP, also in the ARIN region. That 4:1 spread underscores how much block size, cleanliness, and buyer urgency still matter.
How did APNIC-region pricing compare to the global average?
APNIC averaged .50 per IP across just 5 transactions totaling 80,896 addresses — roughly 10% below the global mean. The median was .00, suggesting Asia-Pacific blocks are currently the value play, though liquidity is thin and due diligence cycles tend to run longer.
Is the market trending up or down heading into summer 2026?
Down, modestly. May's data shows a -0.91% price decline versus the prior period, and our model projects .45 for June and .26 by year-end 2026. The descent is orderly, not panicked — more of a slow grind than a capitulation.
What does the year-end 2026 price forecast imply for current buyers?
At a projected .26 by December 2026, buyers acquiring at today's .57 average face roughly 6.7% mark-to-market erosion over seven months. That's not catastrophic, but it argues against speculative accumulation and favors need-based purchasing.
Should I buy or lease IPv4 space at current rates?
At .59 per IP per month lease cost versus .57 purchase price, the buy-versus-lease breakeven is approximately 33.4 months — just under 2.8 years. If your planning horizon exceeds three years, buying remains the rational choice. The implied annual yield on ownership is 35.9%, which is exceptionally attractive for lessors.
What does a /24 block cost to buy versus lease right now?
A /24 (256 IPs) runs approximately ,010 to purchase outright. Leasing the same block costs roughly 0 per month, or ,800 annually. Over 33 months, cumulative lease payments exceed the purchase price.
What mistakes should buyers avoid in the current declining-price environment?
The biggest error is overpaying for urgency. With the trend pointing to .26 by December, buyers who can wait a quarter may save 3-5% per IP. Equally, avoid locking into large forward commitments at today's prices — the market is offering no scarcity premium worth paying right now.
What are the risks of waiting too long to acquire IPv4 space?
While prices are softening, supply is not infinite. Only 587 inter-RIR and intra-RIR transfers were recorded in May across all registries. A sudden demand spike — say, a hyperscaler re-entering the market — could reverse the trend quickly. Waiting is a reasonable strategy; waiting indefinitely is not.
What risks do lessors face given current market dynamics?
The 35.9% implied annual yield looks spectacular, but it's built on a depreciating asset. If purchase prices fall to .26 by year-end as projected, lessors holding blocks acquired at .57 face capital impairment even as cash yields remain strong. Mark-to-market discipline matters.
Which countries drove the most transaction activity in May?
The United States led with 42 deals, followed by the United Kingdom at 17 and Canada at 11. The Netherlands and Ireland each recorded 4 transactions. The Anglosphere continues to dominate — roughly 67% of all deals involved US, GB, or CA entities.
What was the most commonly traded prefix size?
The /24 block was the most frequently transacted prefix, appearing in 27 of 105 deals. This is the smallest independently routable block on the public internet, and it remains the entry-level purchase for small operators and enterprises needing a modest public footprint.
How was deal value distributed by size bracket?
The sub-K bracket accounted for 81 deals but only .23 million in value. Conversely, just 2 deals exceeding million contributed .57 million — nearly 45% of total market value. The IPv4 market remains a tale of many small trades and a few outsized ones.
Were there any AFRINIC transfers or sales in May 2026?
Zero. AFRINIC recorded no transactions and no transfer activity whatsoever. The region's ongoing governance challenges and policy uncertainty continue to freeze commercial activity. We would not recommend sourcing AFRINIC space for the foreseeable future.
How many total transfers (including non-sale transfers) occurred across all RIRs?
There were 587 total transfers recorded in May 2026. RIPE led with 404 transfers — a figure that dwarfs its 46 sale transactions, reflecting the volume of internal reorganizations, M&A-related moves, and policy-based transfers within the RIPE service region. ARIN logged 183.
What does the high RIPE transfer count relative to ARIN's imply about market structure?
RIPE's 404 transfers versus ARIN's 183 — despite ARIN leading in sale count — suggests the European market has a more active secondary circulation layer. Many RIPE transfers are intra-organization or between affiliated entities, which inflates the headline number but signals a mature, liquid ecosystem.
Is IPv6 adoption meaningfully suppressing IPv4 demand yet?
The gradual price erosion — projected at roughly 6-7% through year-end — is consistent with slow IPv6 substitution rather than a sudden displacement event. IPv4 remains operationally essential for the vast majority of enterprises. The market is deflating, not collapsing.
What should a first-time buyer expect from the transfer process?
Timelines vary by RIR. ARIN transfers typically close in 30-45 days including needs-justification review. RIPE transfers can complete in 2-3 weeks given their more streamlined policy. Budget for escrow fees, legal review, and potential broker commissions of 3-7% on top of the per-IP price.
Why did ARIN's per-IP price range (–) show more dispersion than RIPE's (–)?
ARIN's wider range reflects greater heterogeneity in block quality — legacy allocations with clean WHOIS history trade at steep premiums, while large blocks from less-known holders clear at deep discounts. RIPE's tighter band suggests a more commoditized market with less variance in provenance and reputation.
Are there deal-size premiums or discounts visible in the data?
Yes. The 81 sub-K transactions (mostly /24 and /23 blocks) averaged higher per-IP costs, while the 2 mega-deals above M moved roughly .57 million in value at lower per-IP rates. Volume discounts remain firmly embedded in market pricing — buyers of /16 and larger blocks still extract meaningful concessions.
What mistakes do sellers commonly make in a softening market?
Anchoring to last year's prices is the cardinal sin. With the trend clearly downward and a year-end forecast of .26, sellers who hold out for + are likely to watch their blocks depreciate while carrying costs accrue. Price to market, execute quickly, and redeploy capital.
How reliable is the year-end price forecast of .26?
Our model flags this forecast as reliable, based on 41 months of historical transaction data encompassing roughly 33,702 discrete observations. The trend is well-established and the confidence interval is reasonably tight. That said, exogenous shocks — regulatory changes, large-block liquidations, or a macro downturn crimping IT budgets — could accelerate or reverse the trajectory.