15 min read
This report analyzes the IPv4 transfer market for February 2026, based on completed IPv4Center marketplace transactions and official RIR transfer records.
Executive Summary
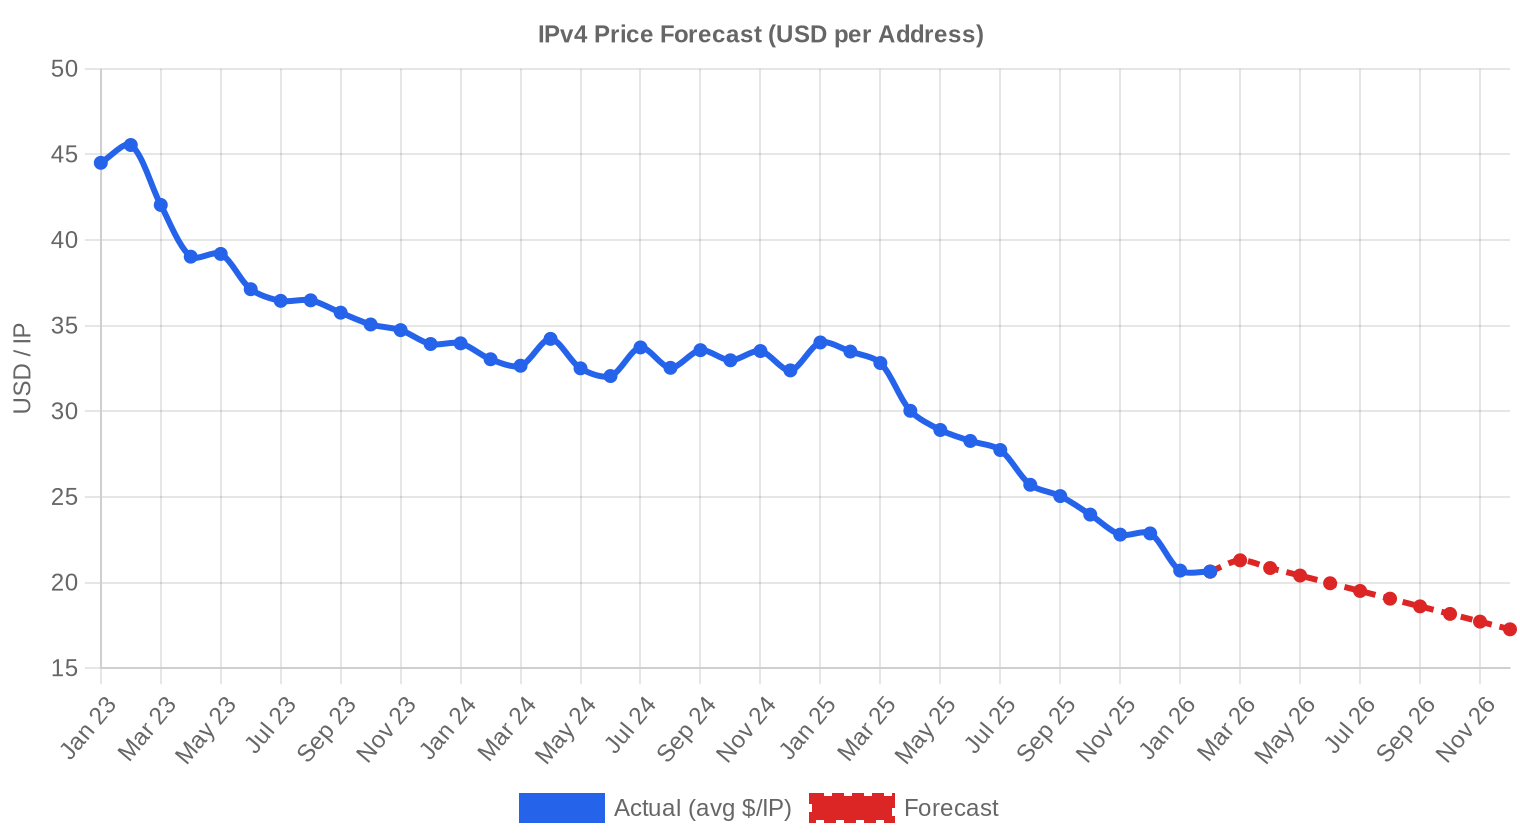
The IPv4 transfer market recorded 94 transactions in February 2026, moving 868,864 addresses at a weighted average of $20.64 per IP — a decline of $0.30 from January and a steep 38.4% drop from February 2025. Total deal value reached $10.1 million on the month. Transaction volume rose 6.8% versus January, but average deal size shrank to 107,589 IPs from 119,021 the prior month, suggesting a shift toward smaller block purchases. The trend line remains firmly negative, and our regression model flags another 2.06% decline ahead.Market Overview
| Transactions | 94 |
| IP Addresses Traded | 868,864 |
| Estimated Market Value | $10,113,379 |
| Average Price / IP | $20.64 |
| Median Price / IP | $21.75 |
| RIR Transfers | 853 |
Year-over-Year Comparison
| Metric | This period | A year earlier (February 2025) | Change |
|---|---|---|---|
| Transactions | 94 | 47 | +100.0% |
| IP Addresses Traded | 868,864 | 437,504 | +98.6% |
| Estimated Market Value | $10,113,379 | $14,043,587 | -28.0% |
| Average Price / IP | $20.64 | $33.49 | -38.4% |
| RIR Transfers | 853 | 695 | +22.7% |
Price Dynamics
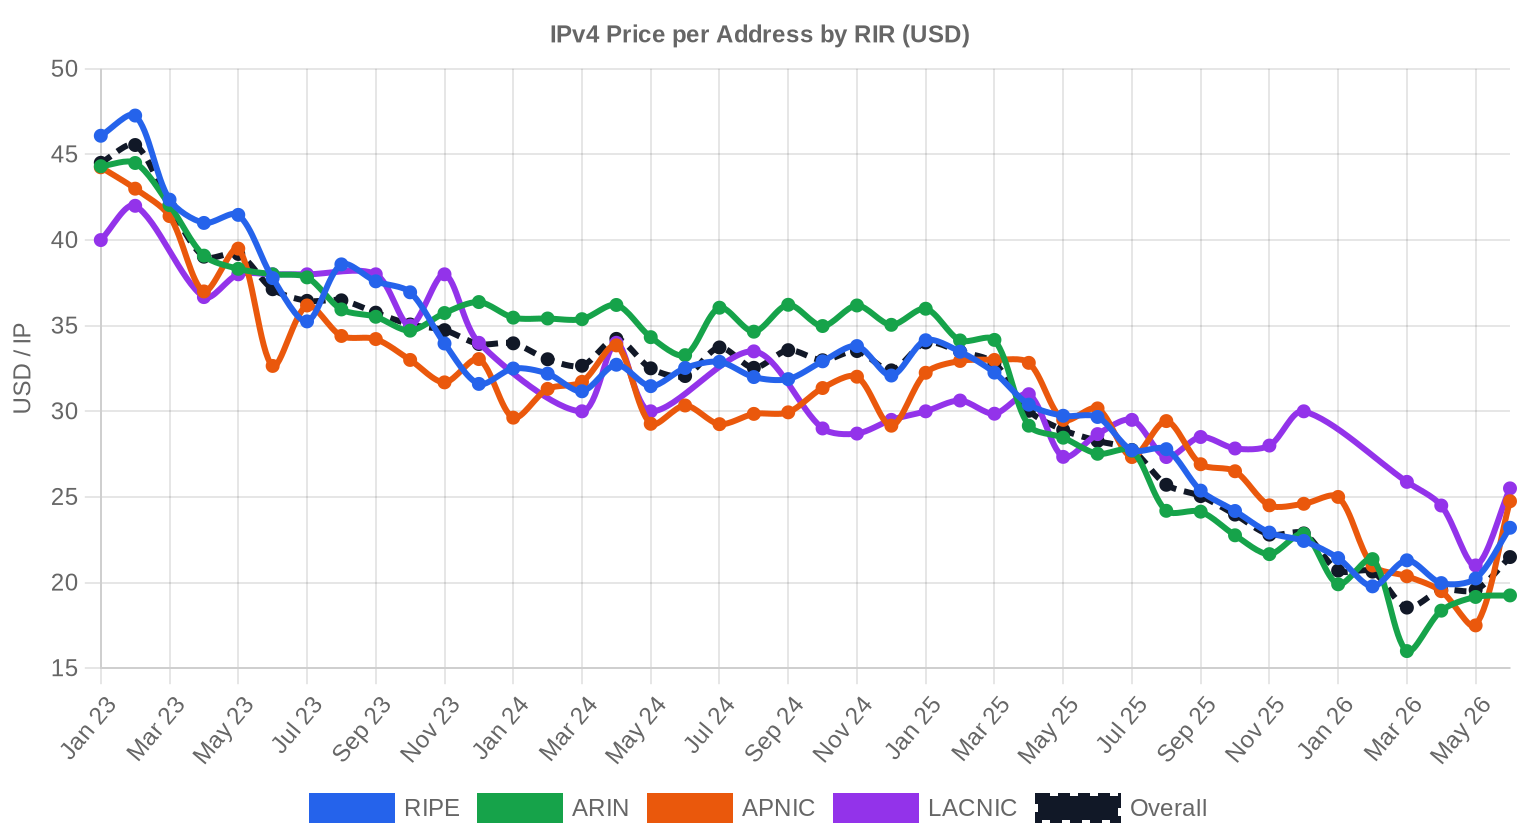
The spread between the cheapest and most expensive IPs traded in February was enormous: $9.50 at the floor to $38.50 at the ceiling, a 4x ratio that reflects the growing bifurcation between bulk inventory and clean, premium /24s. The median settled at $21.75, running $1.11 above the mean — a sign that a cluster of large-block, low-per-IP deals is pulling the average down. Compared to January's $20.94, the weighted average slipped $0.30, or roughly 1.4%. Against February 2025, the picture is far more dramatic: the 38.4% year-over-year decline marks the steepest annual compression we've tracked since the post-AWS-charge correction began in late 2024. Sellers holding out for $30+ are finding buyers only for exceptionally clean ARIN /24s; the rest of the market has repriced.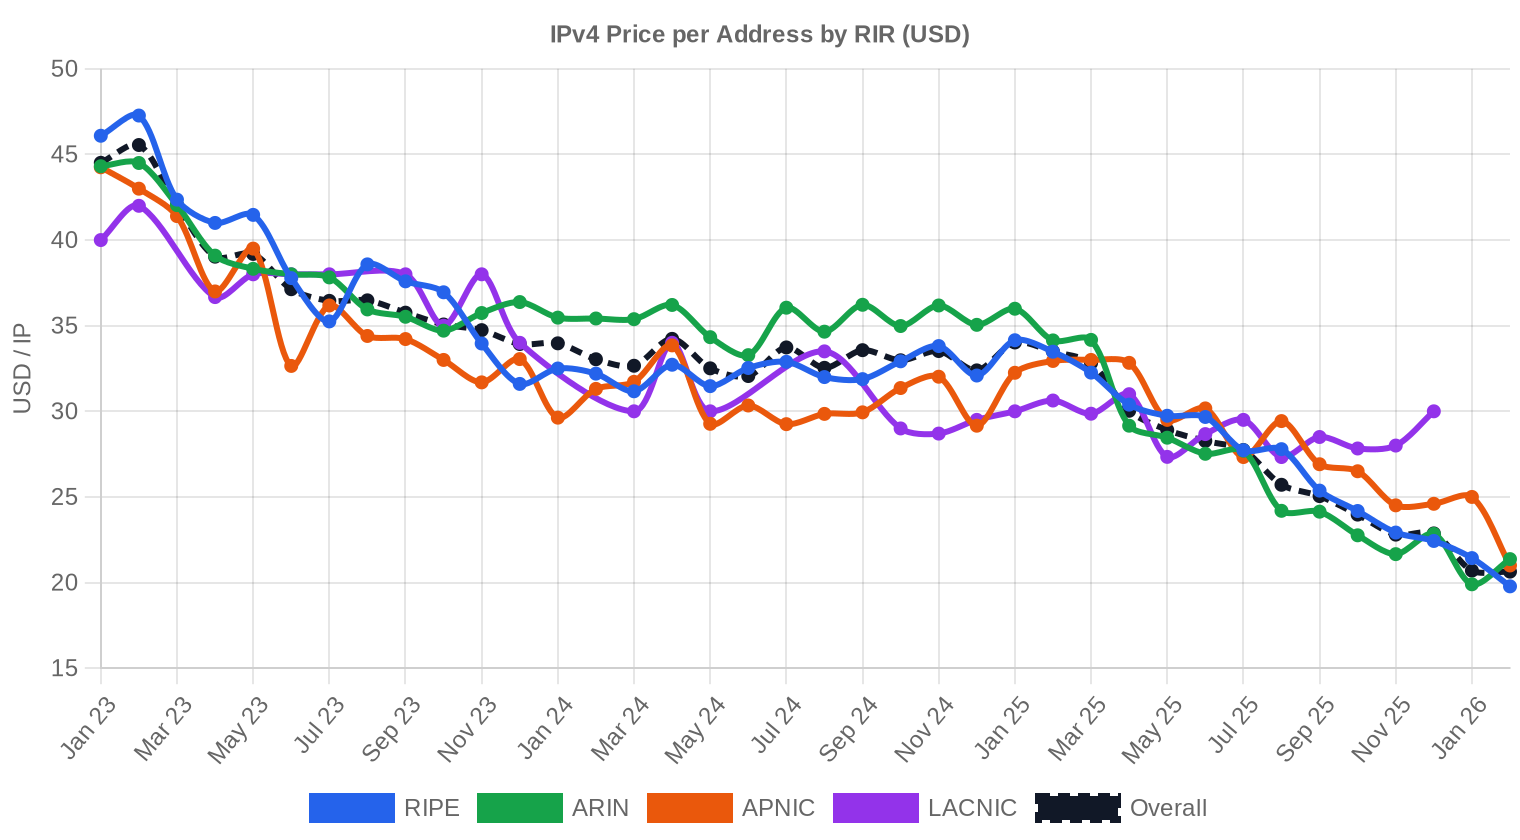
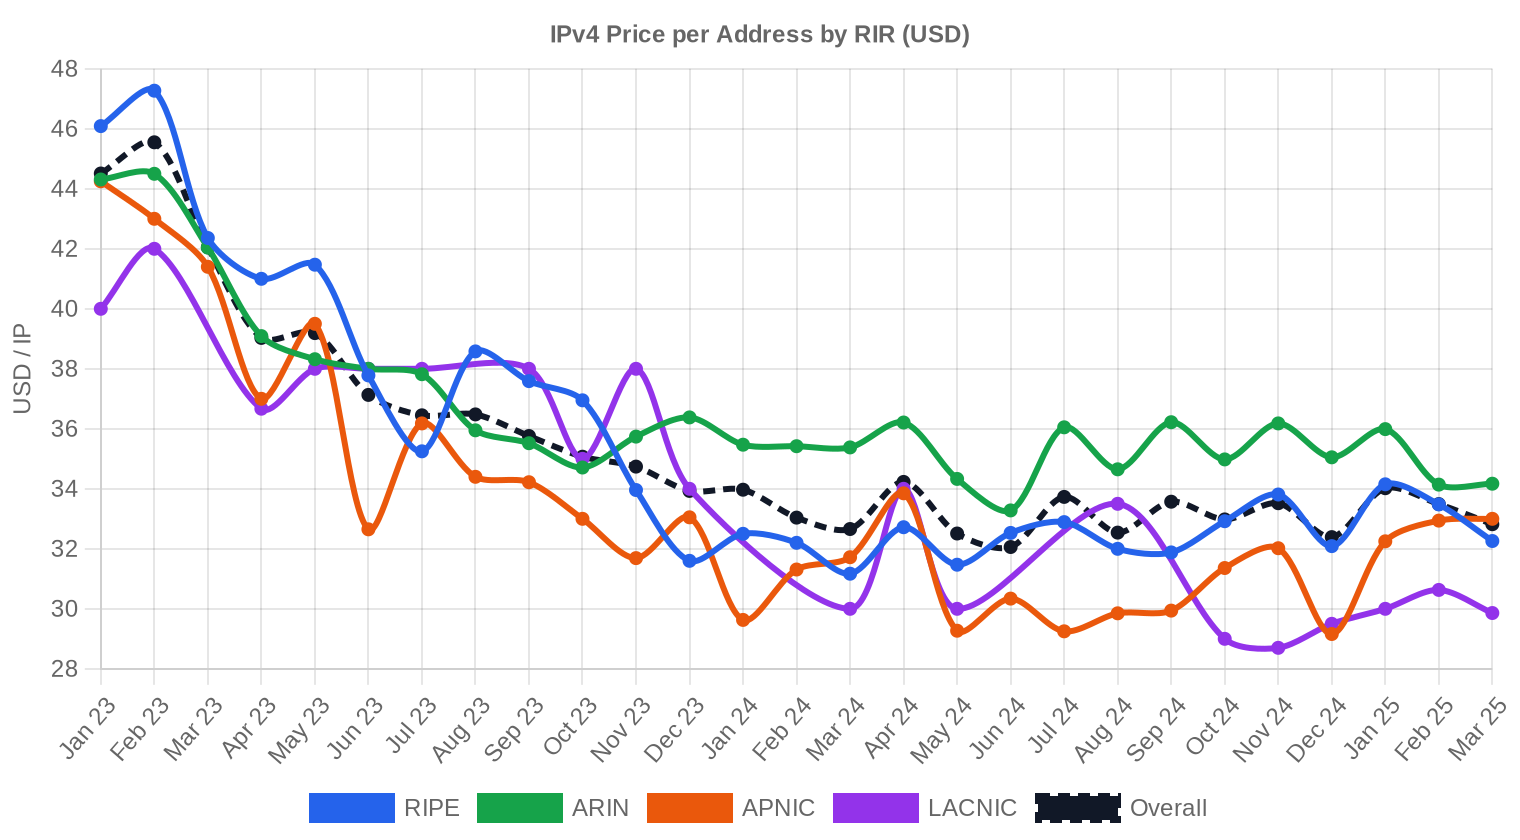
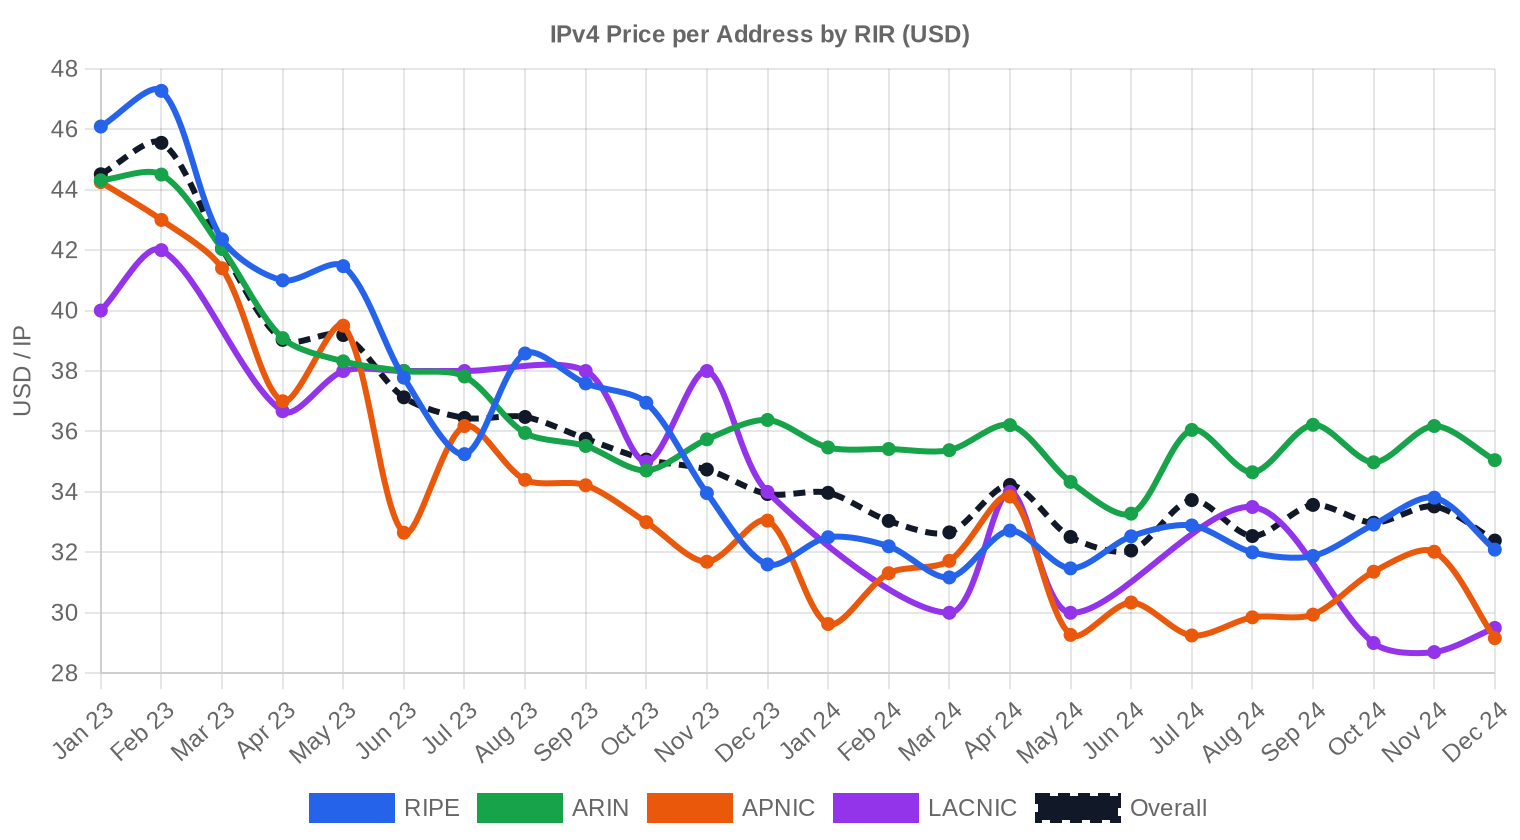
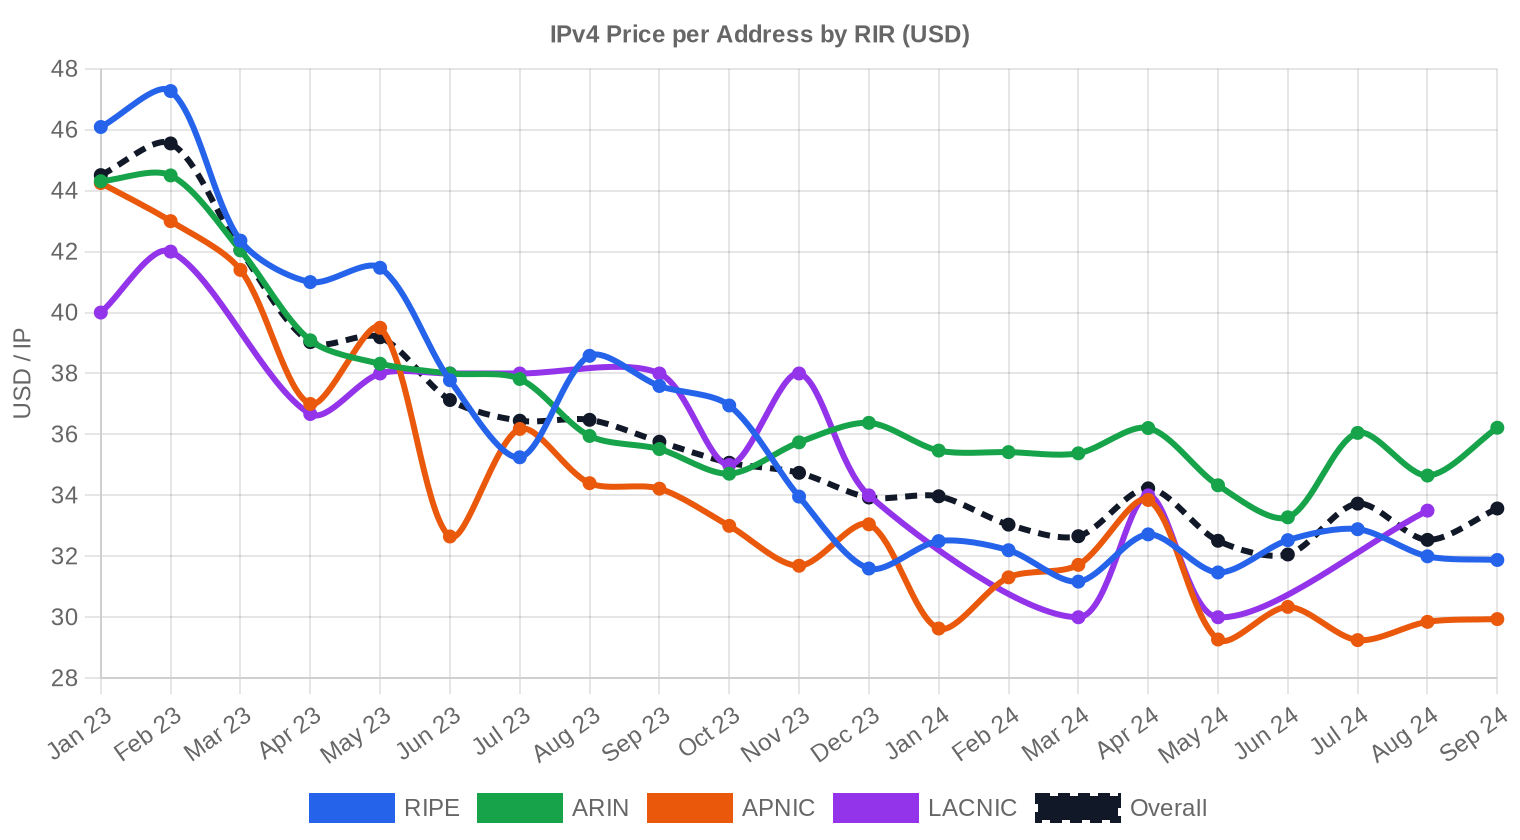
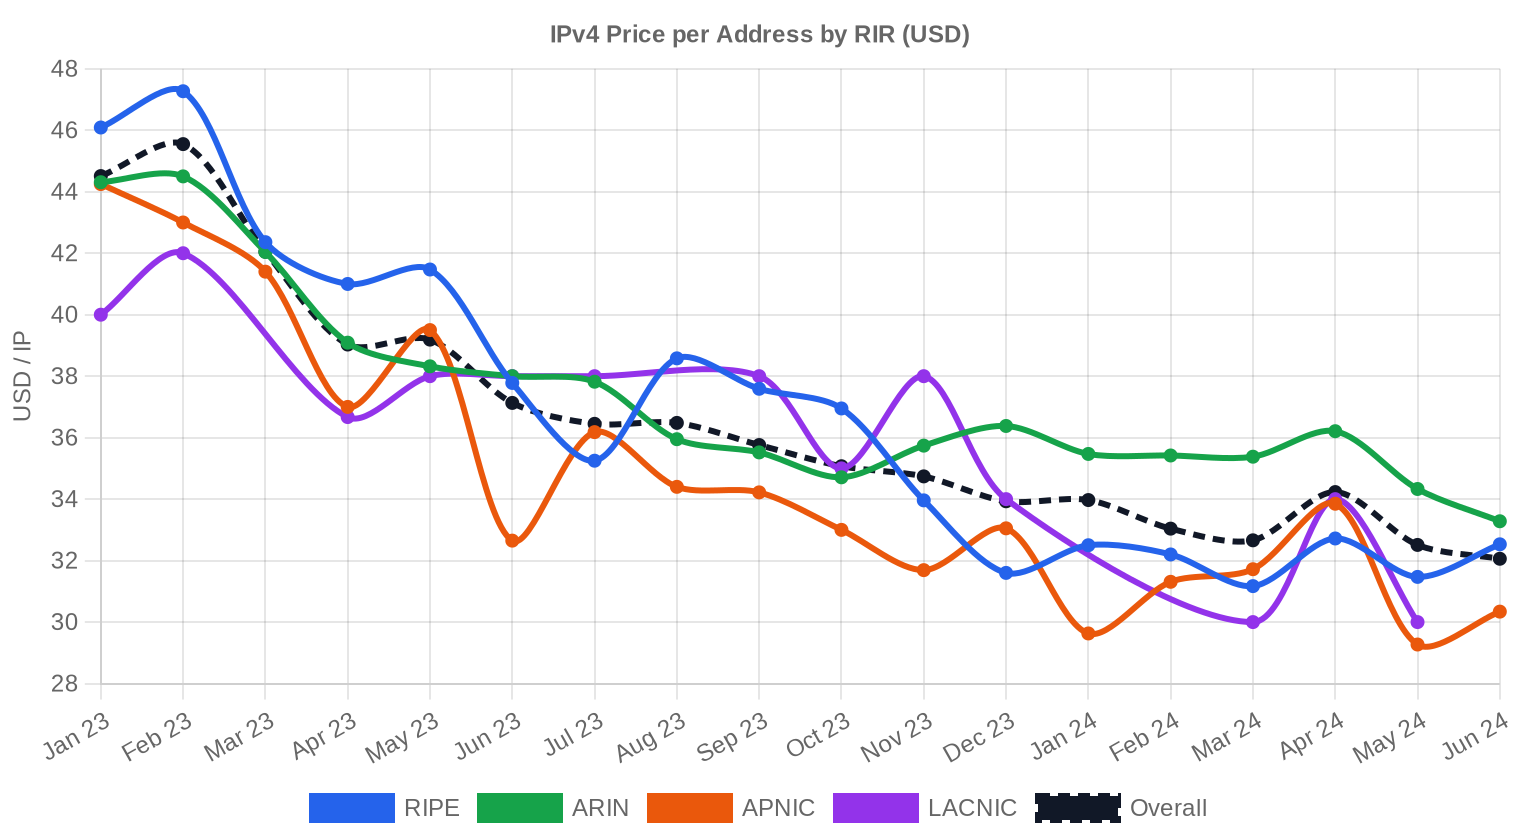
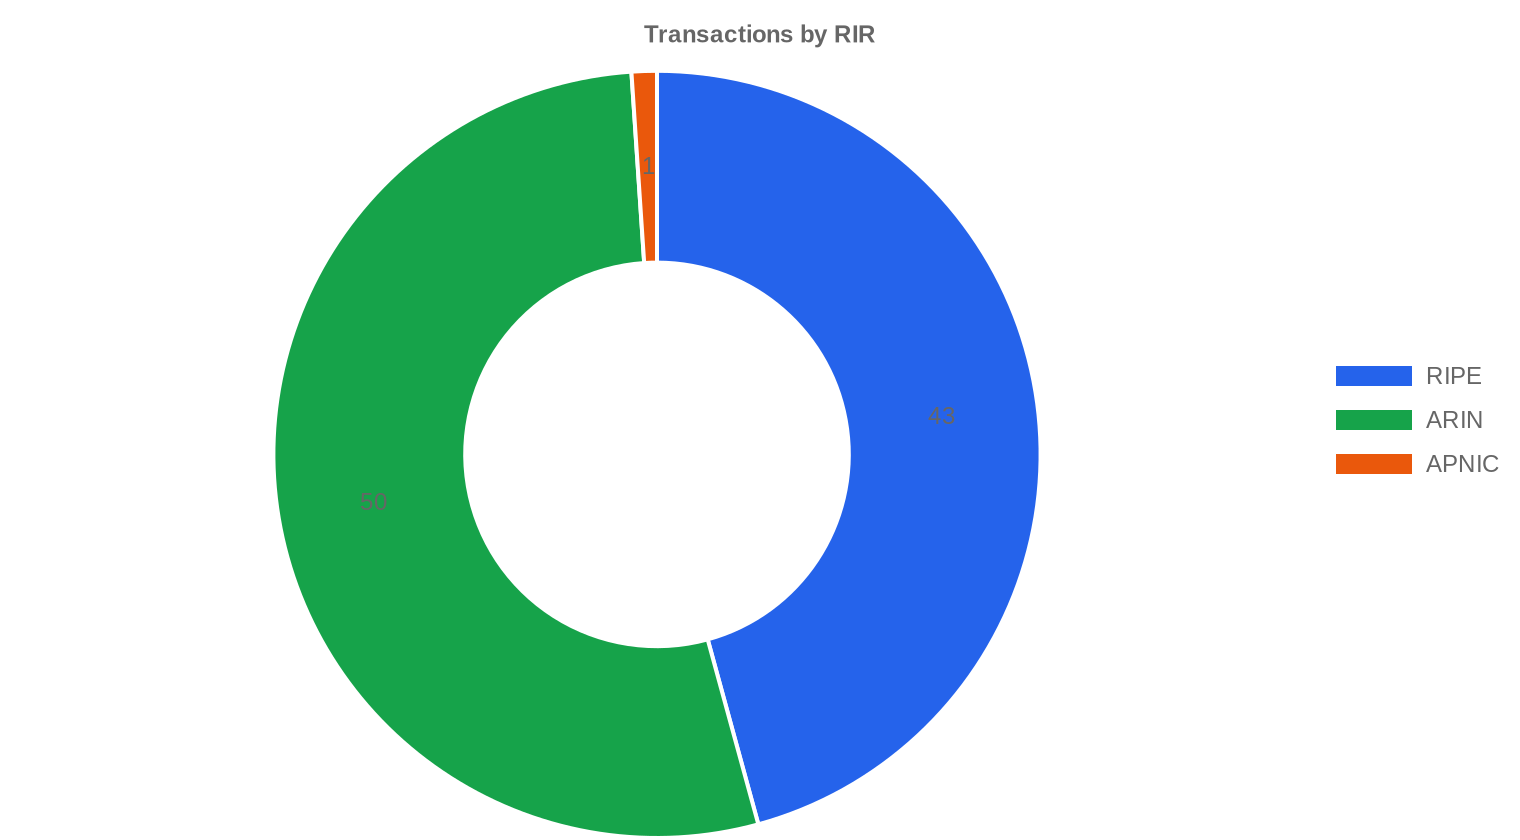
Pricing by RIR
ARIN captured 53.2% of transaction count and commanded the highest average at $21.37/IP, but that premium over RIPE has narrowed to just $1.59 — the tightest spread we've seen in the current downcycle. RIPE moved the lion's share of actual addresses: 656,640 IPs across 43 transactions at $19.78 average, reflecting the registry's dominance in bulk supply. APNIC registered a single transaction — 256 IPs at $21.00 flat — which tells us nothing statistically but confirms the continued near-absence of Asia-Pacific inventory on Western platforms. LACNIC and AFRINIC posted zero transactions for the month.ARIN: $21.37/IP across 50 transactions (53.2% of count)
RIPE: $19.78/IP across 43 transactions (45.7% of count)
APNIC: $21.00/IP across 1 transaction (1.1% of count)
LACNIC: No recorded transactions
AFRINIC: No recorded transactions
| RIR | Transactions | Avg $/IP | Median $/IP | IPs Traded | RIR Transfers | Next Month (proj.) | Year-End (proj.) |
|---|---|---|---|---|---|---|---|
| RIPE | 43 | $19.78 | $21.00 | 656,640 | 483 | $20.50 | $17.00 |
| ARIN | 50 | $21.37 | $22.50 | 211,968 | 370 | $22.00 | $19.00 |
| APNIC | 1 | $21.00 | $21.00 | 256 | 0 | $20.50 | $17.50 |
Transaction Volume

Supply & Block Sizes
/24 blocks dominated with 42 of 94 transactions — 44.7% of all deals. This concentration at the smallest transferable prefix tells us that enterprise buyers and smaller ISPs are the most active participants right now, purchasing single blocks for deployment rather than building inventory. Larger blocks are trading, but the six deals above $1 million (totaling $14.9 million in notional value) are happening off-market or through pre-arranged transfers where pricing is less transparent.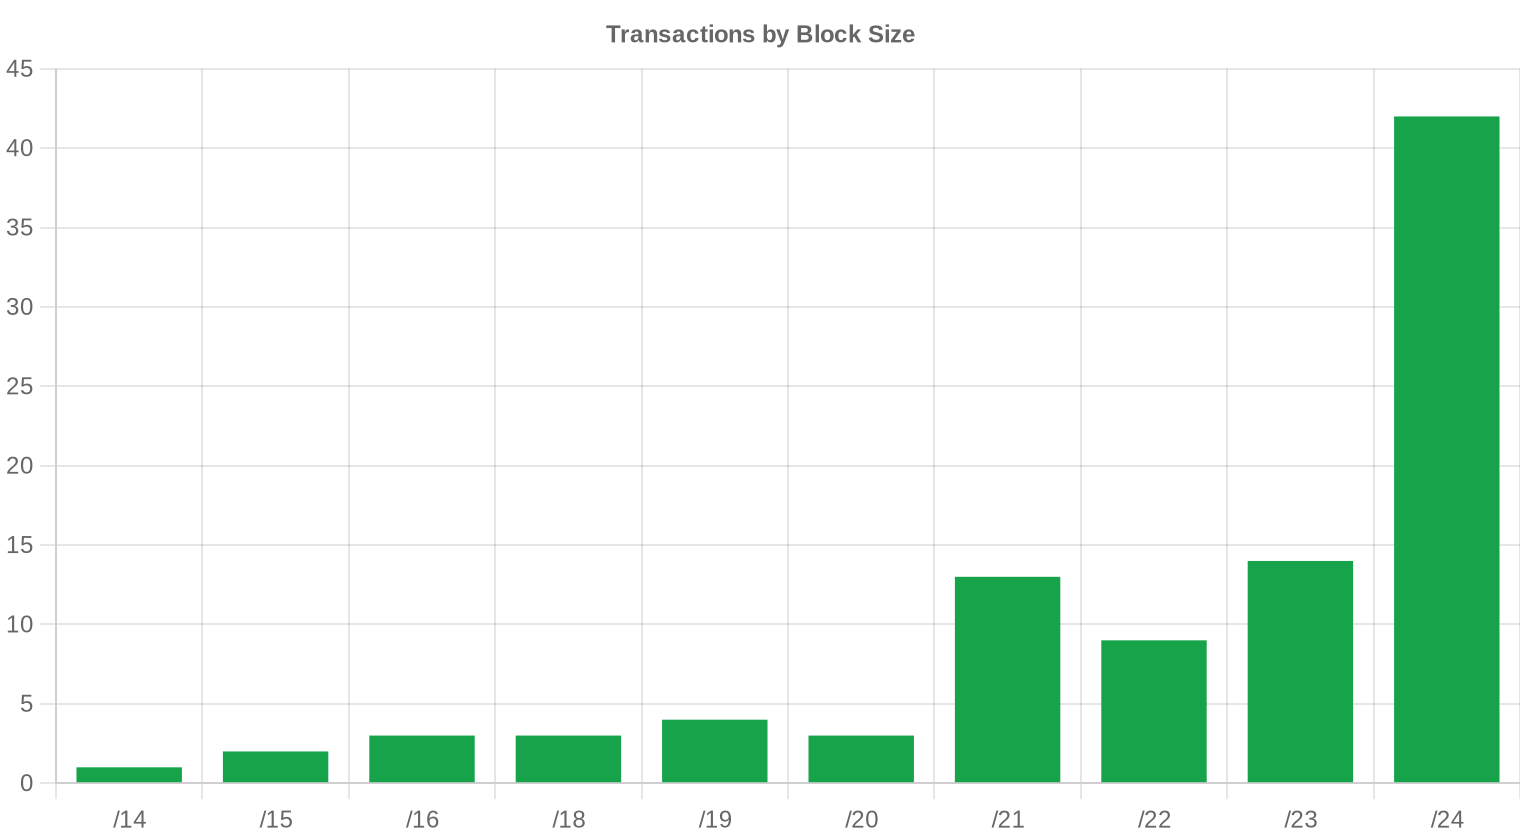
Geographic Activity
The US accounted for 47 of 94 transactions, a 50% share that has held remarkably steady across the past several quarters. The UK came in second with 22 deals — an outsized showing likely driven by RIPE-registered blocks held by UK entities. The Netherlands placed third at 4 deals, with Italy, Canada, and Ireland rounding out the top tier. Cross-border transactions involving multiple jurisdictions (GB/SG, FR/GB, GB/PL, etc.) made up a visible minority, reflecting the increasingly international nature of IPv4 portfolio management.Registry Transfer Activity
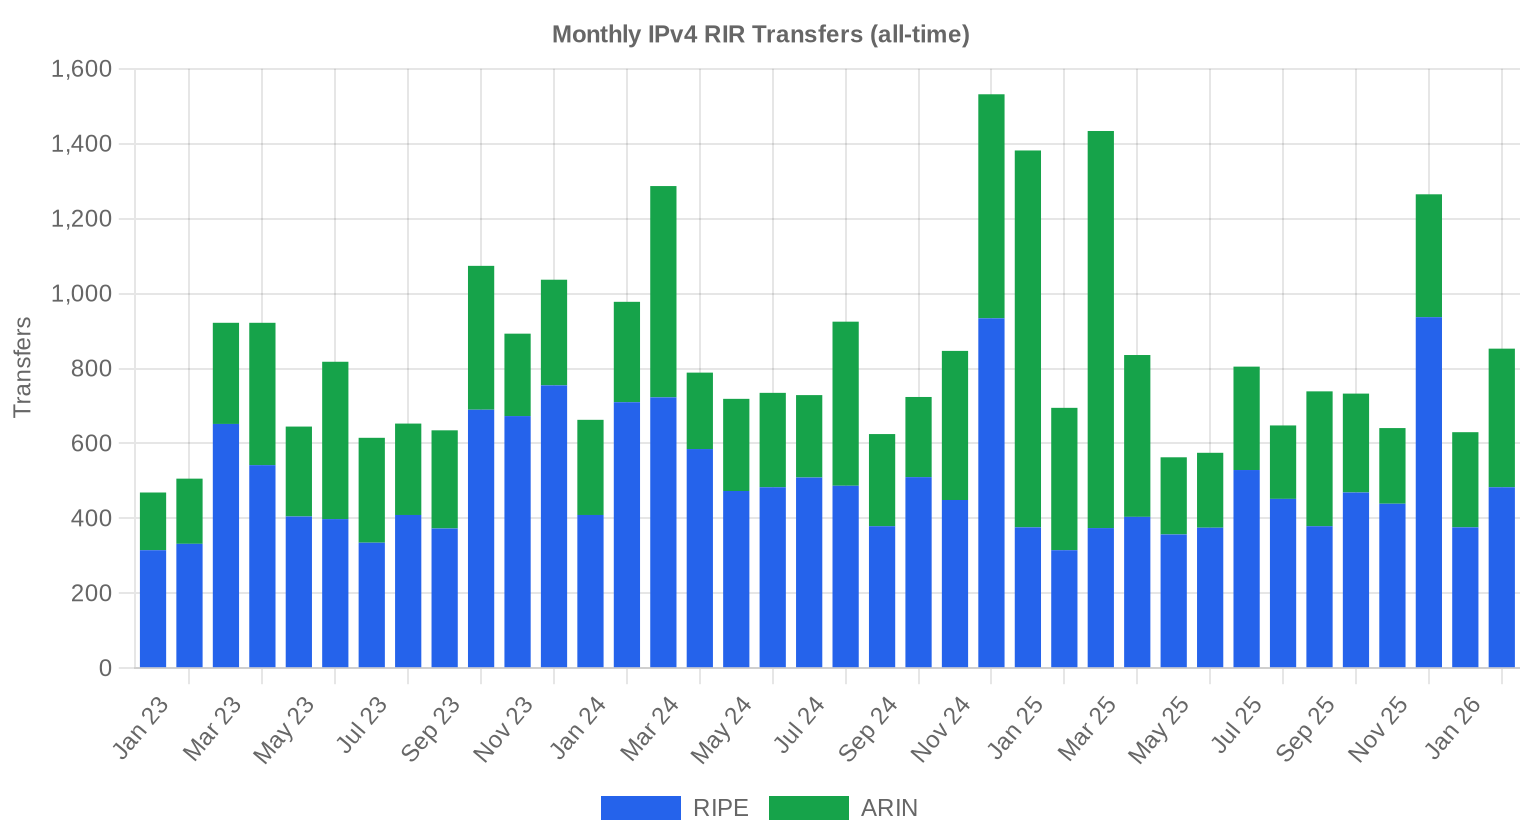
RIR-recorded transfers totaled 853 in February, with RIPE leading at 483 transfers (56.6%) versus ARIN's 370 (43.4%). The gap between total transfers (853) and priced transactions (94) remains wide — roughly 89% of recorded transfers lack publicly reported pricing, a persistent data challenge in this market. APNIC recorded zero transfers despite one priced deal appearing in our dataset, which likely reflects timing differences between transfer completion and registry recording.Long-Run Transfer Trends
Across the 38 months we've tracked, cumulative transfers stand at 31,541. The peak month was December 2024, which coincided with year-end portfolio cleanup and the initial panic around AWS's per-IP charges going into full effect. RIPE has accounted for 59.6% of all tracked transfers versus ARIN's 40.4% — a ratio that has held within a few percentage points for over two years now.| RIR | RIR Transfers |
|---|---|
| RIPE | 18,795 |
| ARIN | 12,746 |
| RIR Transfers | 31,541 |
Outlook & Forecast
Forecasting each block-size band and RIR separately with our AI model:
The overall average price per IP is projected to reach $17.27 by December 2026, with a next-month estimate of $19.57 per IP.
- RIPE: projected at $20.50 per IP next month, trending toward $17.00 by December 2026.
- ARIN: projected at $22.00 per IP next month, trending toward $19.00 by December 2026.
- APNIC: projected at $20.50 per IP next month, trending toward $17.50 by December 2026.
- LACNIC: projected at $29.50 per IP next month, trending toward $28.00 by December 2026.
- AFRINIC: insufficient data for a reliable forecast.
Forecast by Block Size
| Block | Current $/IP | Next Month | Year-End | Confidence |
|---|---|---|---|---|
| /24 | $23.00 | $22.50 (-2.2%) | $20.00 (-13.0%) | medium |
| /23 | $20.00 | $19.50 (-2.5%) | $17.00 (-15.0%) | medium |
| /22 | $19.88 | $19.50 (-1.9%) | $17.00 (-14.5%) | medium |
| /21 | $17.00 | $16.50 (-2.9%) | $14.50 (-14.7%) | medium |
| /20 | $15.75 | $15.50 (-1.6%) | $13.50 (-14.3%) | low |
| /19 | $14.00 | $13.50 (-3.6%) | $12.00 (-14.3%) | low |
| /18-/16 | $13.50 | $13.00 (-3.7%) | $11.50 (-14.8%) | low |
| /15-up | $10.00 | $10.00 (0.0%) | $9.00 (-10.0%) | low |
Editor's Take: Buy vs. Lease
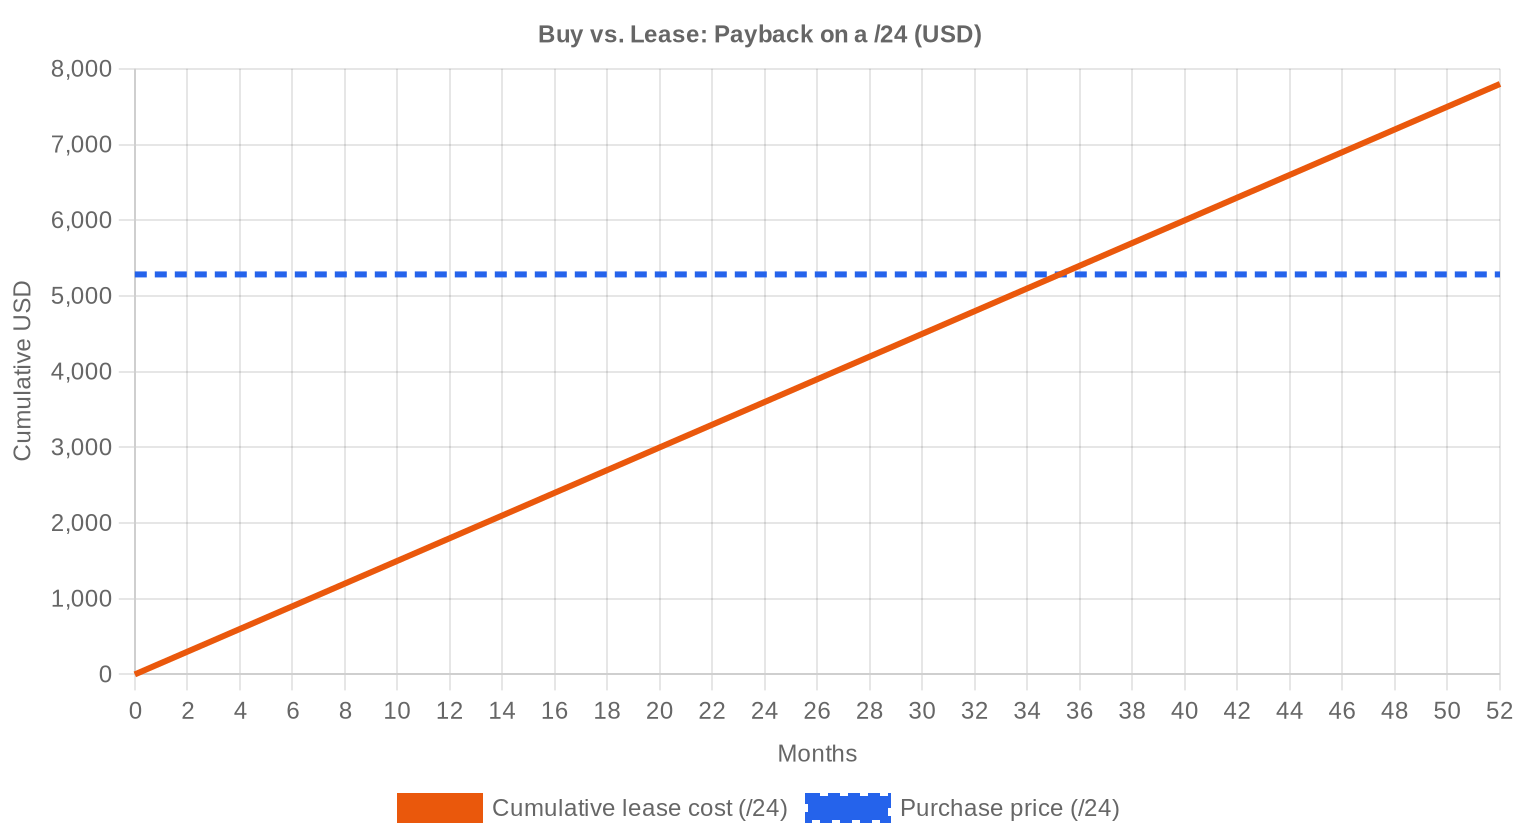
The buy-versus-lease math has shifted decisively toward purchasing. At current RIPE lease rates of $0.5859/IP/month ($150/month for a /24), the payback period on a buy at $20.64/IP is just 35.2 months — under three years. That implies an annualized yield of 34.1% for anyone holding blocks and leasing them out. For buyers who need addresses for their own infrastructure, paying $5,284 for a /24 outright versus $1,800/year in lease costs makes the acquisition a no-brainer at any holding period beyond three years. The only argument for leasing is if you need addresses for under 30 months and want zero balance-sheet commitment. With prices forecast to continue declining toward $17.27 by December, buyers may be tempted to wait — but the lease savings accrue immediately, and the current buy price already reflects significant markdown from 2024 levels.| /24 Purchase price | $5,284 |
| /24 Lease price | $150 / mo |
| Payback period | 35.2 mo (2.9 yr) |
| Gross annual yield | 34.1% |
What This Means for You
Buyers: You are in the strongest negotiating position since 2020. Average prices have compressed 38.4% year-over-year, and every data point suggests continued softness. If you have near-term deployment needs, buy now and capture the lease-cost savings. If your timeline is flexible, Q3-Q4 2026 could deliver sub-$18 pricing.Sellers: The window for $25+ per IP on standard blocks has closed outside of exceptional circumstances. Clean ARIN /24s still fetch premiums (up to $38.50 this month), but bulk inventory is clearing in the $19-21 range. If you're sitting on blocks you don't intend to use, the math favors selling now rather than watching prices erode another 15% by year-end.
Leasers: At $0.59/IP/month, RIPE lease rates haven't fallen as fast as purchase prices, which means the lease premium is widening. Reassess whether buying makes more sense for your use case — a 35-month payback is very attractive.
Block Holders: If you're leasing out inventory, your yield is currently 34.1% annualized against market value. That's exceptional for what is essentially a digital infrastructure asset. But recognize that both the numerator (lease income) and denominator (asset value) could compress. Lock in longer-term lease agreements where possible.
Browse verified IPv4 blocksSell IPv4 →
List your blocks with managed transferLease IPv4 →
Flexible short-term capacityLease Out IPv4 →
Turn idle blocks into recurring revenue
IPv4 Pricing by Block Size
/24 blocks remain the most actively traded prefix, and at the small end they command significant per-IP premiums — the $38.50/IP max this month almost certainly involved a clean ARIN /24. Larger blocks (/20 and above) are where the $9.50 floor prices appear, reflecting the 50-75% per-IP discount that bulk buyers have historically extracted. Six transactions exceeded $1 million in value this month, collectively representing $14.9 million — nearly 1.5x the total value of the other 88 deals combined.| Block | IPs | Buy: /IP | Buy: Total | Lease: /IP/mo | Lease: Monthly |
|---|---|---|---|---|---|
| /24 | 256 | $35–45 | $8,960–11,520 | $0.38–0.50 | $97–128 |
| /22 | 1,024 | $28–38 | $28,672–38,912 | $0.33–0.45 | $338–461 |
| /20 | 4,096 | $22–32 | $90,112–131,072 | $0.30–0.40 | $1,229–1,638 |
| /18 | 16,384 | $20–30 | $327,680–491,520 | $0.30–0.38 | $4,915–6,226 |
| /16 | 65,536 | $18–28 | $1,179,648–1,835,008 | $0.30–0.35 | $19,661–22,938 |
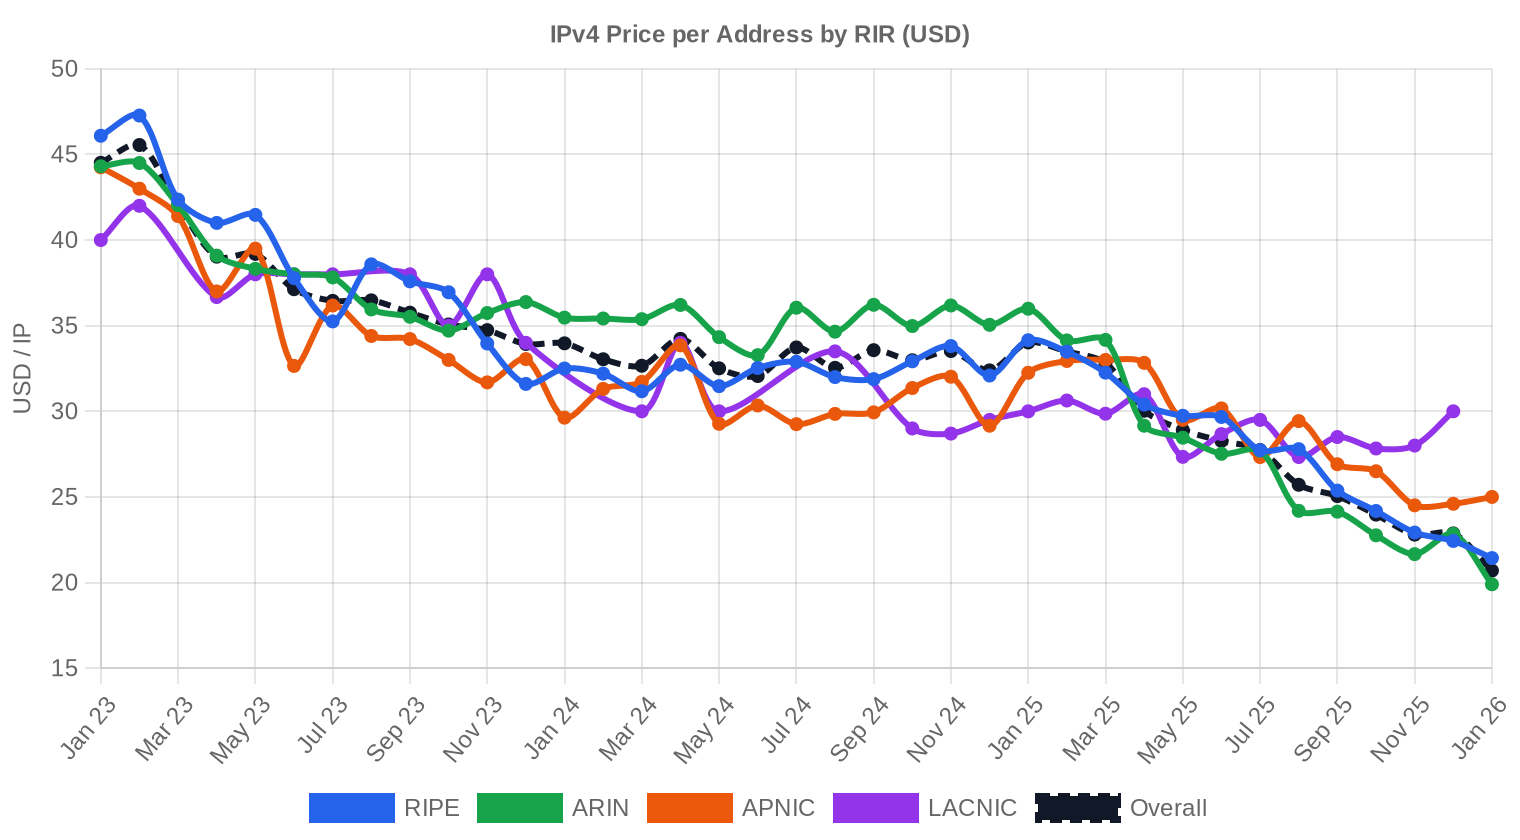
IPv4 Price History: 2011–2026
When IANA exhausted its free pool in 2011, IPv4 addresses barely traded at $5/IP. Prices climbed steadily through the 2010s, accelerating past $25 in 2021 and peaking near $35-40 for /24 blocks in late 2023. AWS's decision to charge $0.005/hour per public IPv4 address (effective February 2024) triggered a structural repricing as cloud workloads shed unnecessary allocations and returned blocks to the market. We are now in the second year of that correction, with the weighted average at $20.64 — roughly where the market sat in mid-2021.| Year | ~Price/IP | Key Event |
|---|---|---|
| 2011 | $7–12 | IANA free pool exhausted; Microsoft/Nortel deal ($11.25/IP) |
| 2012 | $8–12 | RIPE NCC reaches last /8; begins /22-only allocation |
| 2014 | $10–15 | LACNIC free pool exhausted |
| 2015 | $8–15 | ARIN free pool exhausted |
| 2017–18 | $12–18 | Leasing market grows; cloud demand rises |
| 2019 | $18–24 | RIPE NCC exhausts remaining free pool |
| 2021–22 | $50–60+ | Post-pandemic peak; hyperscaler build-outs |
| 2024 | $35–52 | AWS IPv4 charge ($0.005/IP/hr); large block correction |
| 2025–26 | $18–45 | Market bifurcation; /16s below $20 for first time since 2019 |
Market Structure: Who Is Buying & Selling
The buyer base has rotated. Cloud providers and hyperscalers, which drove prices to peak levels in 2022-2023, have largely completed their hoarding cycles and are now net neutral or net sellers of smaller allocations. The active buyers today are mid-tier ISPs, hosting companies, and enterprises with on-premises infrastructure that can't migrate to IPv6 quickly. On the sell side, legacy holders who received free allocations in the 1990s continue to monetize, and we're seeing a steady trickle of blocks from bankruptcy estates and corporate divestitures.IPv4 vs. Other Asset Classes
At a 34.1% annualized yield (buy at $20.64, lease at $7.03/year), IPv4 addresses outperform virtually every conventional asset class — US 10-year Treasuries at ~4.3%, S&P 500 dividend yield at ~1.3%, and even most commercial real estate at 6-8% cap rates. The catch is liquidity risk and the secular decline in asset value: if purchase prices fall to $17.27 by December as forecast, holders face a 16% capital loss against the income stream. Net of depreciation, the effective yield is still north of 15%, which remains compelling for investors comfortable with the asset class.| Asset Class | Typical Yield | Liquidity | Primary Risk |
|---|---|---|---|
| IPv4 | 34.1% | Moderate | IPv6 adoption, block quality |
| Commercial Real Estate | 5–8% | Low | Vacancy, rate cycle |
| Investment-Grade Bonds | 4–5% | High | Duration, credit risk |
| S&P 500 | ~1,3% | High | Market volatility |
| Money Market / T-Bills | ~4–5% | High | Rate cycle changes |
IPv6 Adoption & Why IPv4 Remains Essential
IPv6 adoption continues its slow crawl — Google's measurements hover around 45% of traffic globally, but enterprise internal networks and legacy telecom infrastructure remain overwhelmingly v4. The dual-stack reality will persist well into the 2030s. For any organization that needs to reach the full internet, including the long tail of v4-only endpoints, IPv4 addresses remain a hard requirement, not an optional luxury.AI & Cloud Infrastructure Demand
AI training clusters and inference farms require massive network connectivity, and most of it runs over IPv4. The buildout of GPU-dense data centers by hyperscalers and AI startups has created a secondary demand channel that partially offsets the softening from cloud workload optimization. That said, most AI infrastructure is deployed behind relatively small public-facing IP footprints — the heavy traffic runs over private interconnects — so the demand uplift is real but moderate compared to the broader market forces pushing prices down.What Determines IPv4 Block Value
Block valuation is not just about size. Clean reputation (no blacklist entries, no spam history), allocation age (older blocks from the early ARIN/RIPE era carry slightly less stigma), and RIR jurisdiction all matter. ARIN blocks command a $1.59/IP premium over RIPE this month, partly due to the simpler transfer process and partly due to US buyer preference for ARIN-registered space. Blocks with active abuse complaints or recent spam activity can trade at 30-50% discounts to clean equivalents.Sell vs. Lease: A Decision Framework
In a declining-price environment, the math increasingly favors selling over holding for passive income — a block worth $20.64/IP today may only fetch $17.27 in ten months, representing a $3.37/IP capital loss that wipes out roughly six months of lease income. The exception is holders with long-term lease contracts already locked in at current rates: their income stream is secured regardless of where spot prices go. For uncommitted blocks, selling now and redeploying the capital elsewhere looks like the higher-NPV decision.| /24 Purchase price | $5,284 |
| /24 Lease price | $150 / mo |
| Payback period | 35.2 mo (2.9 yr) |
| Gross annual yield | 34.1% |
RIPE NCC 24-Month Transfer Restriction
RIPE's 24-month holding requirement continues to act as a supply throttle, preventing rapid flipping and creating a natural lag between acquisition and resale eligibility. Blocks acquired during the 2024 price peak are locked until late 2026, and many of those holders will be sitting on significant unrealized losses when they become eligible for transfer. This overhang could accelerate selling pressure in Q4 2026 and into 2027 as those positions unlock.Deal Size Distribution
The market is heavily skewed toward small deals. Of 94 transactions, 78 (83%) were under $50,000 in total value, accounting for just $1.1 million — barely 11% of total deal value. Meanwhile, the 6 transactions above $1 million represented $14.9 million, or roughly 60% of the month's estimated block-level value. Average deal size fell to 107,589 IPs from 119,021 in January and is down dramatically from 298,800 in February 2025, confirming the market's shift toward smaller, more frequent trades.Top Trading Countries
The US dominated with 47 transactions, consistent with its position as both the largest source of legacy allocations and the largest consumer of IP space for cloud and enterprise deployment. The UK's 22 deals reflect London's role as the primary RIPE transfer hub — many nominally UK transactions involve pan-European networks registered through UK entities. The Netherlands' 4 deals align with its status as a major hosting and colocation market, anchored by Amsterdam's dense interconnection ecosystem.BEAD Broadband Program Impact
The $42.45 billion BEAD program is entering its disbursement phase in 2026, and regional ISPs building last-mile broadband infrastructure will need IPv4 allocations for subscriber management and CPE provisioning. Most of these buyers will be shopping for /20 to /18 blocks — mid-size inventory that is already relatively scarce. We expect BEAD-driven demand to provide a modest floor under mid-size block prices even as the broader market trends lower, potentially creating a temporary dislocation between small-block and mid-block pricing later this year.Hyperscaler IPv4 Holdings
Amazon, Microsoft, Google, and Apple collectively control an estimated 150+ million IPv4 addresses. AWS's per-IP charge policy has already prompted customers to release millions of addresses back into the pool, and Microsoft's recent Elastic IP pricing adjustments suggest a similar dynamic may emerge on Azure. Any decision by a hyperscaler to sell even a fraction of their holdings would materially impact supply — but so far, none has shown interest in doing so, preferring to maintain strategic reserves.Macroeconomic Conditions & Market Impact
Central bank rate cuts remain on hold in the US and EU as of early 2026, which keeps corporate cost-of-capital elevated and IT budgets under scrutiny. Enterprise buyers are more price-sensitive than they were in 2022-2023, and discretionary infrastructure spending — including IPv4 acquisitions — faces tougher internal approval hurdles. The silver lining for the market is that IPv4 is often a non-discretionary purchase: you need addresses to put services online, regardless of what the CFO thinks about cap-ex timing.Model Update & Calibration
As part of our continuous improvement process, we backtested previous forecasts against realised prices and fine-tuned the model accordingly. Recent months now carry more influence than older data, and the confidence bands have been widened or narrowed based on how well they captured actual outcomes in the past. You can see the full backtest results in the table and chart below.

| Report Period | Target Month | Predicted | Actual | Deviation |
|---|---|---|---|---|
| 2025-H1 | 2025-07 | $28 | $28 | -1% |
| 2025 | 2026-01 | $22 | $21 | +6% |
| 2025-Q2 | 2025-07 | $28 | $28 | -1% |
| 2025-Q3 | 2025-10 | $25 | $24 | +5% |
| 2025-H2 | 2026-01 | $22 | $21 | +5% |
| 2025-Q4 | 2026-01 | $22 | $21 | +4% |
Methodology
Figures are based on completed IPv4Center marketplace transactions and RIR transfer statistics. Prices are in US dollars per IP address. Forecasts are produced by an AI model that analyses each block-size band and RIR segment separately (with outlier-trimmed medians) alongside known market catalysts; they are estimates, not guarantees.
Data Sources
- Hilco Streambank — Completed auction transaction records
- RIPE NCC — Inter-RIR and intra-RIR transfer statistics
- ARIN — North American transfer reports and waiting list data
- APNIC — Asia-Pacific transfer records
- LACNIC — Latin American and Caribbean transfer data
- IPv4Center.com — Proprietary marketplace transaction and lease pricing data
This report is generated automatically for informational purposes only and does not constitute financial advice.
Frequently Asked Questions
What was the average price per IPv4 address in February 2026?
The market-wide average landed at .64 per address, with a median of .75. The spread between average and median suggests a modest drag from a handful of discounted bulk lots pulling the mean lower.
How many transactions closed in February 2026, and what was the total market value?
We tracked 94 priced transactions covering 868,864 addresses for a combined market value of approximately .1 million. Average deal size was roughly 107,589 IPs — skewed upward by several large RIPE blocks.
Which RIR commanded the highest prices in February 2026?
ARIN addresses fetched the premium at .37 average (.50 median), versus RIPE's .78 average (.00 median). ARIN's price ceiling was also markedly higher — .50 versus .00 for RIPE — reflecting tighter North American supply and stronger domestic demand.
Why is the ARIN-RIPE price gap narrower than it used to be?
At roughly .59 per IP (ARIN .37 vs. RIPE .78), the spread has compressed as RIPE supply continues to dominate volume. RIPE accounted for 656,640 of the 868,864 IPs transacted — roughly 75% of volume — so its pricing increasingly anchors the global benchmark.
What does the price range of .50 to .50 tell us about market segmentation?
The nearly 4:1 ratio between floor and ceiling reveals a deeply stratified market. Sub- prints typically reflect large /16-and-above blocks with reputation risk or RIPE legacy baggage; + trades are clean, small ARIN blocks — often /24s — purchased by enterprises with low price sensitivity and high compliance requirements.
How did /24 blocks perform relative to the broader market?
/24s were the most actively traded prefix, accounting for 42 of 94 transactions (45%). Small-block premiums remain intact: /24 buyers are typically paying at or above the .75 median because they lack the volume leverage that large-block acquirers enjoy.
Is the IPv4 market trending up or down right now?
Down. Prices declined approximately 2.06% month-over-month. Our model projects a further drift to roughly .57 in March 2026 and .27 by year-end — a cumulative decline of about 16% from current levels if the trajectory holds.
How reliable is the forecast calling for .27 per IP by December 2026?
We flag this forecast as reliable based on current regression confidence intervals. That said, 'reliable' means directionally sound, not precise to the penny. A supply shock — say, a large carrier liquidation or an ARIN policy change — could accelerate or arrest the decline.
What mistakes should buyers avoid in a declining price environment?
The cardinal sin is overpaying for urgency. With prices trending toward .27 by year-end, a buyer locking in a + deal today on a non-critical allocation is effectively paying a 25%+ premium over what patience might yield. Unless operational need is immediate, phased procurement or short-term leasing is the sharper play.
What are the risks of waiting too long to buy if prices are falling?
Declining prices can tighten supply as sellers pull inventory. We've seen this before — once the market perceives a floor, available blocks evaporate and prices snap back. Buyers with specific size or cleanliness requirements should not assume infinite supply at lower prices; the good blocks go first.
Should I buy or lease IPv4 addresses at current rates?
Buy. At .5859 per IP per month for leasing versus a .64 purchase price, the breakeven is just 35.2 months — under three years. Buyers with a time horizon beyond that are better off owning the asset outright, especially given the implied annual yield of 34.1% that ownership provides relative to leasing costs.
What does a 34.1% implied annual yield on ownership mean in practical terms?
It means that if you buy a /24 at ,284 instead of leasing it at 0/month (,800/year), you're effectively earning a 34.1% return on deployed capital by avoiding lease payments. In any other asset class, that would be an extraordinary yield — and it underscores how expensive leasing has become relative to purchase prices.
What are the risks of leasing rather than buying at current market rates?
At current rates, lessees pay back the full purchase price in just 2.9 years and keep paying thereafter — dead money. Additionally, lessees bear counterparty risk: if the lessor defaults, gets acquired, or reclaims the block, the lessee faces operational disruption with no asset to show for cumulative payments.
Which countries dominated IPv4 buying activity in February 2026?
The United States led decisively with 47 transactions, followed by the United Kingdom at 22 and the Netherlands at 4. The US-UK axis accounted for roughly 73% of all deals — consistent with the ARIN and RIPE dominance of the transfer registries.
Was there any APNIC, LACNIC, or AFRINIC activity worth noting?
Barely. APNIC recorded a single transaction — 256 addresses at .00 per IP. LACNIC and AFRINIC posted zero priced transactions. The secondary market remains overwhelmingly an ARIN-RIPE duopoly, with those two RIRs combining for 99.9% of transacted value.
How did RIPE and ARIN compare on total transfer activity beyond priced sales?
RIPE recorded 483 total transfers versus ARIN's 370, for a combined 853. RIPE's 59.6% share of the 38-month cumulative transfer base confirms its position as the world's most liquid IPv4 marketplace, driven by Europe's fragmented ISP landscape and relatively permissive transfer policies.
What did deal-size distribution look like in February 2026?
The market was bottom-heavy: 78 of 94 transactions (83%) were under K, totaling just .1 million. Meanwhile, six deals exceeding million accounted for a staggering .9 million — roughly 83% of total implied value. The market is retail by count, institutional by dollars.
Is IPv6 adoption finally killing the IPv4 market?
Not killing it — eroding it. The 2.06% monthly decline and our .27 year-end forecast suggest IPv6 displacement is a slow bleed, not a guillotine. Enterprises still need IPv4 for legacy infrastructure, NAT avoidance, and regulatory compliance. The market will shrink, but it won't vanish in 2026.
What should sellers be doing given the downward price trend?
Monetize sooner rather than later. If our year-end projection of .27 holds, a seller sitting on inventory at today's .64 average is looking at roughly 16% depreciation over ten months. For holders with no operational need for the space, this is a depreciating asset — unusual for IP addresses, but the new reality.
How long does a typical IPv4 transfer take to complete?
ARIN transfers generally close in 2–4 weeks assuming clean WHOIS records and responsive parties. RIPE can be faster — often under two weeks — thanks to more streamlined approval workflows. Cross-RIR transfers remain impractical in most cases due to policy restrictions.
What due diligence mistakes do buyers most commonly make?
Three recurring errors: failing to check blocklist/reputation status before closing, neglecting to verify that the seller has proper authorization (especially with legacy ARIN blocks), and ignoring subnet history that could trigger spam filters post-transfer. A clean WHOIS record is not the same as a clean block.
Why did the average deal size jump to 107,589 IPs — is that normal?
It's elevated and largely an artifact of several very large RIPE transactions. RIPE moved 656,640 IPs across just 43 deals, implying an average north of 15,000 IPs per RIPE transaction. Strip out the top five deals and the median buyer is still purchasing /24s and /22s.
Are there any bright spots for price bulls in this data?
ARIN's .50 ceiling print and .50 median demonstrate that premium, small-block pricing remains robust for clean North American space. If you're selling a well-documented /24 with no reputation issues, you're still extracting a meaningful premium over the market average — the softness is concentrated in large, commoditized blocks.
What risks does a further price decline pose to the broader transfer market?
The main risk is a liquidity trap. If sellers perceive prices as temporarily depressed, they pull inventory — but if buyers simultaneously delay purchases expecting further drops, transaction volume collapses and price discovery becomes unreliable. February's 94 transactions suggest we're not there yet, but the 2.06% decline bears watching.
How should institutional buyers think about IPv4 as an asset class heading into mid-2026?
Think of it as a wasting asset with strong near-term cash flow utility — analogous to a depleting natural resource. The buy-vs-lease math still overwhelmingly favors ownership for any horizon beyond three years, but the days of IPv4 as an appreciating store of value appear to be over. Acquire what you need operationally; speculative inventory is no longer prudent.