26 min read
This report analyzes the IPv4 transfer market for First Half 2026, based on completed IPv4Center marketplace transactions and official RIR transfer records.
Executive Summary
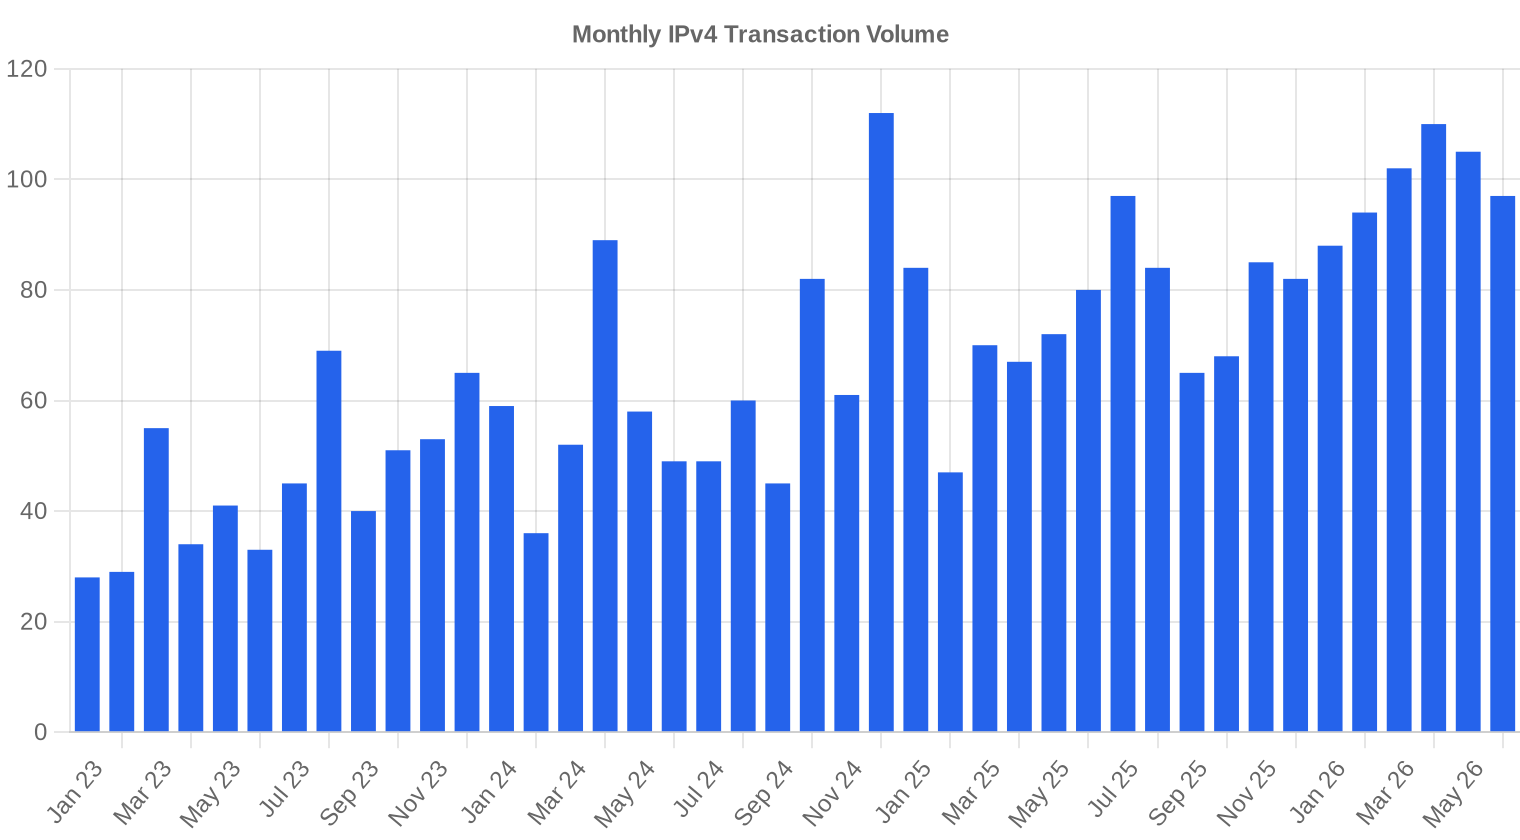
The IPv4 transfer market processed 596 transactions covering 5,016,064 addresses in the first half of 2026, generating $58.5 million in total value. The average price per IP settled at $20.04, a 19.1% drop from H2 2025 and a stark 35.7% decline from H1 2025 — the sharpest year-over-year correction since organized trading began. Transaction volume rose 23.9% over the prior half despite the price compression, suggesting sellers are accepting lower bids rather than sitting on inventory. The median held at $20.00, tight against the average, which signals a market finding a floor rather than one in chaotic free-fall. ARIN accounted for 48.7% of all deals, but RIPE led on aggregate transfer filings.Market Overview
| Transactions | 596 |
| IP Addresses Traded | 5,016,064 |
| Estimated Market Value | $58,461,264 |
| Average Price / IP | $20.04 |
| Median Price / IP | $20.00 |
| RIR Transfers | 3,972 |
Year-over-Year Comparison
| Metric | This period | A year earlier (H1 2025) | Change |
|---|---|---|---|
| Transactions | 596 | 420 | +41.9% |
| IP Addresses Traded | 5,016,064 | 1,954,304 | +156.7% |
| Estimated Market Value | $58,461,264 | $49,699,677 | +17.6% |
| Average Price / IP | $20.04 | $31.15 | -35.7% |
| RIR Transfers | 3,972 | 5,485 | -27.6% |
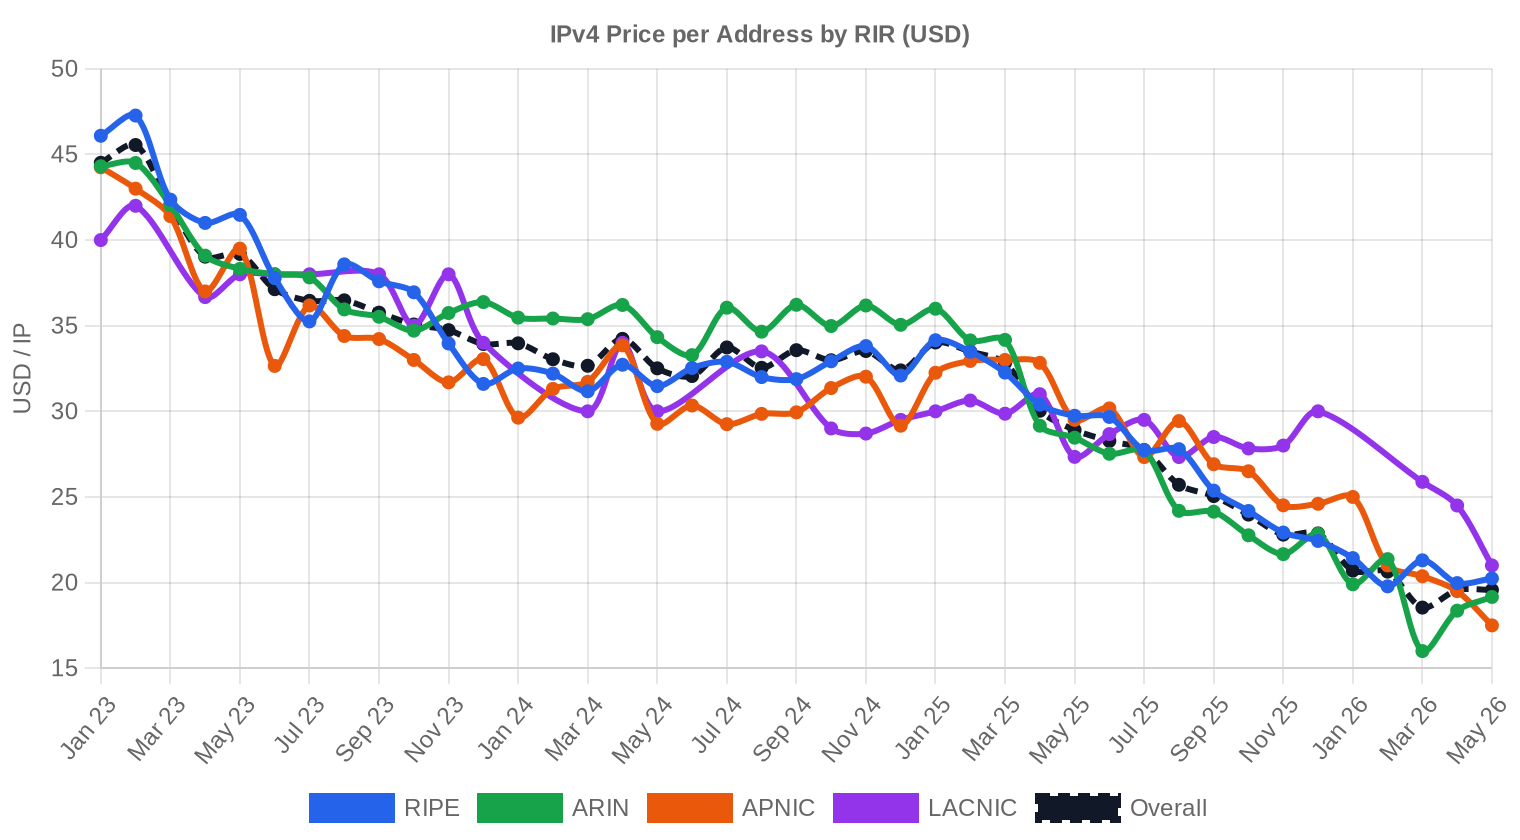
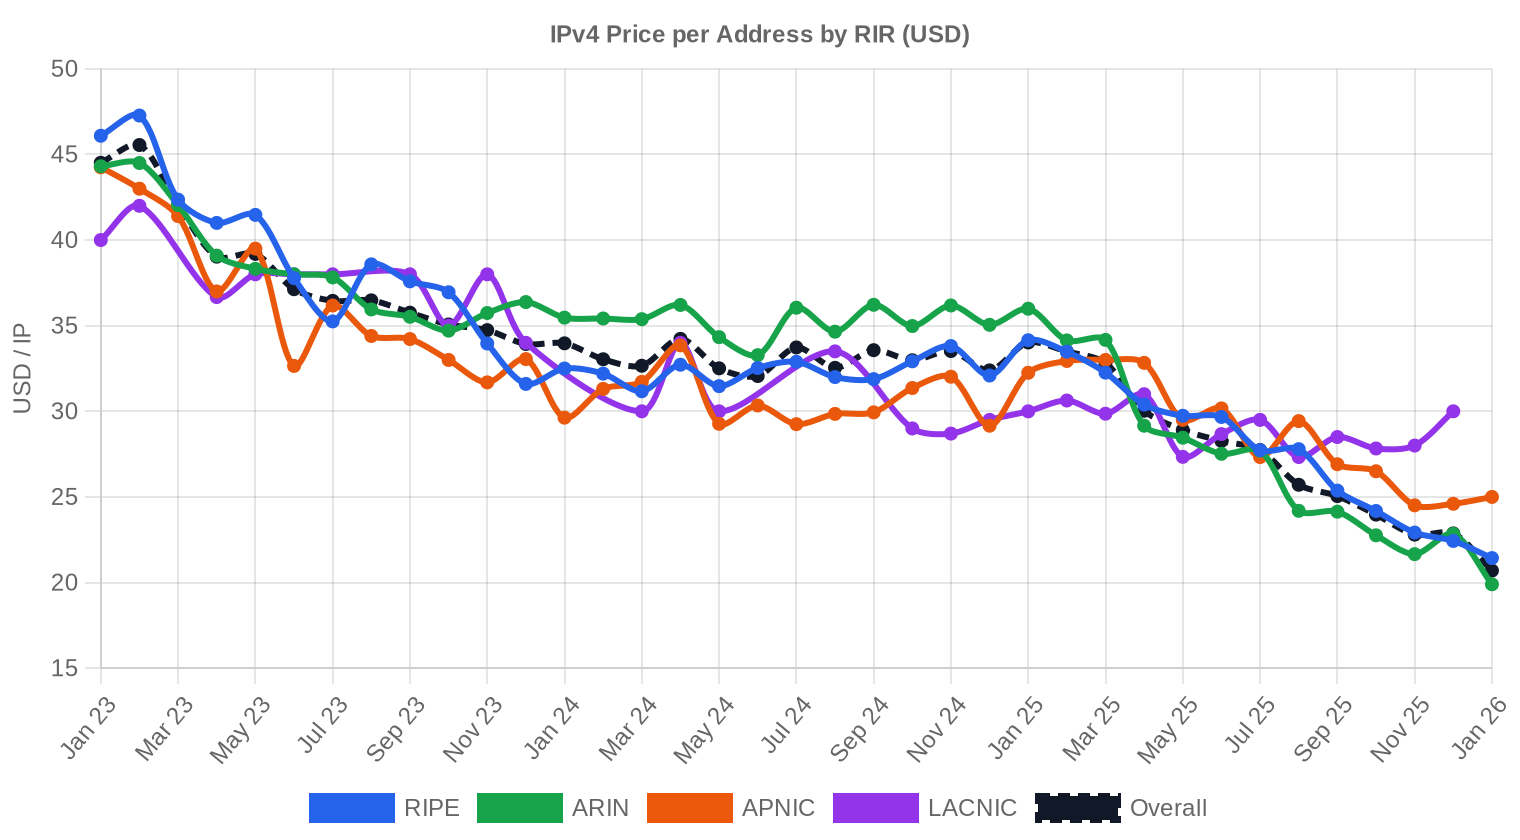
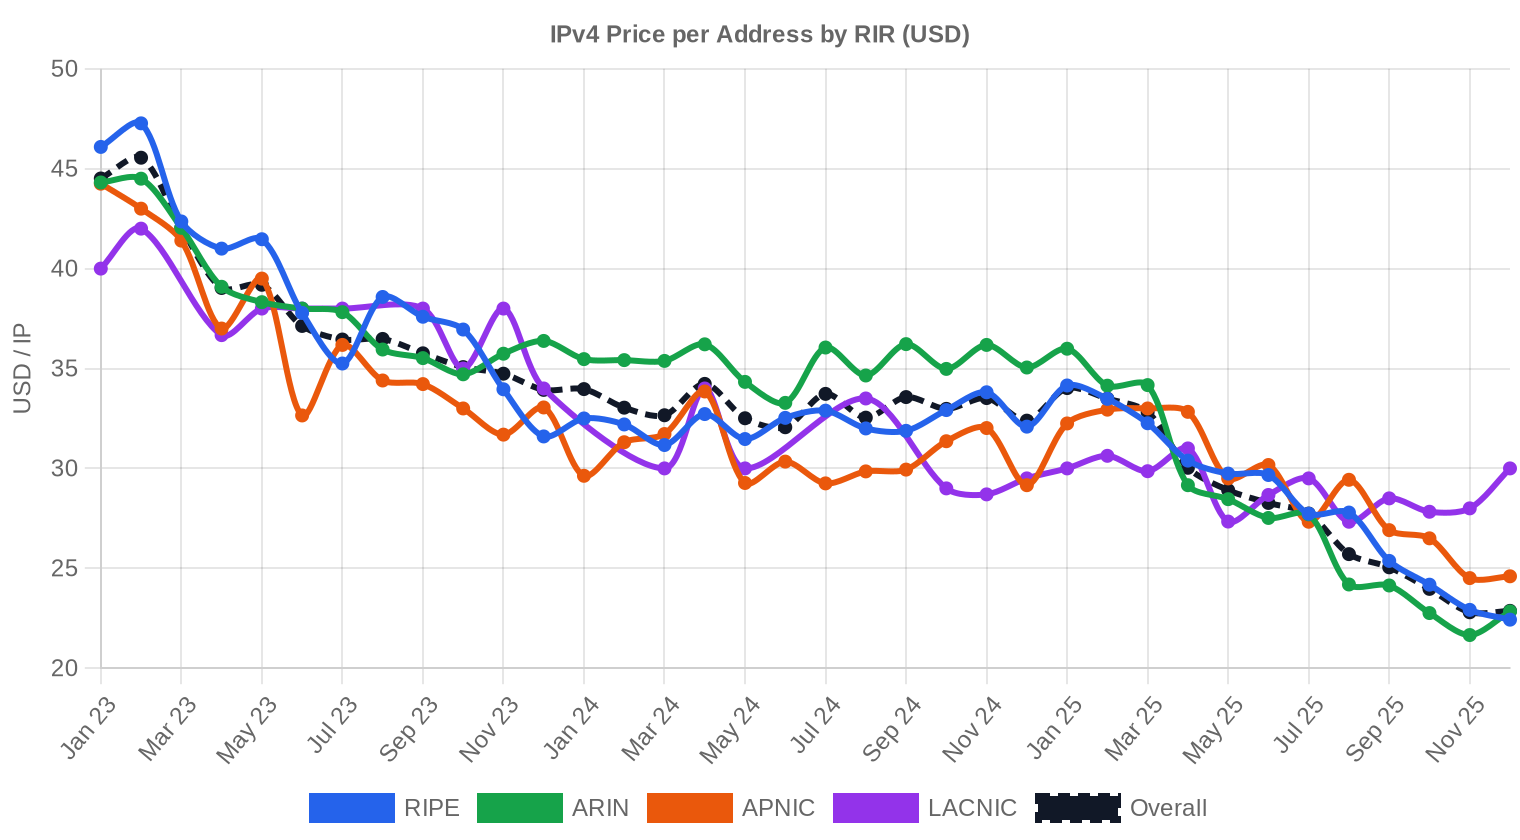
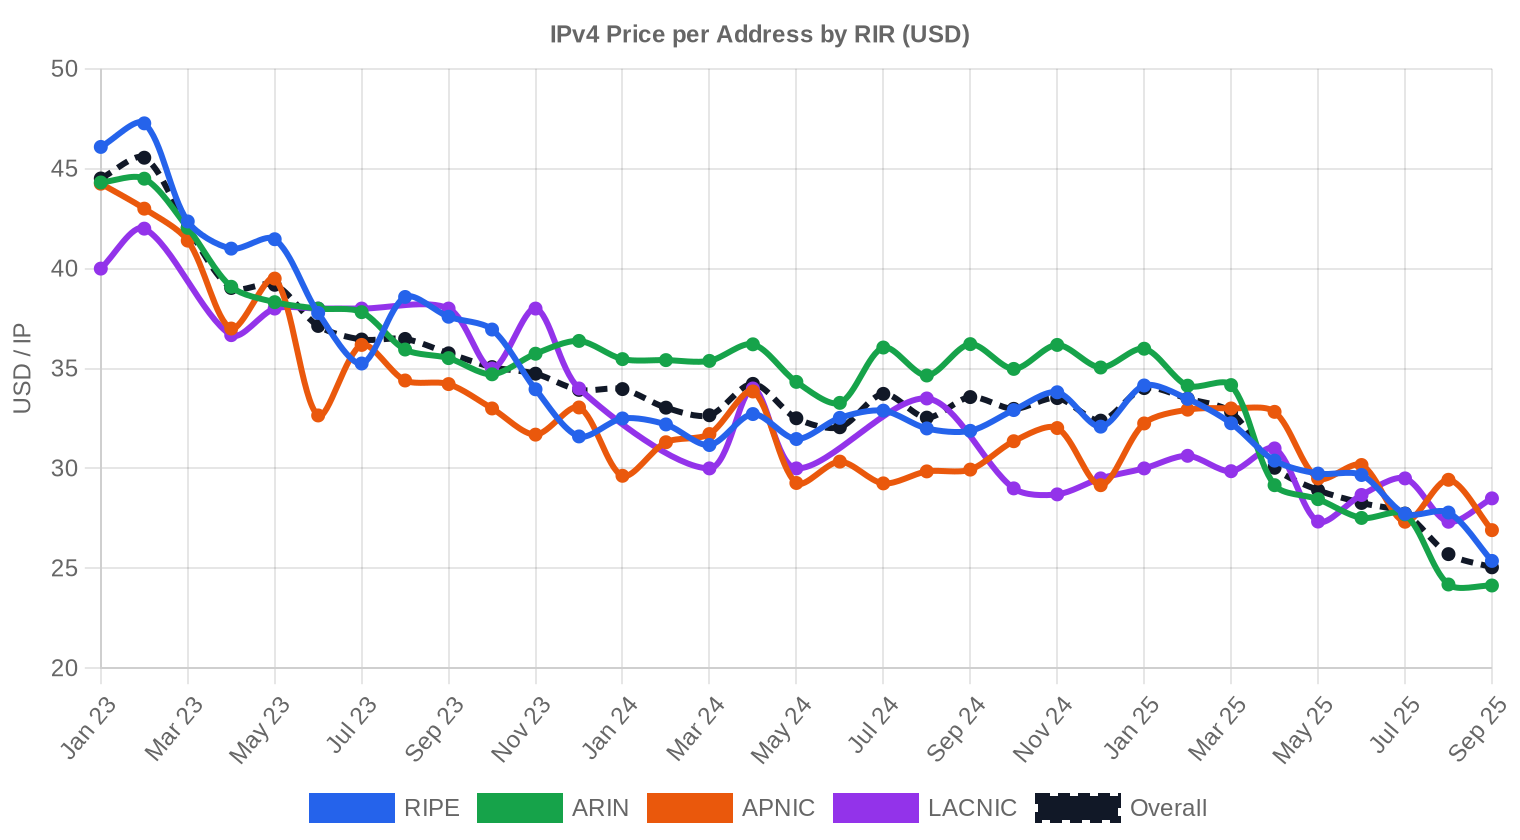
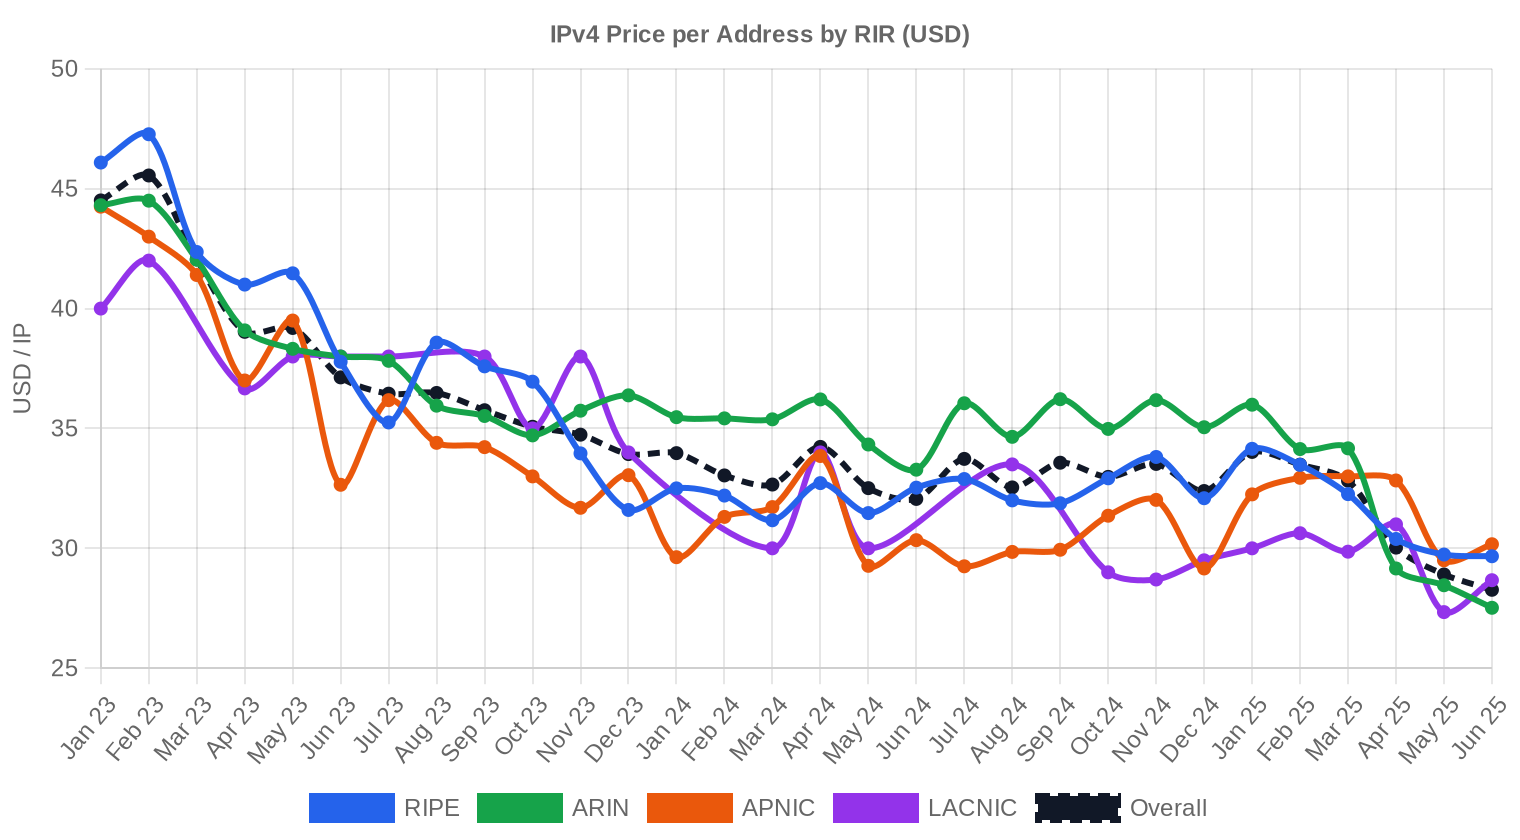
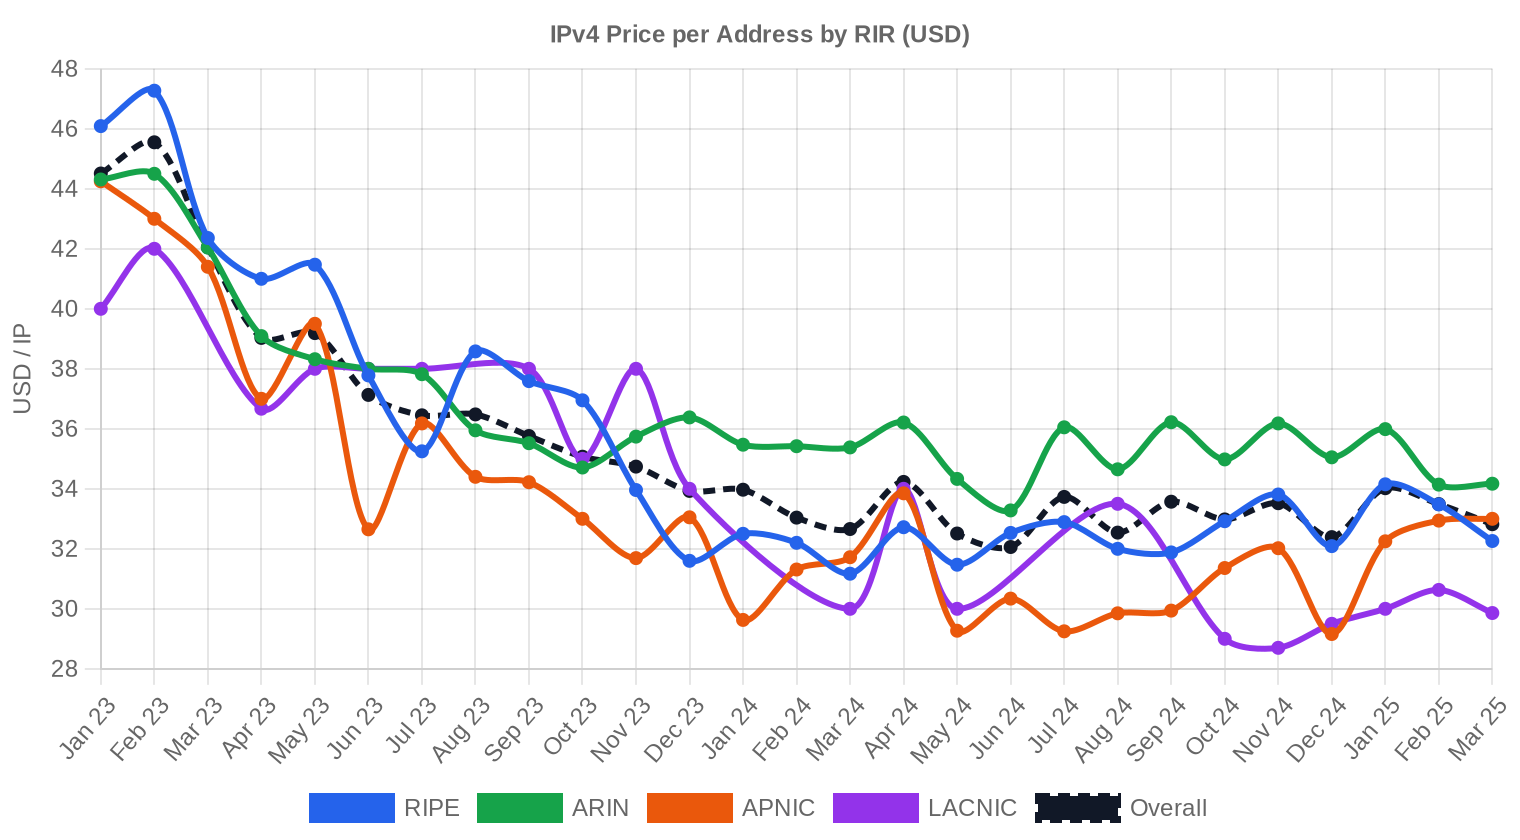
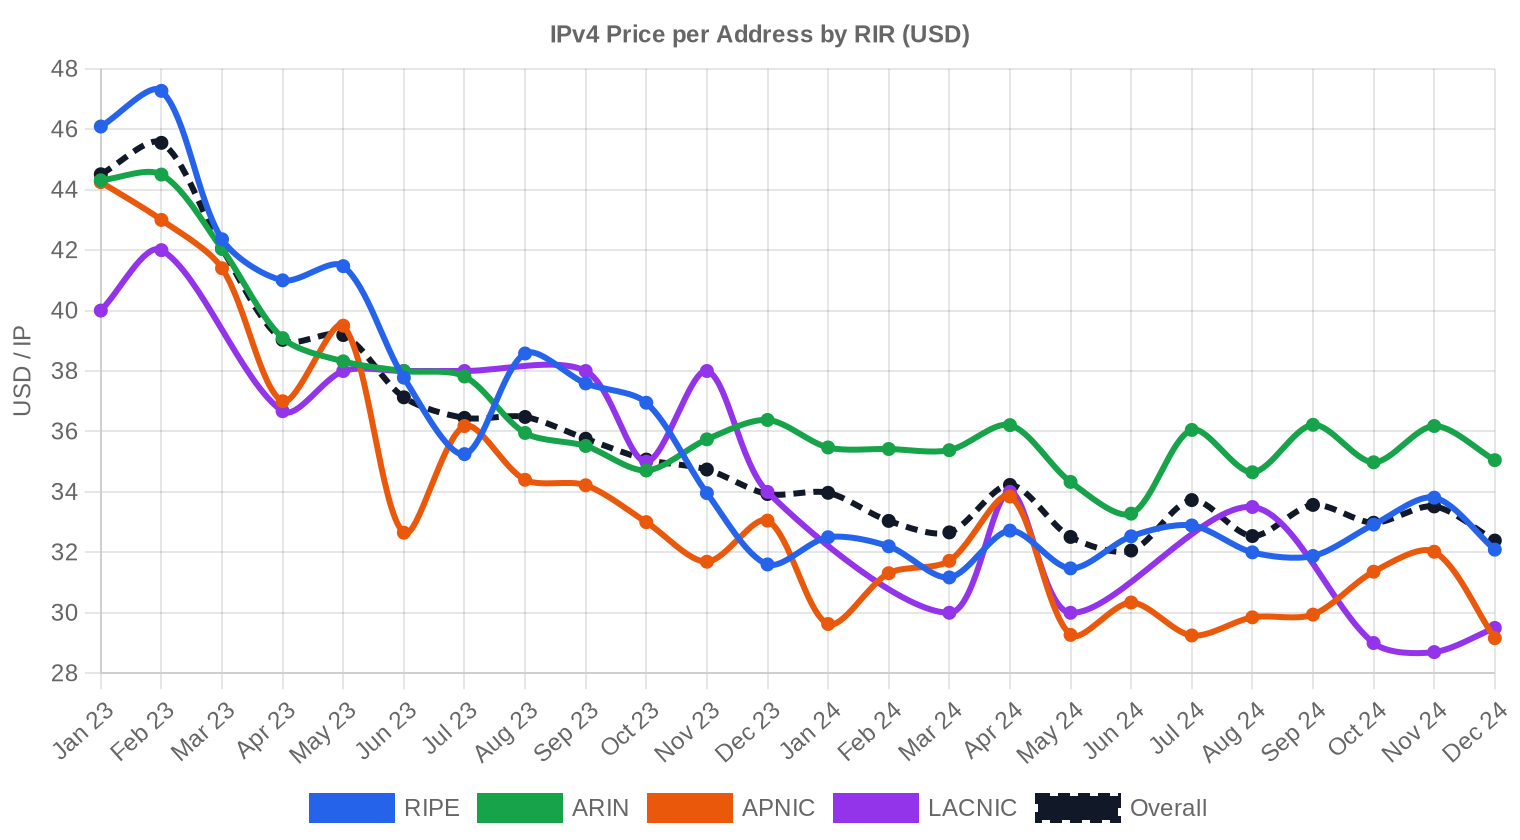
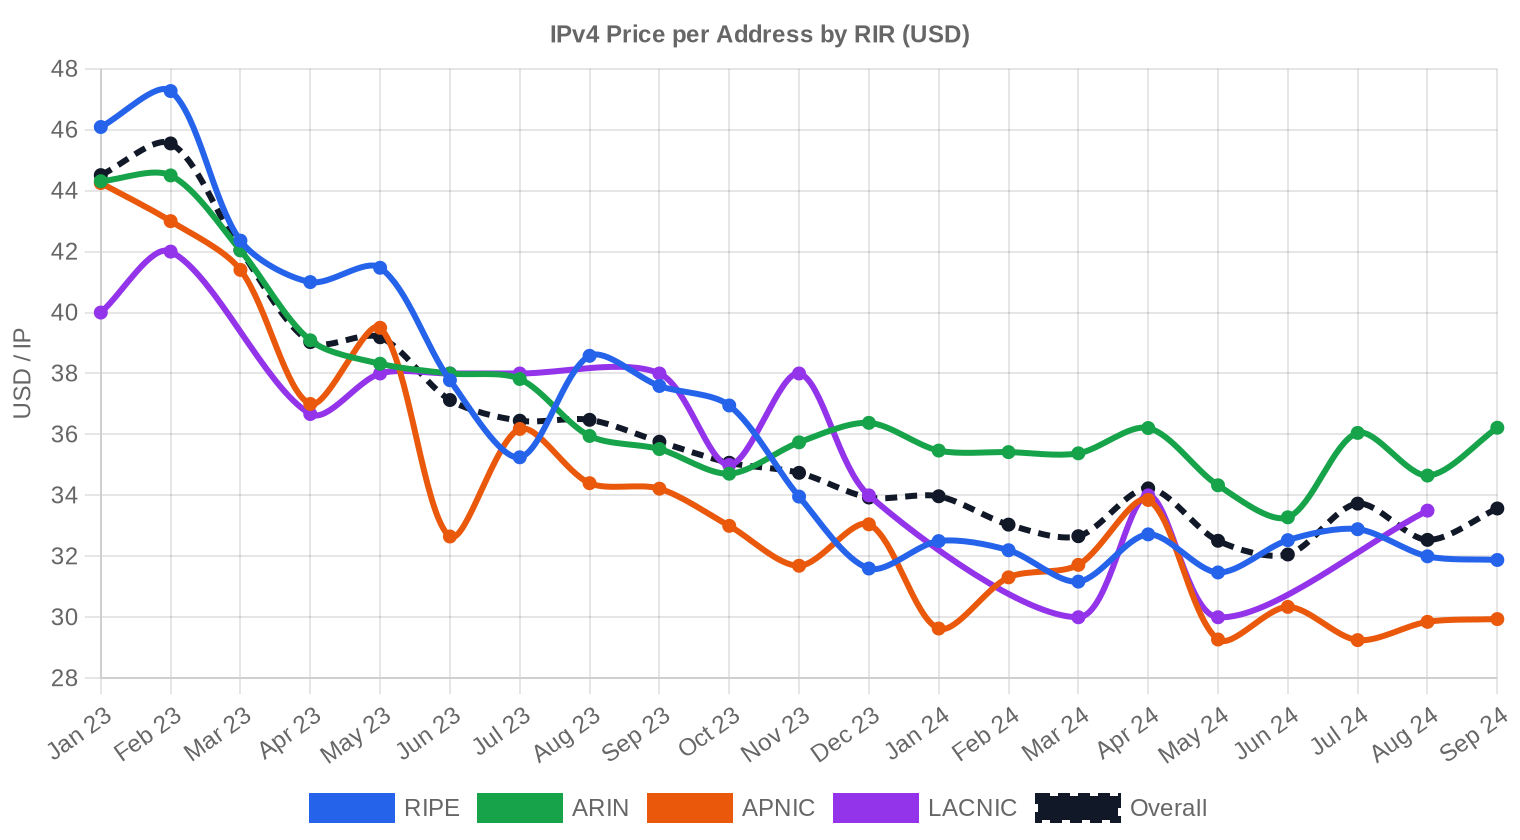
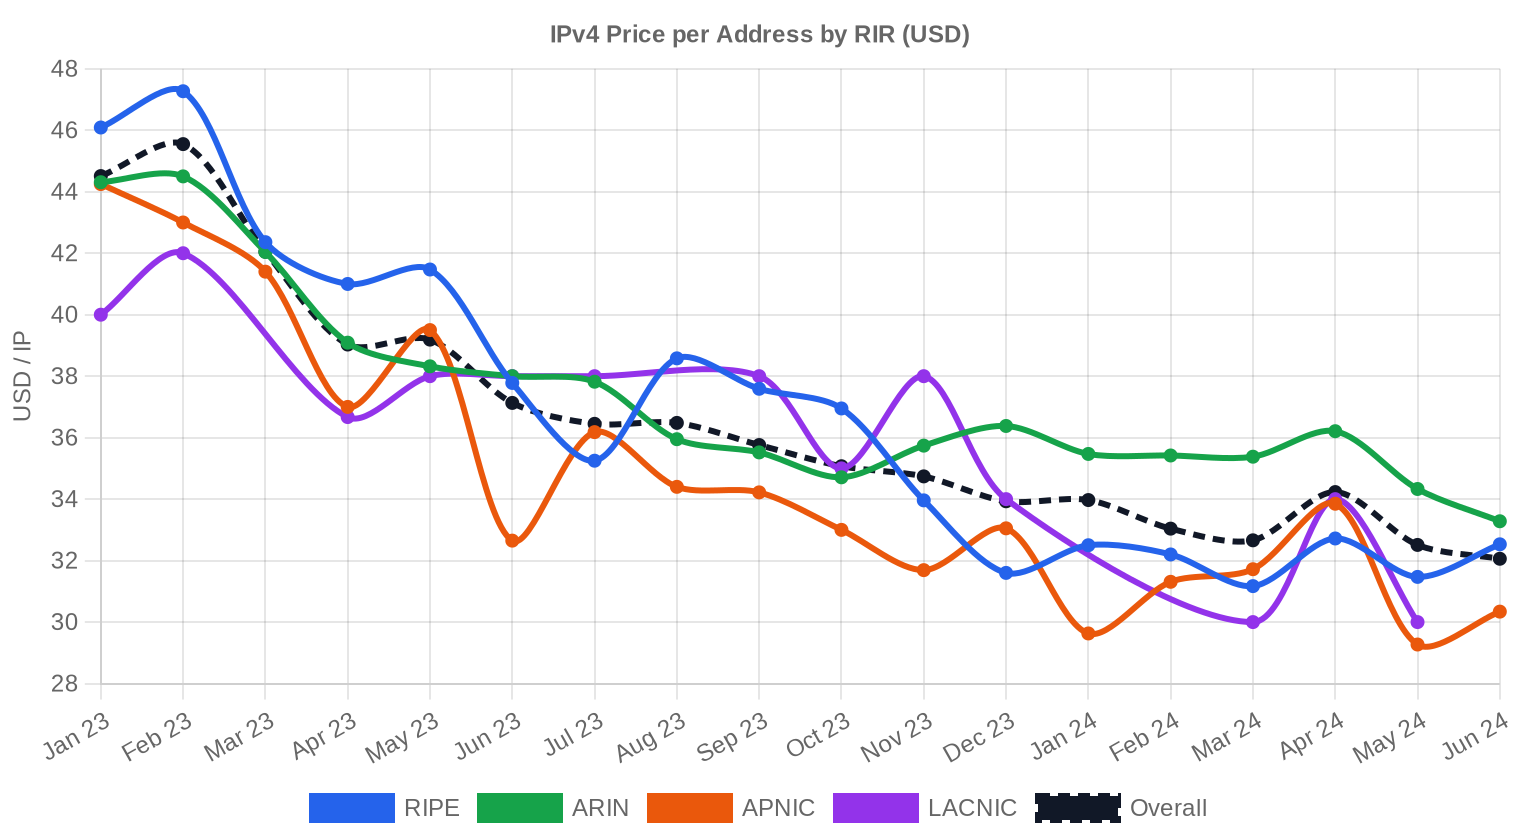
Price Dynamics
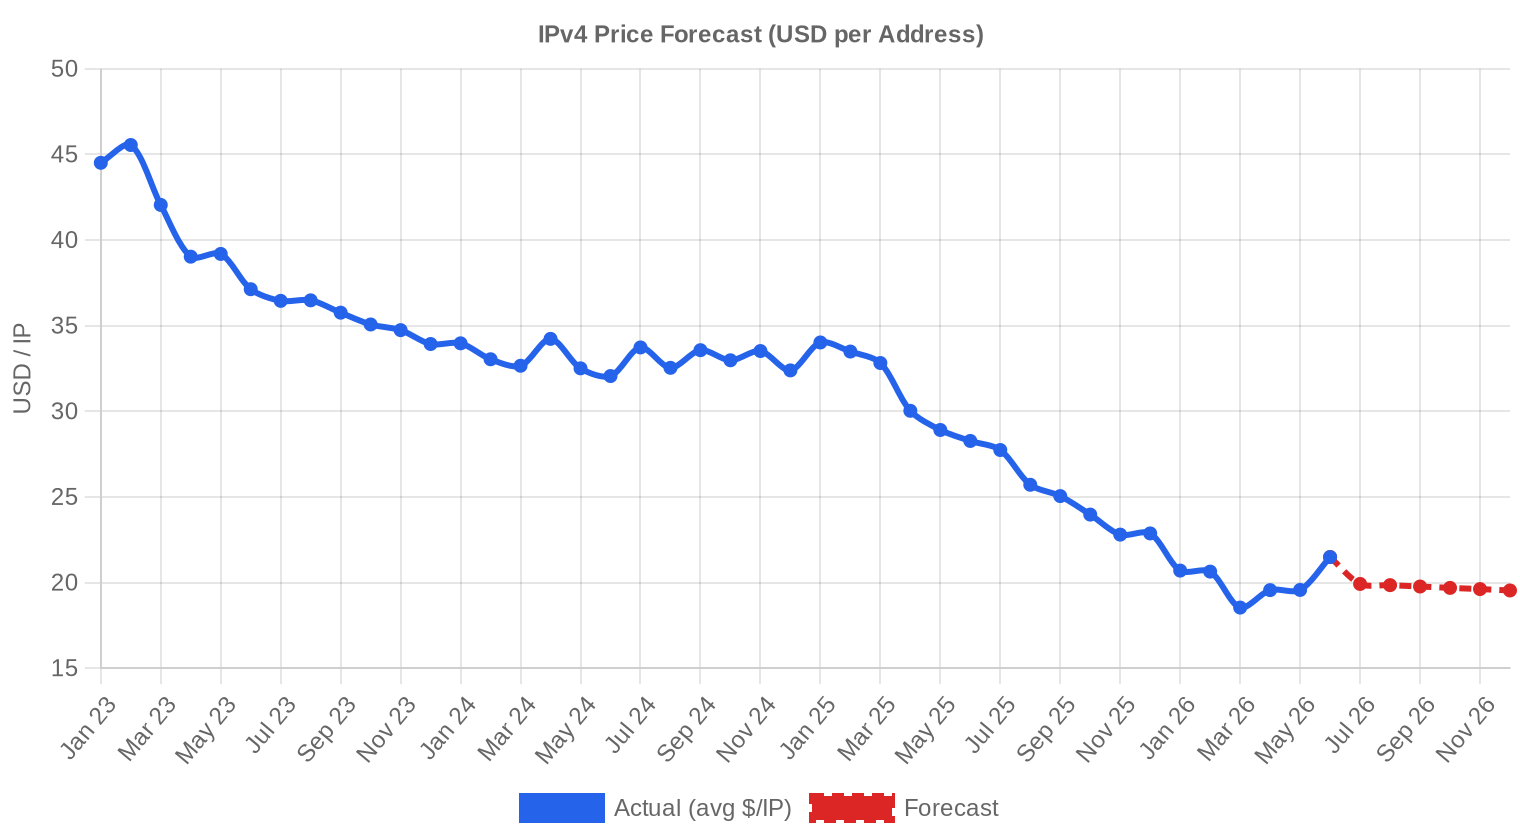
Prices ranged from $8.50 to $41.00 per IP in H1 2026 — a wide $32.50 spread that reflects the divergence between distressed small-block sales and premium clean inventory. The average fell from roughly $24.77 in H2 2025 to $20.04, a decline that accelerated through Q2 as buyer expectations reset. Year-over-year, the drop is even more dramatic: H1 2025 averaged approximately $31.16 per IP, putting the current level 35.7% below that mark. The median at $20.00 sitting just four cents below the average tells us this isn't being dragged down by a handful of fire-sale outliers — the entire distribution has shifted lower. Regression trends point to continued modest softening through year-end, with the model projecting $19.54 by December 2026.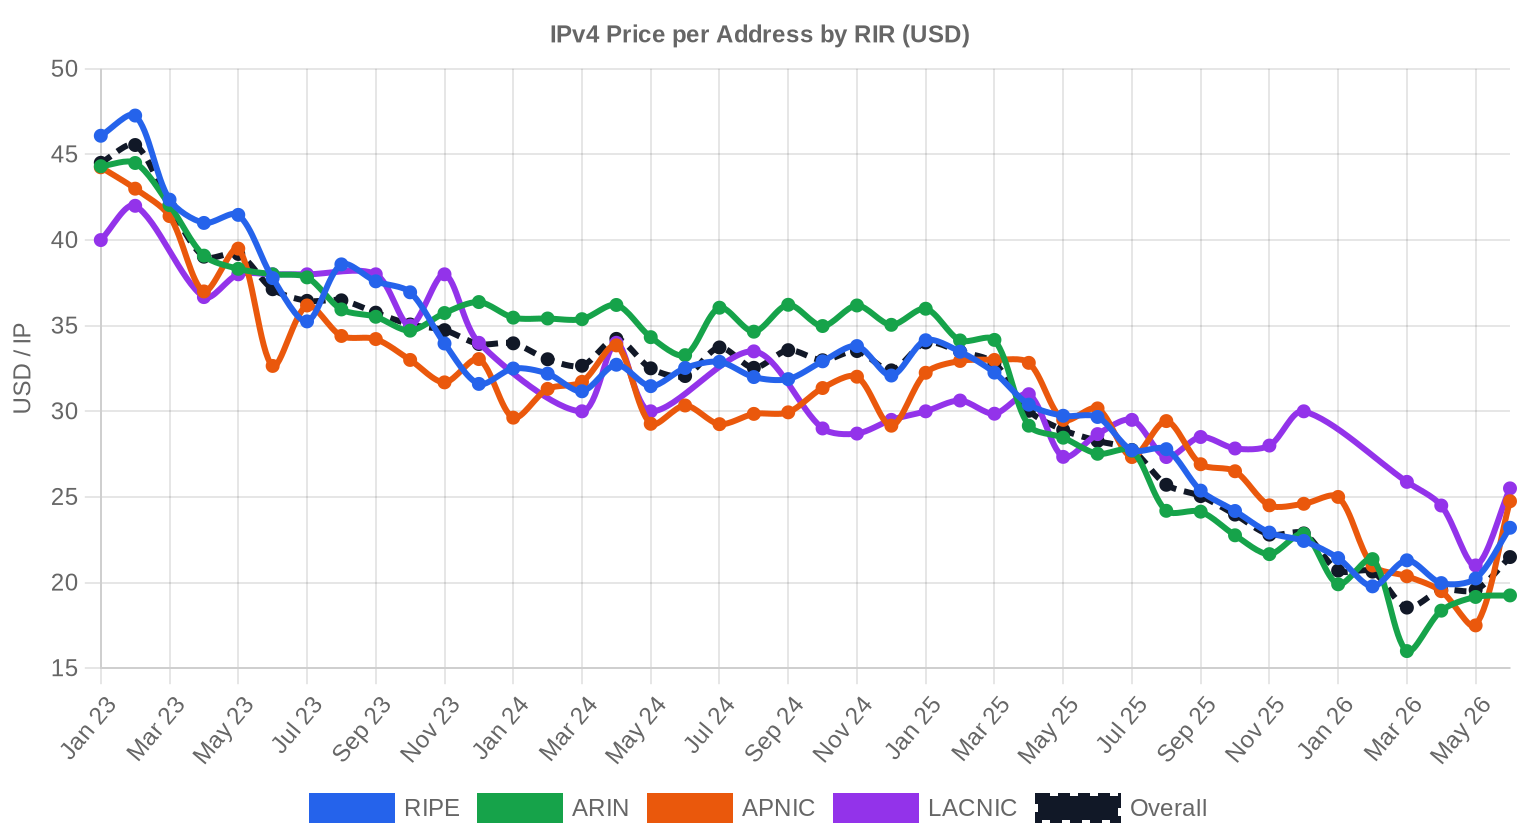
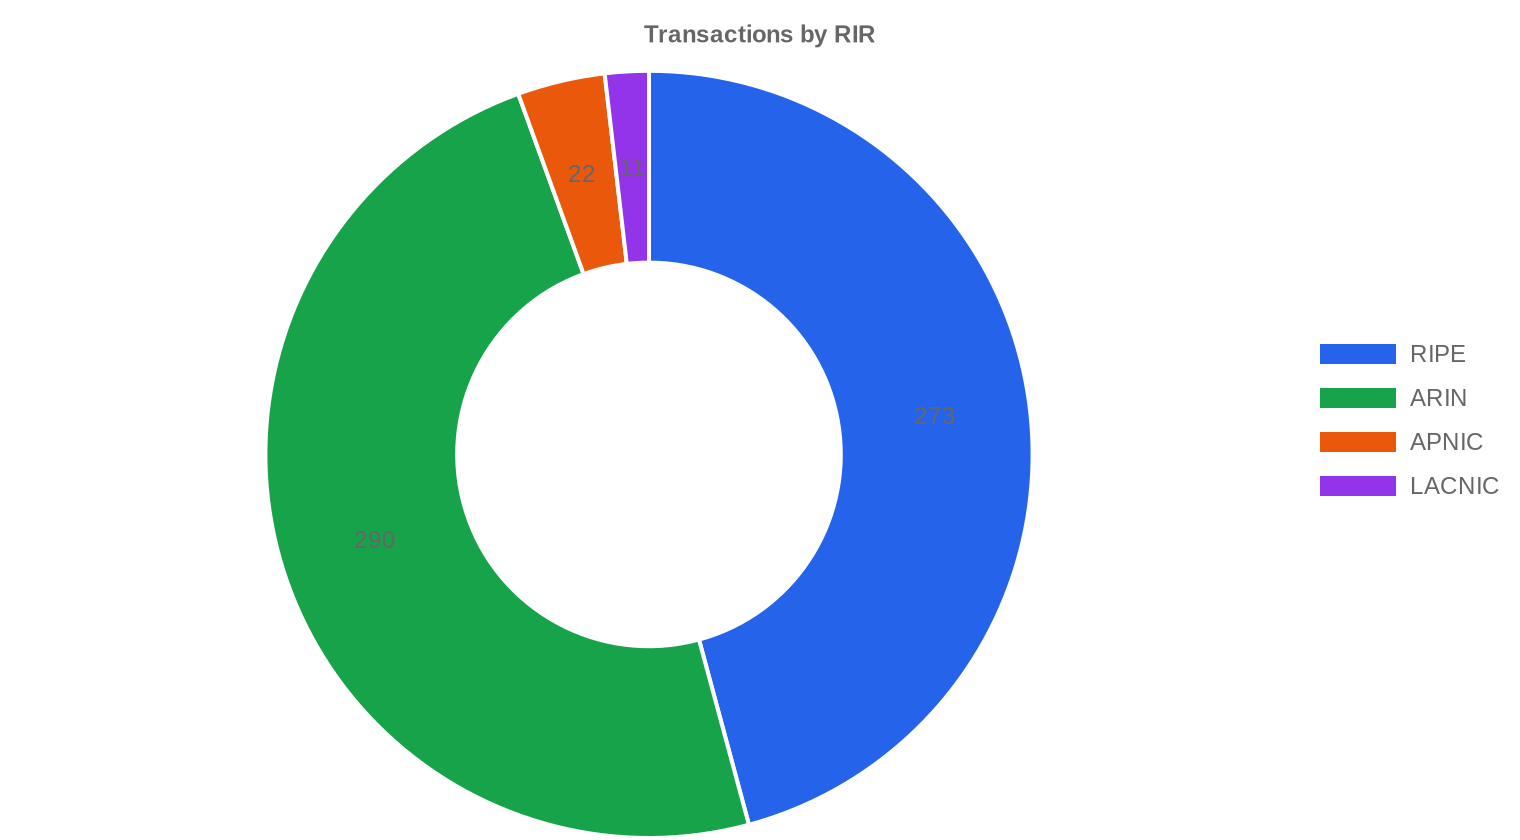
Pricing by RIR
ARIN remains the volume leader and the cheapest major registry. LACNIC commands a significant premium but on thin volume — 11 transactions do not make a liquid market.ARIN: $18.95/IP across 290 transactions (48.7% of volume). Median $18.75, range $8.50–$41.00. The widest spread of any RIR, driven by legacy block liquidations at the low end and clean /16 inventory at the top.
RIPE: $20.95/IP across 273 transactions. Median $21.00, range $9.50–$38.00. RIPE pricing carries a $2.00 premium over ARIN, narrower than the $3–5 gap seen in 2024. The 24-month holding rule continues to constrain rapid flipping and supports floor pricing.
APNIC: $20.69/IP across 22 transactions. Median $21.25, range $14.00–$30.00. Small sample, but pricing tracks closely with RIPE — Asia-Pacific demand remains steady from regional ISPs.
LACNIC: $24.77/IP across 11 transactions. Median $25.50, range $14.00–$30.00. The priciest registry by average, reflecting acute scarcity in the Latin American region and limited seller willingness.
AFRINIC: Zero recorded transactions. The registry's ongoing governance and legal issues continue to freeze transfer activity entirely.
| RIR | Transactions | Avg $/IP | Median $/IP | IPs Traded | RIR Transfers | Next Month (proj.) | Year-End (proj.) |
|---|---|---|---|---|---|---|---|
| RIPE | 273 | $20.95 | $21.00 | 1,762,560 | 2,393 | $23.00 | $23.50 |
| ARIN | 290 | $18.95 | $18.75 | 3,110,144 | 1,579 | $17.50 | $17.00 |
| APNIC | 22 | $20.69 | $21.25 | 124,672 | 0 | $22.00 | $21.00 |
| LACNIC | 11 | $24.77 | $25.50 | 18,688 | 0 | $25.00 | $24.00 |
Transaction Volume
Supply & Block Sizes
/24 blocks dominated deal flow with 182 transactions — roughly 30.5% of all trades. This is the retail unit of the IPv4 market: small ISPs, hosting companies, and enterprises buying exactly what they need for a single network or service deployment. Larger blocks moved in lower volume but captured disproportionate total value, with 35 deals exceeding $1 million accounting for the bulk of aggregate spend.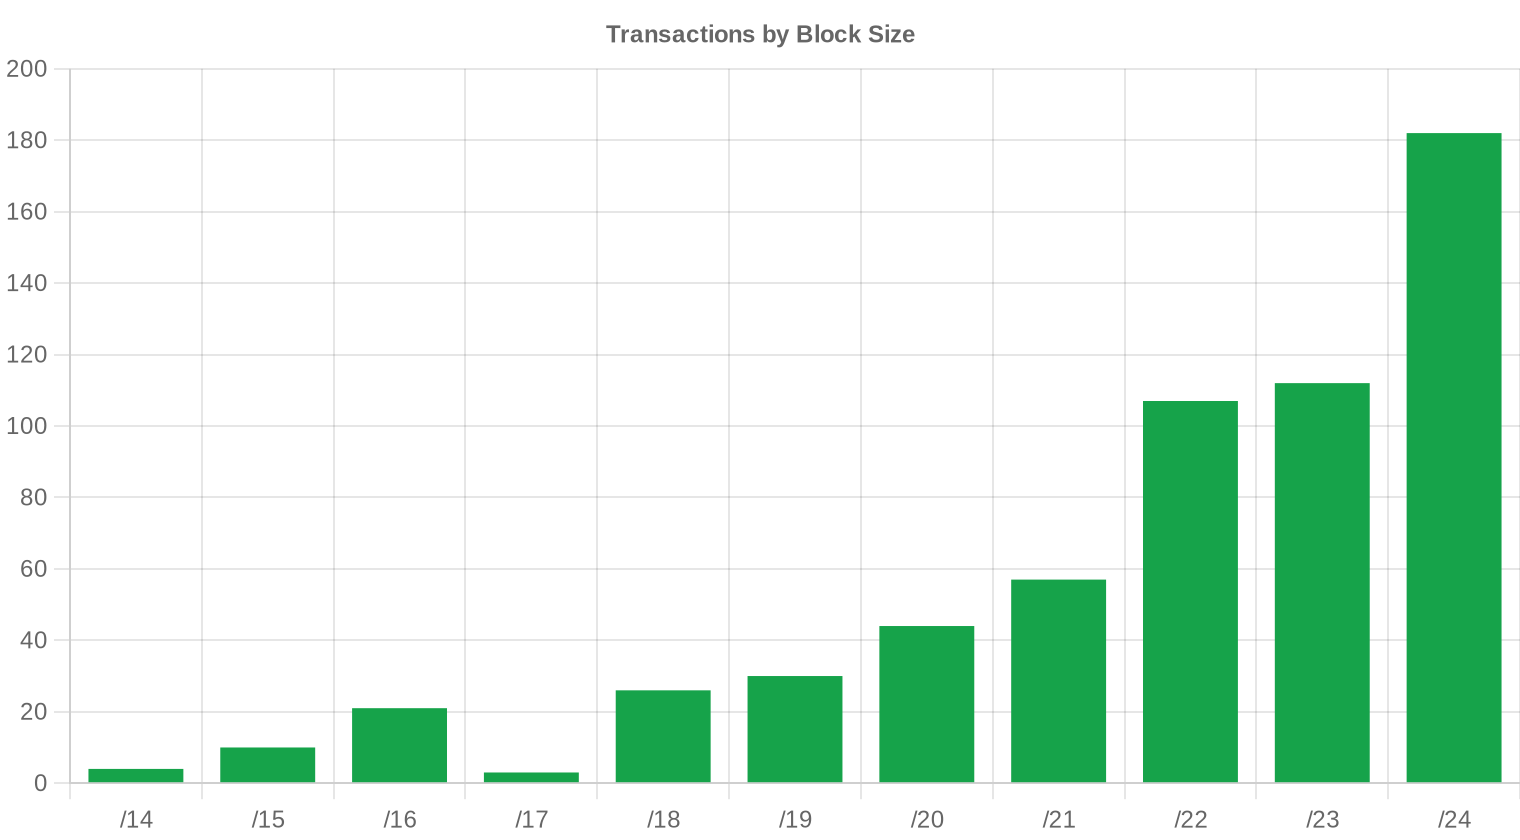
Geographic Activity
The United States led all countries with 237 transactions, followed by the United Kingdom at 92 and Canada at 40. These three markets collectively represented over 60% of deal flow. The Netherlands (25 deals) and a cluster of unnamed/multi-jurisdictional transactions (24) rounded out the top five. European activity was broad-based, with Sweden, Ireland, Germany, and Italy all recording meaningful volume. Ukraine appeared in five standalone transactions plus several cross-border deals, reflecting continued demand from infrastructure providers serving the region.Registry Transfer Activity
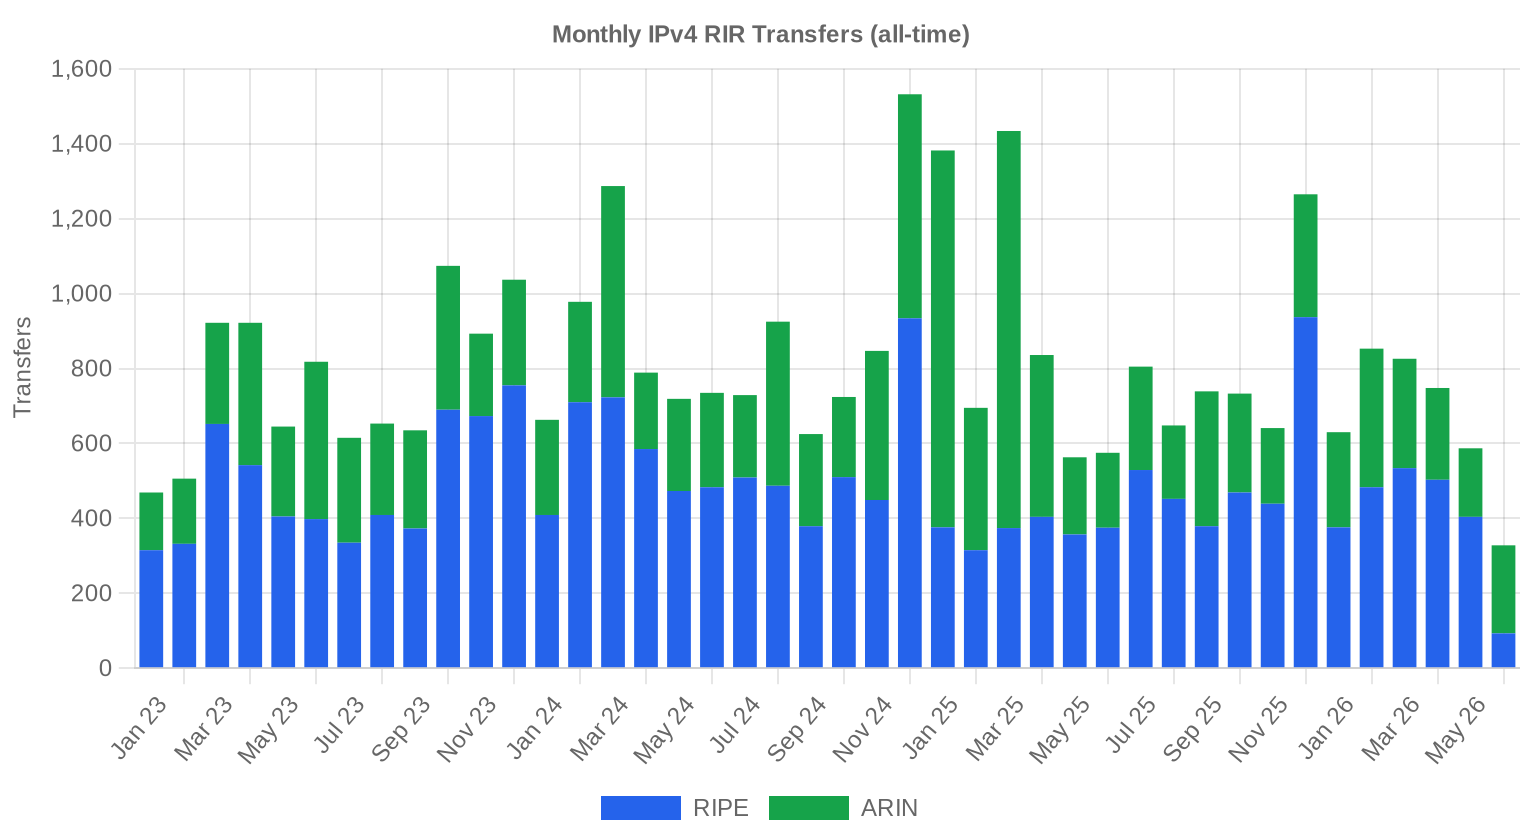
Total official RIR transfer filings reached 3,972 in H1 2026. RIPE led with 2,393 registered transfers — 60.2% of the total — a figure that includes intra-RIR mergers, acquisitions, and internal reallocations that don't always appear as priced market transactions. ARIN recorded 1,579 transfers. APNIC, LACNIC, and AFRINIC registered zero transfer filings in the period, though APNIC clearly had 22 priced deals, suggesting administrative reporting lags or classification differences.Long-Run Transfer Trends
Over the 42-month tracking window, 34,030 total transfers have been recorded across all RIRs. RIPE has accounted for 59.7% of that cumulative volume versus ARIN's 40.3%. Transfer activity peaked in December 2024, which coincided with AWS's introduction of public IPv4 charges and a rush of cloud-adjacent buyers front-running anticipated price increases — a demand spike that has since fully unwound. The current pace, while healthy, sits well below that peak.| RIR | RIR Transfers |
|---|---|
| RIPE | 20,329 |
| ARIN | 13,701 |
| RIR Transfers | 34,030 |
Outlook & Forecast
Forecasting each block-size band and RIR separately with our AI model:
The overall average price per IP is projected to reach $19.54 by December 2026, with a next-month estimate of $20.04 per IP.
- RIPE: projected at $23.00 per IP next month, trending toward $23.50 by December 2026.
- ARIN: projected at $17.50 per IP next month, trending toward $17.00 by December 2026.
- APNIC: projected at $22.00 per IP next month, trending toward $21.00 by December 2026.
- LACNIC: projected at $25.00 per IP next month, trending toward $24.00 by December 2026.
- AFRINIC: insufficient data for a reliable forecast.
Forecast by Block Size
| Block | Current $/IP | Next Month | Year-End | Confidence |
|---|---|---|---|---|
| /24 | $26.00 | $26.00 (0.0%) | $25.50 (-1.9%) | medium |
| /23 | $20.00 | $20.50 (+2.5%) | $20.00 (0.0%) | medium |
| /22 | $17.00 | $17.00 (0.0%) | $16.00 (-5.9%) | medium |
| /21 | $17.70 | $17.50 (-1.1%) | $17.00 (-4.0%) | medium |
| /20 | $15.75 | $15.75 (0.0%) | $15.50 (-1.6%) | medium |
| /19 | $14.25 | $14.50 (+1.8%) | $14.00 (-1.8%) | low |
| /18-/16 | $13.50 | $13.50 (0.0%) | $14.00 (+3.7%) | low |
| /15-up | $10.00 | $10.00 (0.0%) | $10.50 (+5.0%) | low |
Editor's Take: Buy vs. Lease
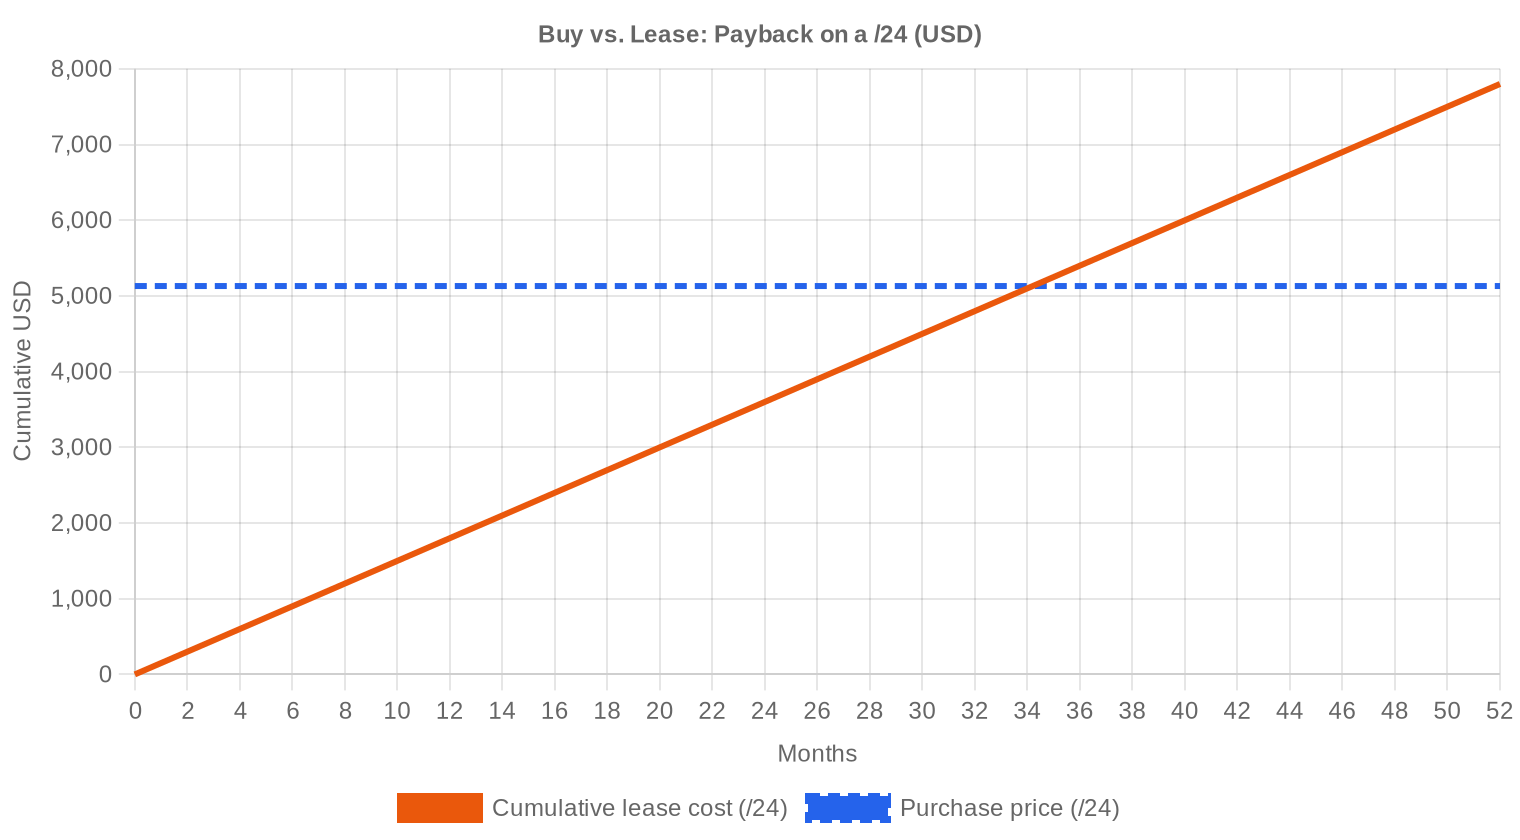
At $20.04 per IP and a lease rate of $0.5859/month, the buy-versus-lease math is straightforward: a purchased block pays for itself in 34.2 months — just under 2.9 years. That translates to an implied annual yield of 35.1% for a block holder leasing out inventory, which is extraordinary by any asset-class standard. For buyers with a time horizon beyond three years, purchasing remains the clear economic choice. Lessees are paying a steep convenience premium that compounds quickly. A /24 block costs $5,130 to buy outright versus $150/month to lease; after 34 months, the lessee has spent more than the purchase price with nothing to show for it. The verdict: buy if you can commit capital for three or more years. Lease only for genuinely short-term or uncertain requirements.| /24 Purchase price | $5,130 |
| /24 Lease price | $150 / mo |
| Payback period | 34.2 mo (2.9 yr) |
| Gross annual yield | 35.1% |
What This Means for You
For Buyers: This is the most favorable buying environment in three years. Prices are 35.7% below where they sat in H1 2025, and the forecast suggests limited further downside. If you've been waiting for a correction, it has arrived. Lock in blocks now — particularly ARIN inventory at $18.95 — before the floor firms up.For Sellers: Holding out for $30+ pricing is no longer realistic in most RIR regions. The market has reset. Sellers sitting on clean, transferable blocks should consider staged liquidation at current levels rather than waiting for a rebound that may not materialize in 2026. LACNIC holders are the exception — regional scarcity still supports mid-$20s pricing.
For Lessees: At $0.5859/month per IP, leasing costs add up fast. Any deployment expected to run beyond 34 months should be evaluated against outright purchase. Run the amortization math on your specific block size before signing a multi-year lease.
For Block Holders: If you own blocks and aren't using them, leasing generates a 35.1% annual yield at current rates. That return dwarfs anything available in fixed income or most equity markets. Leasing is particularly attractive if you believe prices may recover — you retain the asset while generating income.
Browse verified IPv4 blocksSell IPv4 →
List your blocks with managed transferLease IPv4 →
Flexible short-term capacityLease Out IPv4 →
Turn idle blocks into recurring revenue
IPv4 Pricing by Block Size
Small blocks carry a steep per-IP premium. /24 transactions — the most liquid segment with 182 deals — typically price 20–40% above the market average on a per-IP basis due to the fixed overhead of transfer processing, due diligence, and escrow. Larger blocks (/16 and above) clear at discounts to the average, sometimes in the $14–17 range per IP, reflecting the limited buyer pool capable of deploying 65,536+ addresses. The sweet spot for cost-efficient acquisition sits in the /20 to /18 range, where per-IP pricing converges closest to the market average without requiring massive capital outlay.| Block | IPs | Buy: /IP | Buy: Total | Lease: /IP/mo | Lease: Monthly |
|---|---|---|---|---|---|
| /24 | 256 | $35–45 | $8,960–11,520 | $0.38–0.50 | $97–128 |
| /22 | 1,024 | $28–38 | $28,672–38,912 | $0.33–0.45 | $338–461 |
| /20 | 4,096 | $22–32 | $90,112–131,072 | $0.30–0.40 | $1,229–1,638 |
| /18 | 16,384 | $20–30 | $327,680–491,520 | $0.30–0.38 | $4,915–6,226 |
| /16 | 65,536 | $18–28 | $1,179,648–1,835,008 | $0.30–0.35 | $19,661–22,938 |
IPv4 Price History: 2011–2026
IPv4 addresses had no meaningful market value prior to IANA free pool exhaustion in February 2011. Prices rose steadily from $5–7/IP in 2014–2015 to $20–25 by 2019, then accelerated sharply through the pandemic-driven digital buildout, peaking near $50–55/IP in late 2023 and early 2024. The AWS decision to charge $3.60/year per public IPv4 address, effective February 2024, triggered a demand surge followed by a hangover — prices began declining in mid-2024 and have now corrected 35.7% from H1 2025 levels. At $20.04, the market has essentially round-tripped to early 2019 pricing, raising the question of whether this represents fair value or an overshoot.| Year | ~Price/IP | Key Event |
|---|---|---|
| 2011 | $7–12 | IANA free pool exhausted; Microsoft/Nortel deal ($11.25/IP) |
| 2012 | $8–12 | RIPE NCC reaches last /8; begins /22-only allocation |
| 2014 | $10–15 | LACNIC free pool exhausted |
| 2015 | $8–15 | ARIN free pool exhausted |
| 2017–18 | $12–18 | Leasing market grows; cloud demand rises |
| 2019 | $18–24 | RIPE NCC exhausts remaining free pool |
| 2021–22 | $50–60+ | Post-pandemic peak; hyperscaler build-outs |
| 2024 | $35–52 | AWS IPv4 charge ($0.005/IP/hr); large block correction |
| 2025–26 | $18–45 | Market bifurcation; /16s below $20 for first time since 2019 |
Market Structure: Who Is Buying & Selling
Buyers are now a mix of mid-tier cloud and hosting providers, regional ISPs expanding fixed-wireless and fiber footprints, and enterprise IT teams deploying on-premises infrastructure. The hyperscaler-driven demand wave of 2023–2024 has receded. On the sell side, legacy corporate holders who received allocations in the 1990s and early 2000s continue to monetize unused space, joined by bankruptcy trustees and restructuring advisors liquidating assets from failed ventures.IPv4 vs. Other Asset Classes
At a 35.1% implied annual yield from leasing, IPv4 blocks blow away conventional asset classes. Ten-year U.S. Treasuries sit around 4.2%. Commercial real estate cap rates in major markets run 5–7%. Even high-yield equities rarely exceed 8–10% dividend yields. The comparison isn't perfect — IPv4 blocks carry illiquidity risk, counterparty risk on leases, and long-term obsolescence risk from IPv6 — but on a pure cash-flow basis, few assets generate this kind of return on a sub-$6,000 entry point per /24.| Asset Class | Typical Yield | Liquidity | Primary Risk |
|---|---|---|---|
| IPv4 | 35.1% | Moderate | IPv6 adoption, block quality |
| Commercial Real Estate | 5–8% | Low | Vacancy, rate cycle |
| Investment-Grade Bonds | 4–5% | High | Duration, credit risk |
| S&P 500 | ~1,3% | High | Market volatility |
| Money Market / T-Bills | ~4–5% | High | Rate cycle changes |
IPv6 Adoption & Why IPv4 Remains Essential
IPv6 adoption continues its glacial advance. Google reports roughly 45% of its traffic arriving via IPv6, but enterprise internal networks, legacy applications, and vast swaths of the hosting industry remain IPv4-dependent. The practical reality is dual-stack coexistence for at least another decade, which means IPv4 addresses will retain functional and economic value well into the 2030s. Any thesis built on imminent IPv4 obsolescence has been wrong for fifteen years running.AI & Cloud Infrastructure Demand
AI infrastructure buildout remains a significant demand driver for IPv4 space, though its direct impact is often obscured by the hyperscaler intermediaries doing the actual purchasing. Training clusters and inference farms require public-facing IP addresses for API endpoints, model serving, and data ingestion pipelines. The wave of AI startups spinning up GPU cloud platforms has created a steady stream of /24 and /23 buyers who need addresses quickly and are less price-sensitive than traditional hosting operators — a dynamic that has helped support floor pricing even as broader averages decline.What Determines IPv4 Block Value
Not all IPv4 blocks are created equal. Clean blocks with no blacklist history, no prior association with spam or abuse, and a long allocation history from a major RIR command premiums of 10–25% over comparable dirty inventory. RIR transferability matters enormously — ARIN and RIPE blocks trade freely, while AFRINIC blocks are essentially frozen. Age of allocation, WHOIS cleanliness, and whether the block has been previously transferred also factor into pricing; first-transfer blocks from original legacy holders consistently clear above market averages.Sell vs. Lease: A Decision Framework
In a declining price environment, leasing is the smarter play for holders who believe the correction is temporary — you generate 35.1% annual yield while retaining optionality on a price recovery. Selling makes sense if you need immediate liquidity, if you hold blocks in an RIR with regulatory risk (AFRINIC), or if your blocks have cleanliness issues that will only compound over time. At current prices, a seller netting $20/IP today may look back in 18 months and wish they'd leased — or they may look back and be glad they exited before further erosion.| /24 Purchase price | $5,130 |
| /24 Lease price | $150 / mo |
| Payback period | 34.2 mo (2.9 yr) |
| Gross annual yield | 35.1% |
RIPE NCC 24-Month Transfer Restriction
RIPE NCC's 24-month holding requirement before a block can be re-transferred acts as a structural brake on speculative flipping. It reduces effective supply in the short term, which is one reason RIPE pricing consistently runs $2.00+ above ARIN. For buyers, this rule means committing to a longer hold period before the block becomes liquid again — a consideration that should factor into any acquisition strategy. The rule also creates a mild calendar effect: blocks acquired during the 2024 price peak are just now becoming eligible for re-transfer, potentially adding sell-side supply in H2 2026.Deal Size Distribution
The market is heavily skewed toward small transactions: 458 deals (76.8% of total) came in under $50,000, but they represented just $6.6 million in aggregate value — 11.3% of the total. At the other end, 35 deals exceeding $1 million each accounted for $74.9 million — a figure that exceeds the period's reported total value, likely reflecting some multi-tranche settlements or deals spanning the period boundary. Average deal size fell to ~98,089 IPs from ~103,657 in H2 2025 and ~118,333 in H1 2025, consistent with the shift toward retail-sized block purchases as institutional buyers pull back.Top Trading Countries
The U.S. dominated with 237 transactions — 39.8% of all deals — driven by hosting providers, ISPs, and enterprise buyers across a deep and liquid market. The U.K.'s 92 transactions reflect London's role as a European connectivity hub and the concentration of data center operators in the region. Canada's 40 deals are disproportionately large relative to its economy, suggesting active ISP consolidation and BEAD-adjacent broadband buildout activity spilling across the border in planning and procurement.BEAD Broadband Program Impact
The $42.45 billion BEAD program is beginning to generate real IPv4 demand as state-level subgrantees finalize network designs and procurement. Many of these rural broadband providers need /20 to /18 blocks — the exact mid-range inventory that trades closest to market average pricing. As BEAD-funded deployments accelerate through 2026 and 2027, this programmatic demand could absorb significant ARIN supply and arrest the price decline in that RIR. Smart sellers should be positioning clean ARIN blocks for this buyer cohort now.Hyperscaler IPv4 Holdings
Amazon, Microsoft, and Google collectively hold tens of millions of IPv4 addresses — among the largest pools outside of the RIRs themselves. Amazon's 2024 decision to charge for public IPv4 triggered a massive release of unused addresses by AWS customers, which added sell-side pressure through 2025 and into 2026. Any decision by a hyperscaler to liquidate or lease portions of their internal holdings would have a material impact on pricing, but so far these companies have shown no inclination to sell. Their strategic calculus treats IPv4 as infrastructure insurance, not a tradeable asset.Macroeconomic Conditions & Market Impact
Higher-for-longer interest rates continue to weigh on IT capital expenditure budgets, particularly for mid-market enterprises and regional ISPs that finance infrastructure purchases. The cost of capital matters when deciding between a $50,000 block purchase and a $150/month lease. That said, the sharp price decline in IPv4 has paradoxically made outright purchases more accessible — a /24 at $5,130 is a rounding error on most enterprise IT budgets. Broader economic conditions remain mixed, with U.S. GDP growth steady but European and Asian demand more subdued.Model Update & Calibration
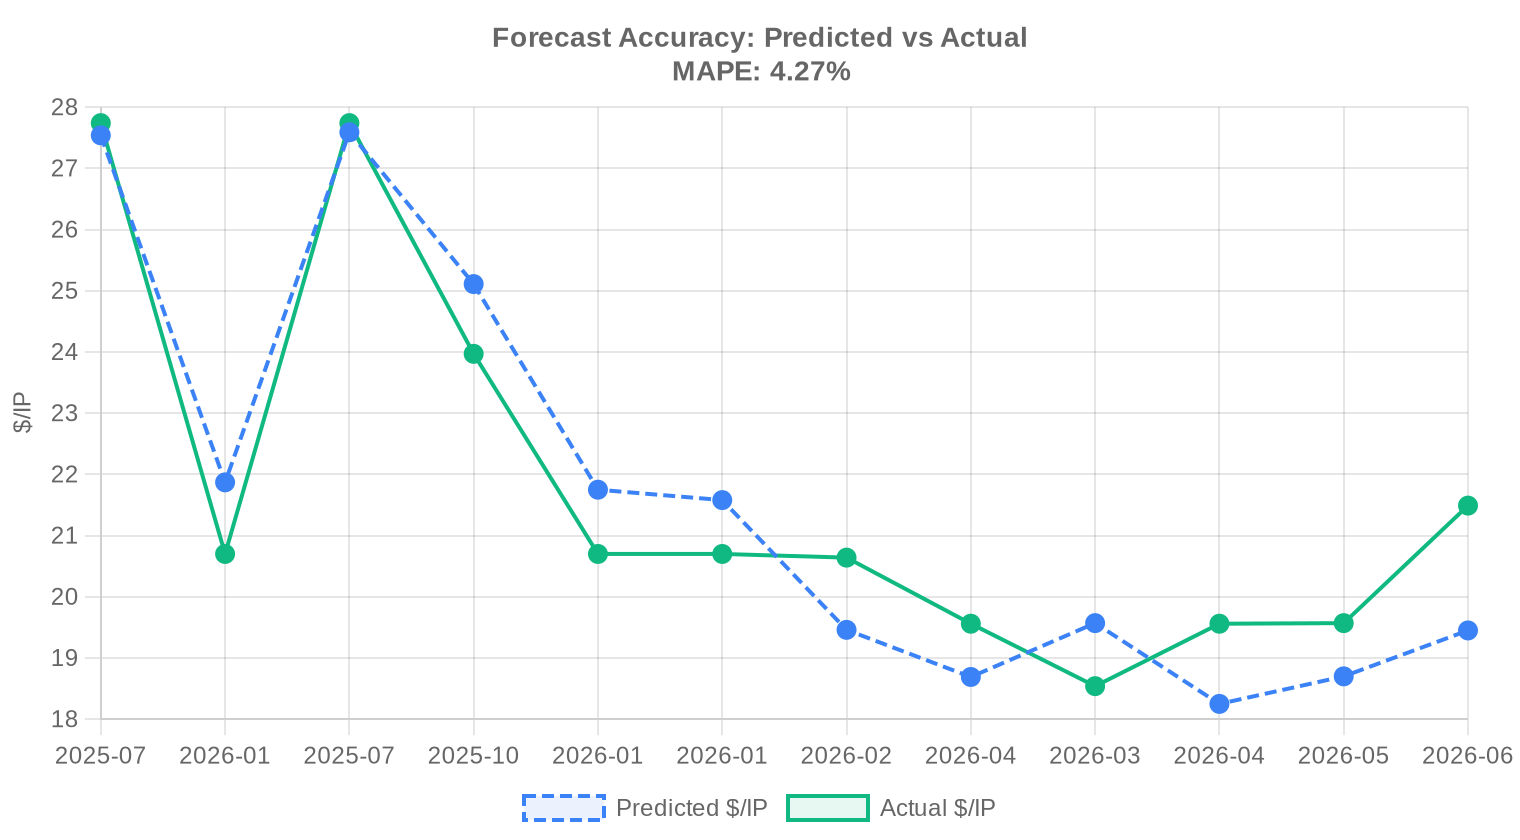
We reviewed our past projections against actual market outcomes and recalibrated the model for this report. The updated model places more weight on recent price movements using exponential decay, dynamically adjusts prediction bands to reflect current market conditions, and corrects for any systematic bias detected in earlier forecasts. The predicted-vs-actual comparison chart below shows how closely our past estimates tracked reality.
| Report Period | Target Month | Predicted | Actual | Deviation |
|---|---|---|---|---|
| 2026-01 | 2026-02 | $19 | $21 | -6% |
| 2026-Q1 | 2026-04 | $19 | $20 | -4% |
| 2026-02 | 2026-03 | $20 | $19 | +6% |
| 2026-03 | 2026-04 | $18 | $20 | -7% |
| 2026-04 | 2026-05 | $19 | $20 | -4% |
| 2026-05 | 2026-06 | $19 | $21 | -9% |
Methodology
Figures are based on completed IPv4Center marketplace transactions and RIR transfer statistics. Prices are in US dollars per IP address. Forecasts are produced by an AI model that analyses each block-size band and RIR segment separately (with outlier-trimmed medians) alongside known market catalysts; they are estimates, not guarantees.
Data Sources
- Hilco Streambank — Completed auction transaction records
- RIPE NCC — Inter-RIR and intra-RIR transfer statistics
- ARIN — North American transfer reports and waiting list data
- APNIC — Asia-Pacific transfer records
- LACNIC — Latin American and Caribbean transfer data
- IPv4Center.com — Proprietary marketplace transaction and lease pricing data
This report is generated automatically for informational purposes only and does not constitute financial advice.
Frequently Asked Questions
What was the average IPv4 price in H1 2026?
The average price was $20.04 per IP address across 596 transactions covering just over 5 million addresses.
How much did IPv4 prices drop compared to H1 2025?
Prices fell 35.7% year-over-year, from approximately $31.16/IP in H1 2025 to $20.04/IP in H1 2026.
How much did IPv4 prices drop compared to H2 2025?
Prices declined 19.1% from the prior half-year period, marking the steepest semi-annual decline recorded.
What is the cheapest RIR for IPv4 purchases in H1 2026?
ARIN was the cheapest at $18.95/IP average across 290 transactions, with a low of $8.50/IP for some blocks.
Which RIR has the highest IPv4 prices?
LACNIC averaged $24.77/IP, though this is based on only 11 transactions. Regional scarcity in Latin America drives the premium.
How much does a /24 IPv4 block cost?
At the current market average of $20.04/IP, a /24 block (256 addresses) costs approximately $5,130. Actual /24 pricing often runs higher due to small-block premiums.
What is the most commonly traded IPv4 block size?
The /24 was the most traded prefix size with 182 transactions, representing about 30.5% of all deals in H1 2026.
Is it better to buy or lease IPv4 addresses in 2026?
Buying is more economical for deployments lasting longer than 34 months. At $20.04/IP purchase price versus $0.5859/month lease rate, a purchased block pays for itself in about 2.9 years.
What is the current IPv4 lease rate?
The monthly lease rate averages $0.5859 per IP, or approximately $150/month for a /24 block, based on a 50-deal sample.
What is the annual yield from leasing IPv4 addresses?
At current lease rates and purchase prices, the implied annual yield is 35.1% — substantially higher than most traditional asset classes.
Where will IPv4 prices be at the end of 2026?
The pricing model forecasts $19.54/IP by December 2026, implying approximately 2.5% additional softening from current levels.
Which countries are most active in IPv4 trading?
The United States leads with 237 transactions, followed by the United Kingdom (92) and Canada (40). These three countries account for over 60% of all deals.
How long does an IPv4 transfer take?
Transfer timelines vary by RIR. ARIN transfers typically complete in 2–4 weeks. RIPE transfers can take 2–6 weeks, and the 24-month holding rule means you cannot re-transfer a RIPE block for two years after acquisition.
What is RIPE's 24-month holding rule?
RIPE NCC requires that any transferred block be held for at least 24 months before it can be transferred again. This limits speculative flipping and supports floor pricing in the RIPE region.
How does the BEAD program affect IPv4 demand?
The $42.45 billion BEAD broadband program is generating new IPv4 demand as rural ISP subgrantees need mid-size blocks (/20 to /18) for network deployments. This could tighten ARIN supply through 2026–2027.
Are IPv4 addresses a good investment?
At a 35.1% implied annual yield from leasing and a purchase price that has corrected 35.7% from 2025 highs, the risk-reward profile is favorable for buyers with a 3+ year horizon. The main risk is long-term IPv6 displacement, which remains slow.
Why are ARIN blocks cheaper than RIPE blocks?
ARIN blocks averaged $18.95/IP versus RIPE's $20.95/IP. The gap reflects RIPE's 24-month holding rule constraining supply and generally higher demand density in the European market.
What mistakes should be avoided when buying IPv4 addresses?
The most common mistakes are skipping blacklist and reputation checks, failing to use escrow, not verifying the seller's authorization to transfer, and buying from an RIR with governance issues (like AFRINIC). Any of these can result in unusable blocks or outright financial loss.
What are the risks of skipping blacklist verification?
Blocks with spam, abuse, or botnet history may be listed on major blacklists (Spamhaus, CBL, etc.), rendering them unusable for email, hosting, or any service requiring clean IP reputation. Cleaning a dirty block can take months and isn't always successful.
Why shouldn't you skip escrow on an IPv4 transaction?
IPv4 transfers are irreversible once processed by the RIR. Without escrow, a buyer risks paying for a block that the seller never transfers, or a seller risks transferring a block without receiving payment. Escrow protects both parties.
What happens if I buy a block that turns out to be hijacked?
You may lose both the block and your money. Always verify the seller's legal authority over the block through RIR records and independent due diligence before committing funds.
Can I transfer an AFRINIC block?
Effectively, no. AFRINIC recorded zero transactions and zero transfer filings in H1 2026. Ongoing governance and legal disputes have frozen transfer activity in that region.
How many total IPv4 transfers occurred in H1 2026?
There were 3,972 official RIR transfer filings, with RIPE accounting for 2,393 (60.2%) and ARIN recording 1,579.
What drives the price difference between small and large IPv4 blocks?
Small blocks (/24) carry a 20–40% per-IP premium due to fixed transaction costs, due diligence overhead, and higher demand from small buyers. Large blocks (/16+) trade at discounts because fewer buyers can deploy 65,000+ addresses.
Will IPv6 make IPv4 addresses worthless?
Not in the foreseeable future. IPv6 adoption has been underway for over a decade and IPv4 remains essential for the vast majority of enterprise networks, legacy applications, and hosting infrastructure. Dual-stack coexistence will persist well into the 2030s.
How is AI infrastructure affecting IPv4 demand?
AI training clusters and inference platforms need public IPv4 addresses for API endpoints, model serving, and data pipelines. AI startups spinning up GPU cloud platforms have created steady /24 and /23 demand, often at lower price sensitivity than traditional buyers.
What was the total value of IPv4 transactions in H1 2026?
The 596 recorded transactions generated $58.5 million in total market value across 5,016,064 IP addresses.
How does the average deal size in H1 2026 compare to prior periods?
Average deal size fell to approximately 98,089 IPs from 103,657 in H2 2025 and 118,333 in H1 2025, reflecting a shift toward smaller, retail-sized transactions.
What is the IPv4 price range observed in H1 2026?
Prices ranged from $8.50/IP at the low end to $41.00/IP at the high end, a $32.50 spread reflecting differences in block size, cleanliness, RIR, and urgency.
Should IPv4 holders sell or lease their blocks right now?
In a declining price environment, leasing at 35.1% annual yield preserves asset optionality while generating strong income. Selling makes sense for holders needing immediate liquidity or concerned about further price erosion.