16 min read
This report analyzes the IPv4 transfer market for January 2026, based on completed IPv4Center marketplace transactions and official RIR transfer records.
Executive Summary
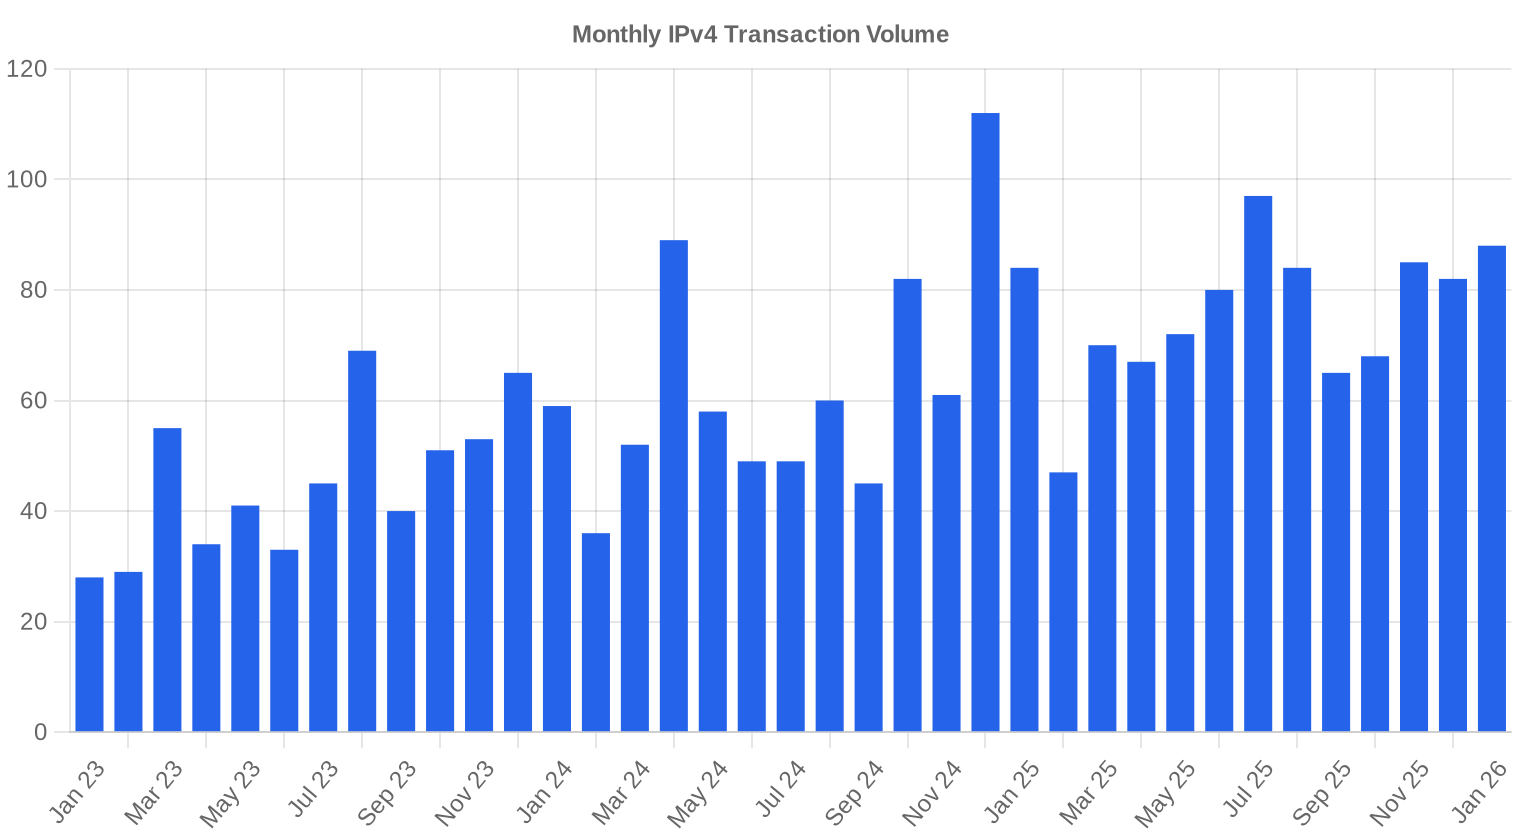
The IPv4 transfer market opened 2026 with a weighted average price of $20.70 per address across 88 recorded transactions, moving 978,432 IPs for a combined $10.47 million. That average is down 39.2% from January 2025 — the steepest year-over-year decline we've tracked in this dataset. Median pricing came in at $20.95, tightly clustered around the mean, suggesting broad-based price compression rather than a handful of distressed sales dragging the number down. The trend indicator remains negative, with our regression model posting a -2.06% monthly slope. Volume was healthy by transaction count but heavily concentrated: seven deals exceeding $1 million accounted for the bulk of total value, while 69 sub-$50K trades made up the long tail.Market Overview
| Transactions | 88 |
| IP Addresses Traded | 978,432 |
| Estimated Market Value | $10,473,851 |
| Average Price / IP | $20.70 |
| Median Price / IP | $20.95 |
| RIR Transfers | 630 |
Year-over-Year Comparison
| Metric | This period | A year earlier (January 2025) | Change |
|---|---|---|---|
| Transactions | 88 | 84 | +4.8% |
| IP Addresses Traded | 978,432 | 83,712 | +1,068.8% |
| Estimated Market Value | $10,473,851 | $2,733,540 | +283.2% |
| Average Price / IP | $20.70 | $34.02 | -39.2% |
| RIR Transfers | 630 | 1,382 | -54.4% |
Price Dynamics
The spread between the cheapest and most expensive address transacted in January was enormous — $8.50 at the floor versus $41.00 at the ceiling, a nearly 5x gap. That $8.50 low almost certainly reflects a large ARIN block sold with volume discount or legacy baggage; the $41.00 high likely represents a clean, small-prefix ARIN block where per-IP premiums are standard. The median of $20.95 sitting just above the mean tells us the distribution is roughly symmetrical — no heavy skew from outliers. What's striking is the pace of erosion: a year ago, the average hovered near $34/IP. We've given back a third of the post-peak valuation in twelve months, and the regression line shows no signs of flattening. Buyers who waited through 2025 are being rewarded; sellers who held for a bounce are running out of patience.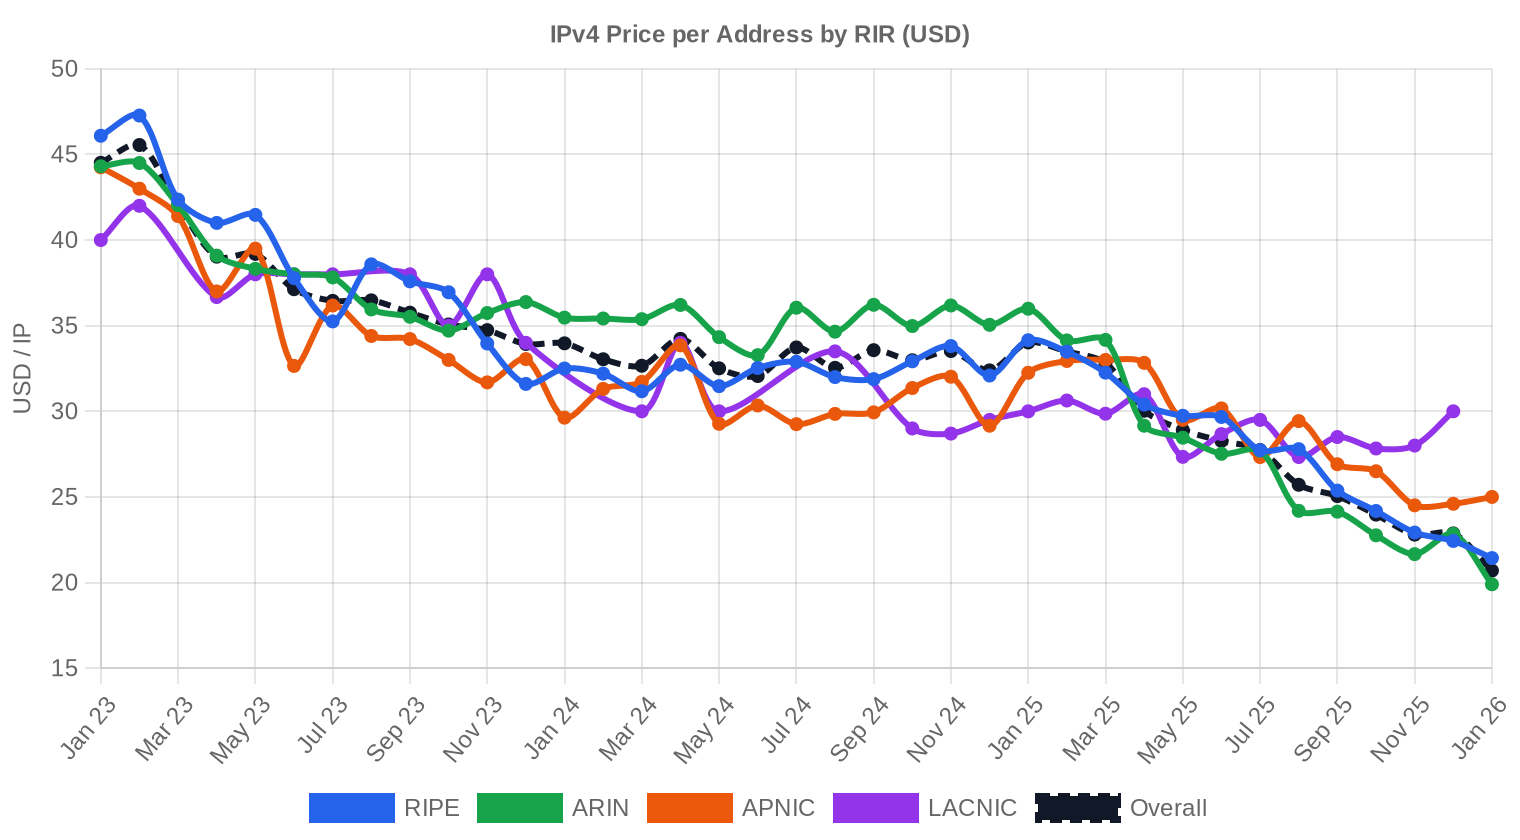
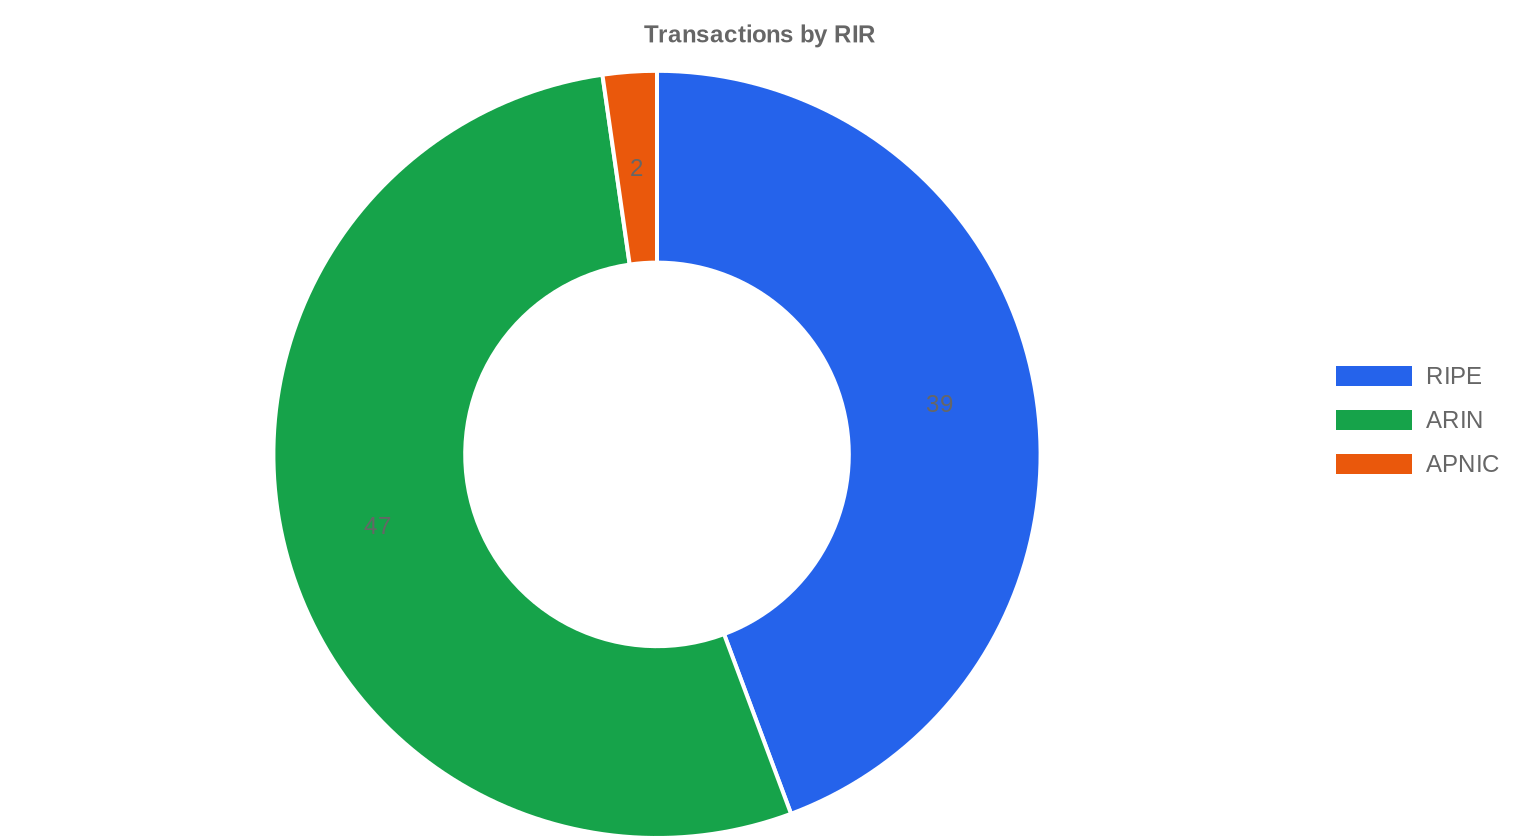
Pricing by RIR
ARIN dominated transaction count and volume but not pricing. RIPE commands a modest premium on a per-IP basis, which has been the pattern for most of the past two years as European supply remains tighter due to the 24-month holding rule. ARIN: $19.90/IP average across 47 transactions (87.9% of total IP volume). Median $20.45. The $8.50 floor and $41.00 ceiling both came from ARIN deals, reflecting the registry's wide block-size diversity. RIPE: $21.43/IP average across 39 transactions (11.6% of IP volume). Median $21.00. Tighter range — $13.00 to $29.90 — consistent with RIPE's smaller typical block sizes and regulatory friction. APNIC: $25.00/IP average across just 2 transactions (0.5% of volume). Both deals priced identically, likely /20s from the same seller or broker. APNIC continues to carry the highest per-IP premium among active registries, driven by chronic scarcity in the Asia-Pacific region. LACNIC and AFRINIC recorded zero transactions. LACNIC inactivity has been the norm for months; AFRINIC's ongoing governance issues continue to freeze its transfer market.| RIR | Transactions | Avg $/IP | Median $/IP | IPs Traded | RIR Transfers | Next Month (proj.) | Year-End (proj.) |
|---|---|---|---|---|---|---|---|
| RIPE | 39 | $21.43 | $21.00 | 113,152 | 376 | $20.00 | $15.50 |
| ARIN | 47 | $19.90 | $20.45 | 860,160 | 254 | $19.50 | $15.00 |
| APNIC | 2 | $25.00 | $25.00 | 5,120 | 0 | $24.50 | $21.00 |
Transaction Volume
Supply & Block Sizes
/23 blocks were the most frequently traded prefix size, accounting for 21 of 88 transactions. This is consistent with what we've seen over the past year: mid-tier buyers — regional ISPs, managed hosting shops, small cloud operators — gravitating toward 512-address blocks that balance per-IP cost against operational utility. Larger prefixes (/16 and above) moved in the seven-figure deals but are increasingly rare on the open market.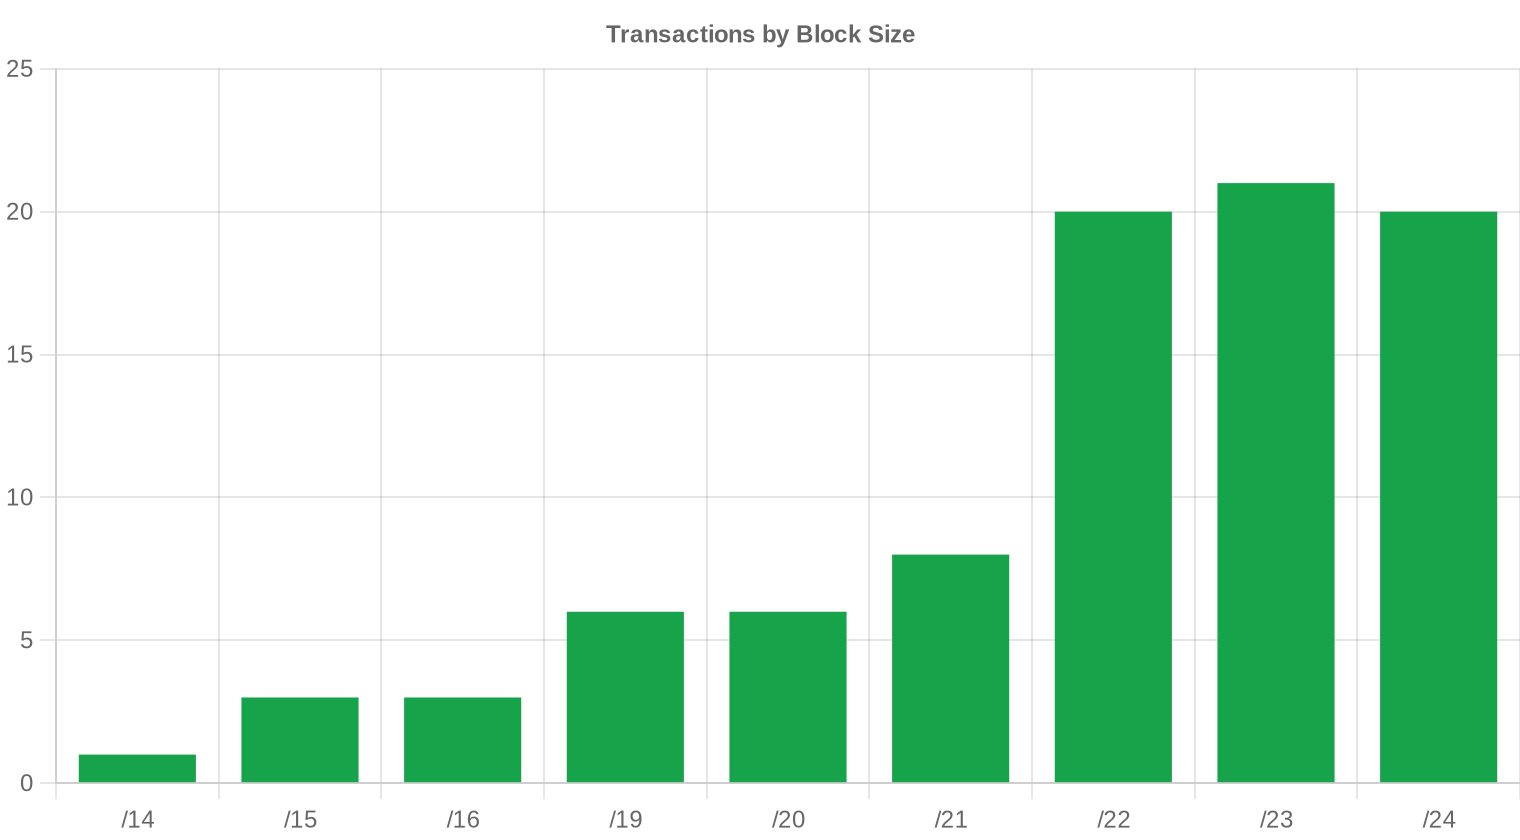
Geographic Activity
The United States led with 36 transactions, followed by the United Kingdom at 11 and the Netherlands at 7. Canada contributed 6 deals. The US share is unsurprising given ARIN's dominance in volume, but the UK's second-place finish — ahead of traditional European hubs like Germany (2) and France (0) — suggests British ISPs and hosting firms are actively restocking. Several cross-border deals appeared, including two US-Ukraine transactions, a pattern that has persisted despite geopolitical headwinds.Registry Transfer Activity
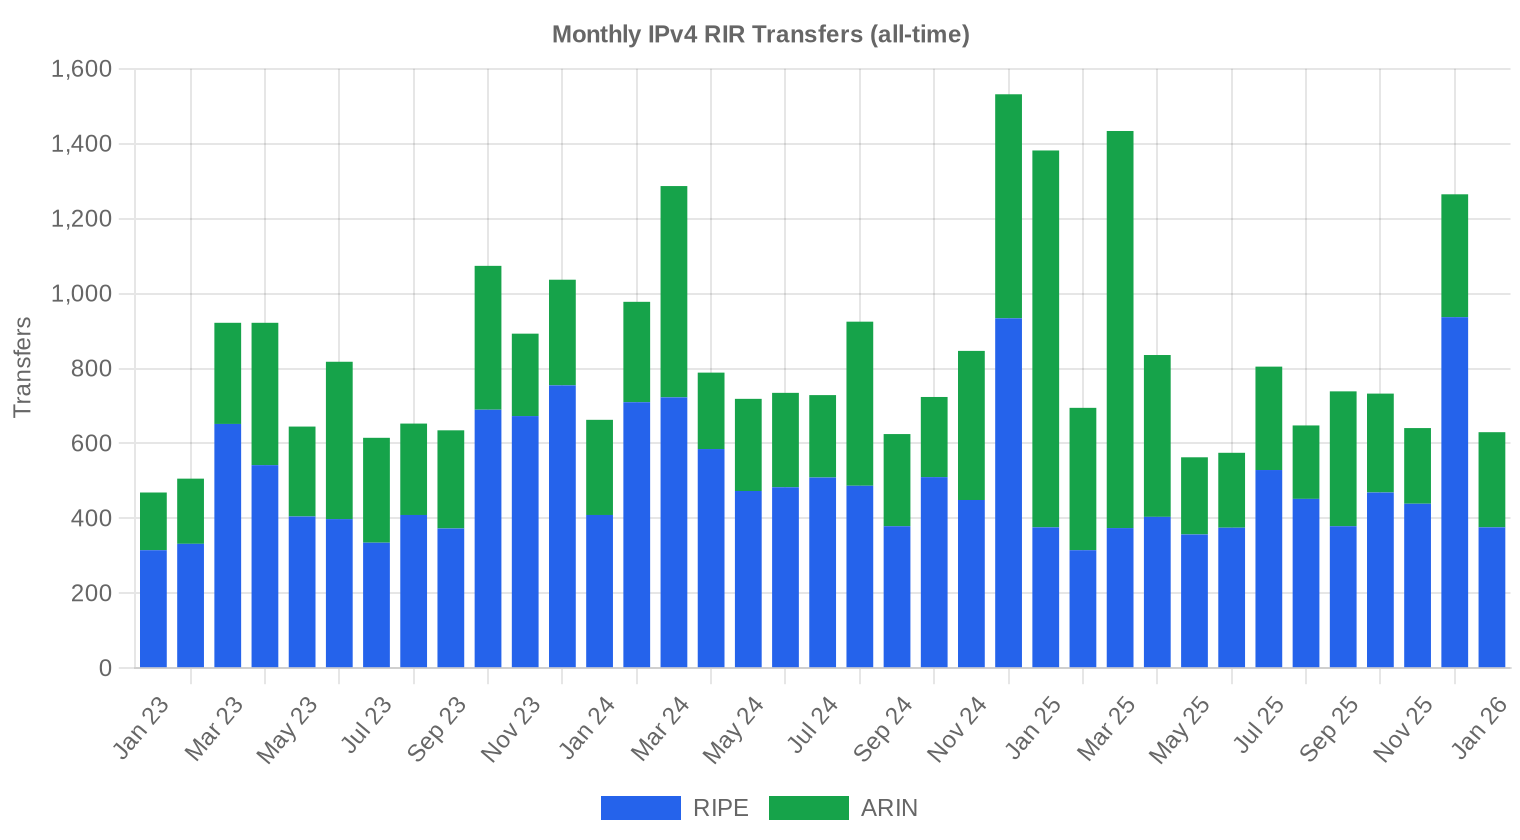
Total recorded RIR transfers for January reached 630 across all registries. RIPE led with 376 transfers — 59.7% of the total — while ARIN accounted for 254. The gap between RIPE's transfer count and its transaction share in our pricing dataset reflects the high volume of intra-organization and policy-based transfers within RIPE that don't involve monetary exchange.Long-Run Transfer Trends
Over the 37 months we've tracked transfer activity, the cumulative total stands at 30,688 recorded transfers. The single busiest month was December 2024, which aligns with end-of-year balance sheet optimization and use-it-or-lose-it budget cycles. January's 630 transfers represent a normal post-holiday reset, and we'd expect activity to build through Q1 as enterprise procurement cycles restart.| RIR | RIR Transfers |
|---|---|
| RIPE | 18,312 |
| ARIN | 12,376 |
| RIR Transfers | 30,688 |
Outlook & Forecast
Forecasting each block-size band and RIR separately with our AI model:
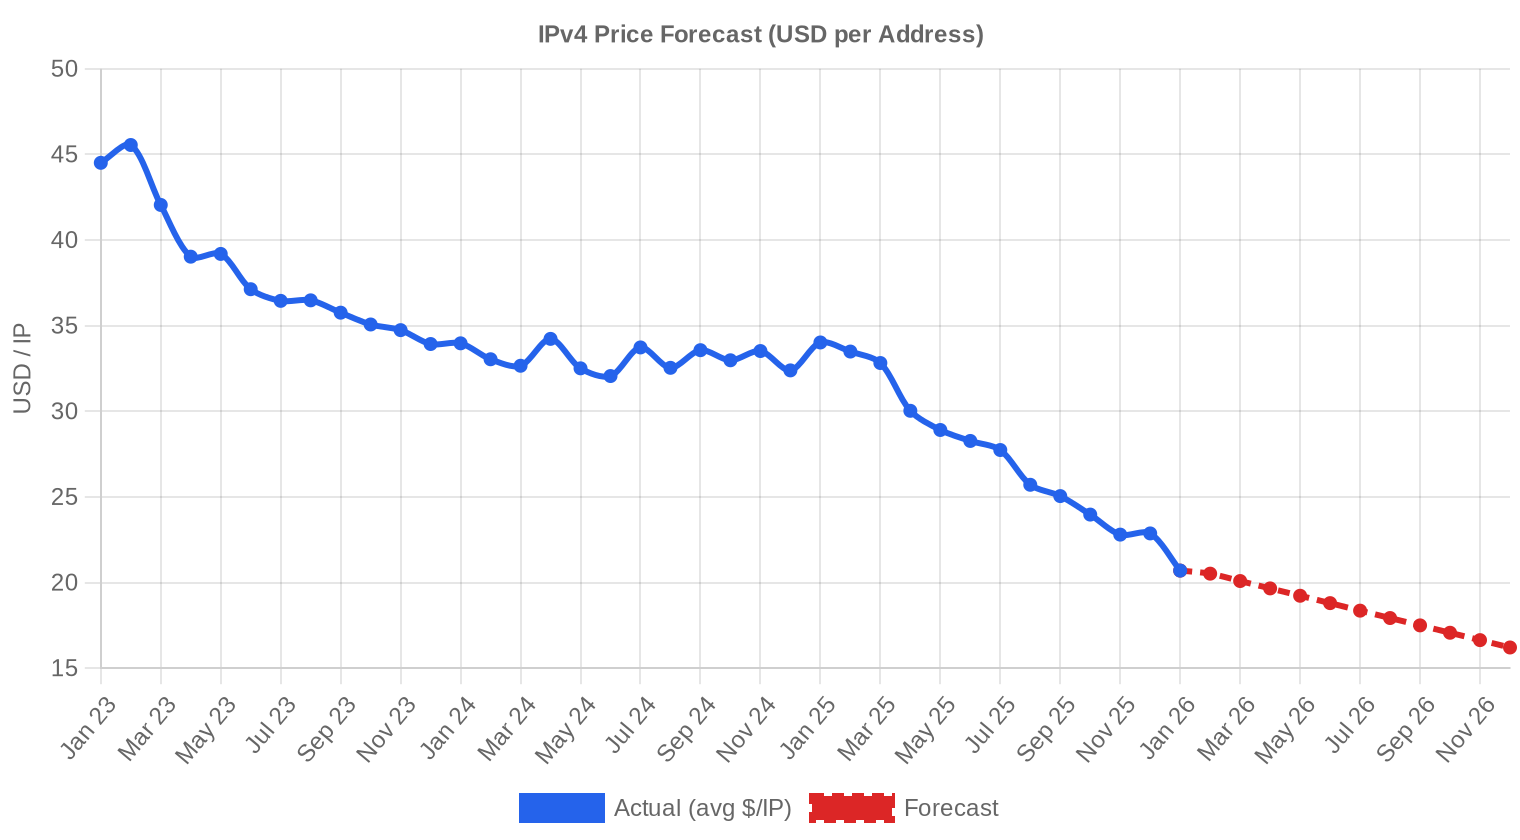
The overall average price per IP is projected to reach $16.21 by December 2026, with a next-month estimate of $19.46 per IP.
- RIPE: projected at $20.00 per IP next month, trending toward $15.50 by December 2026.
- ARIN: projected at $19.50 per IP next month, trending toward $15.00 by December 2026.
- APNIC: projected at $24.50 per IP next month, trending toward $21.00 by December 2026.
- LACNIC: projected at $29.50 per IP next month, trending toward $28.00 by December 2026.
- AFRINIC: insufficient data for a reliable forecast.
Forecast by Block Size
| Block | Current $/IP | Next Month | Year-End | Confidence |
|---|---|---|---|---|
| /24 | $23.00 | $22.50 (-2.2%) | $19.00 (-17.4%) | medium |
| /23 | $21.50 | $21.00 (-2.3%) | $17.50 (-18.6%) | medium |
| /22 | $20.50 | $20.00 (-2.4%) | $16.50 (-19.5%) | medium |
| /21 | $17.83 | $17.50 (-1.9%) | $14.00 (-21.5%) | low |
| /20 | $17.00 | $17.00 (0.0%) | $14.50 (-14.7%) | low |
| /19 | $15.00 | $15.00 (0.0%) | $12.50 (-16.7%) | low |
| /18-/16 | $10.00 | $10.00 (0.0%) | $8.50 (-15.0%) | low |
| /15-up | $9.25 | $9.00 (-2.7%) | $7.50 (-18.9%) | low |
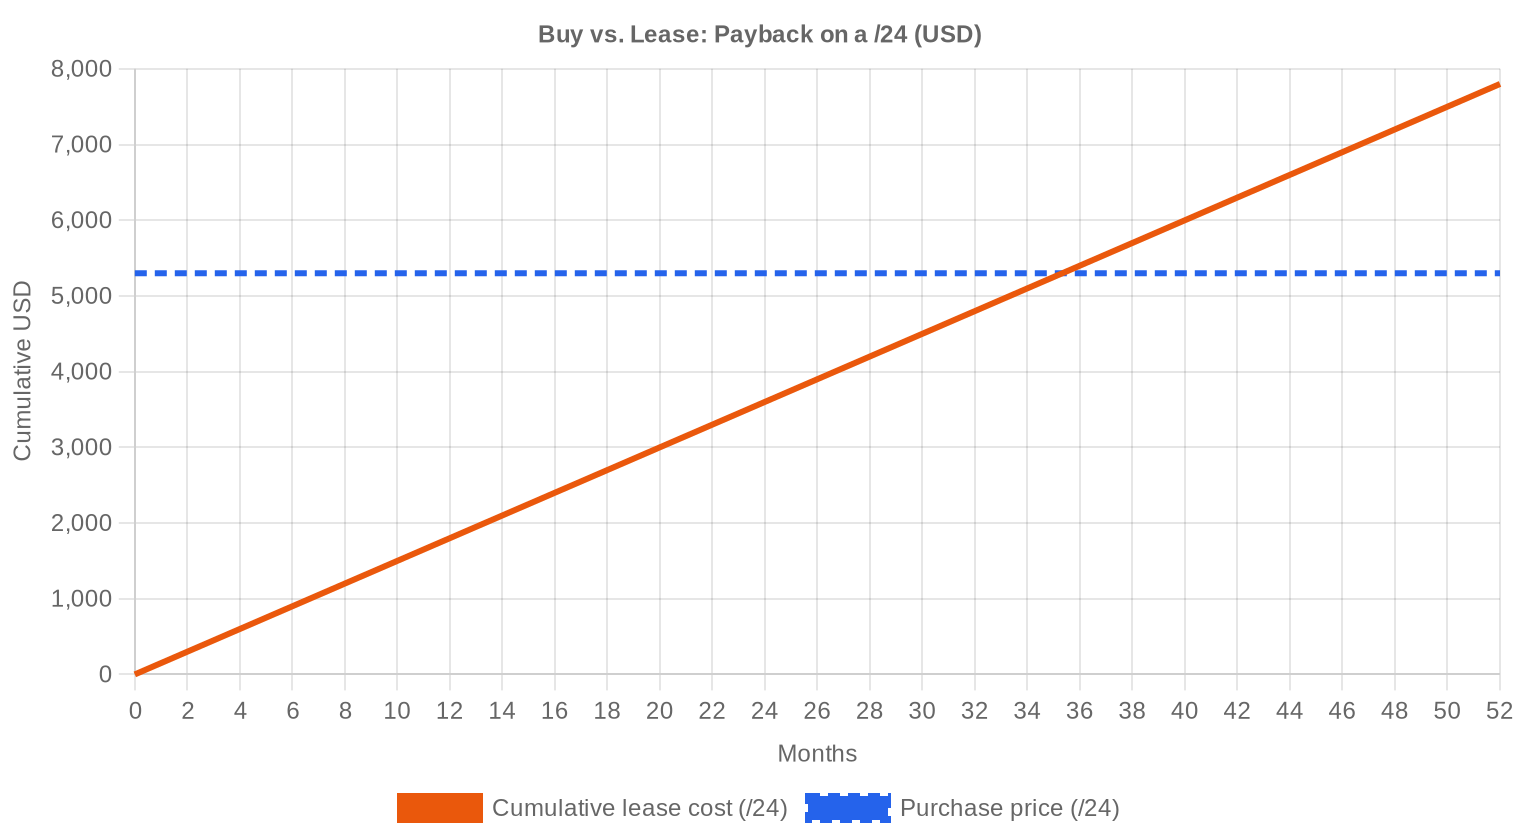
Editor's Take: Buy vs. Lease
The buy-versus-lease calculus has shifted decisively toward buying. At current pricing, a /24 costs roughly $5,299. Leasing the same block runs $150/month, or $1,800 annually. That puts the breakeven at 35.3 months — just under three years. With prices trending lower, the effective payback period could shrink further if you buy now and avoid future lease escalations. The implied annual yield for a lessor is 34%, which is extraordinary by any fixed-income standard but reflects the illiquidity premium and operational overhead of managing lease portfolios. For any organization with a planning horizon beyond three years, buying is the clear choice at $20.70/IP. Lessees paying $0.59/IP/month are effectively renting at an annualized rate that exceeds the asset's likely depreciation — a poor trade unless you need addresses for under 30 months.| /24 Purchase price | $5,299 |
| /24 Lease price | $150 / mo |
| Payback period | 35.3 mo (2.9 yr) |
| Gross annual yield | 34.0% |
What This Means for You
Buyers: You're operating in the most favorable pricing environment since 2019. The 39.2% year-over-year decline gives you real leverage in negotiations. Don't chase /24s at $29+ when /23s are trading at $20-$21 per IP with better per-unit economics. If your requirement is 12 months out, the forecast suggests waiting could save another 20%, but supply of clean blocks isn't infinite — don't time the bottom at the expense of availability. Sellers: The pricing trajectory is not your friend. Every month of delay costs roughly 2% based on the regression slope. If you're sitting on blocks acquired above $30/IP, the write-down is already real — the question is whether to crystallize the loss now or ride it to $16. Blocks with clean reputation and ARIN registration still command premiums; use that to negotiate above-market. Leasers: At $0.59/IP/month, leasing remains the right call for short-duration needs under 30 months. Beyond that, purchasing at $20.70 is cheaper on a net-present-value basis even with modest discount rates. Review your lease portfolio for contracts signed at higher rates — there's renegotiation room. Block Holders: If you're generating lease income at 34% annualized yield, hold and lease. That return dwarfs anything in fixed income. But if utilization is low and you lack the infrastructure to manage leases, selling into this market before prices erode further makes sense. The clock is ticking on every idle block.Browse verified IPv4 blocksSell IPv4 →
List your blocks with managed transferLease IPv4 →
Flexible short-term capacityLease Out IPv4 →
Turn idle blocks into recurring revenue
IPv4 Pricing by Block Size
Small-prefix premiums remain intact. /24 blocks trade at the upper end of the range — often $25-$30/IP in RIPE and $22-$28 in ARIN — while /16 and larger blocks clear at $15-$19/IP due to volume discounting. The /23 sweet spot at 21 transactions reflects buyers optimizing between the per-IP premium of tiny blocks and the capital outlay of larger ones. Expect the small-block premium to compress as overall prices decline, since absolute dollar differences shrink even as percentage premiums persist.| Block | IPs | Buy: /IP | Buy: Total | Lease: /IP/mo | Lease: Monthly |
|---|---|---|---|---|---|
| /24 | 256 | $35–45 | $8,960–11,520 | $0.38–0.50 | $97–128 |
| /22 | 1,024 | $28–38 | $28,672–38,912 | $0.33–0.45 | $338–461 |
| /20 | 4,096 | $22–32 | $90,112–131,072 | $0.30–0.40 | $1,229–1,638 |
| /18 | 16,384 | $20–30 | $327,680–491,520 | $0.30–0.38 | $4,915–6,226 |
| /16 | 65,536 | $18–28 | $1,179,648–1,835,008 | $0.30–0.35 | $19,661–22,938 |
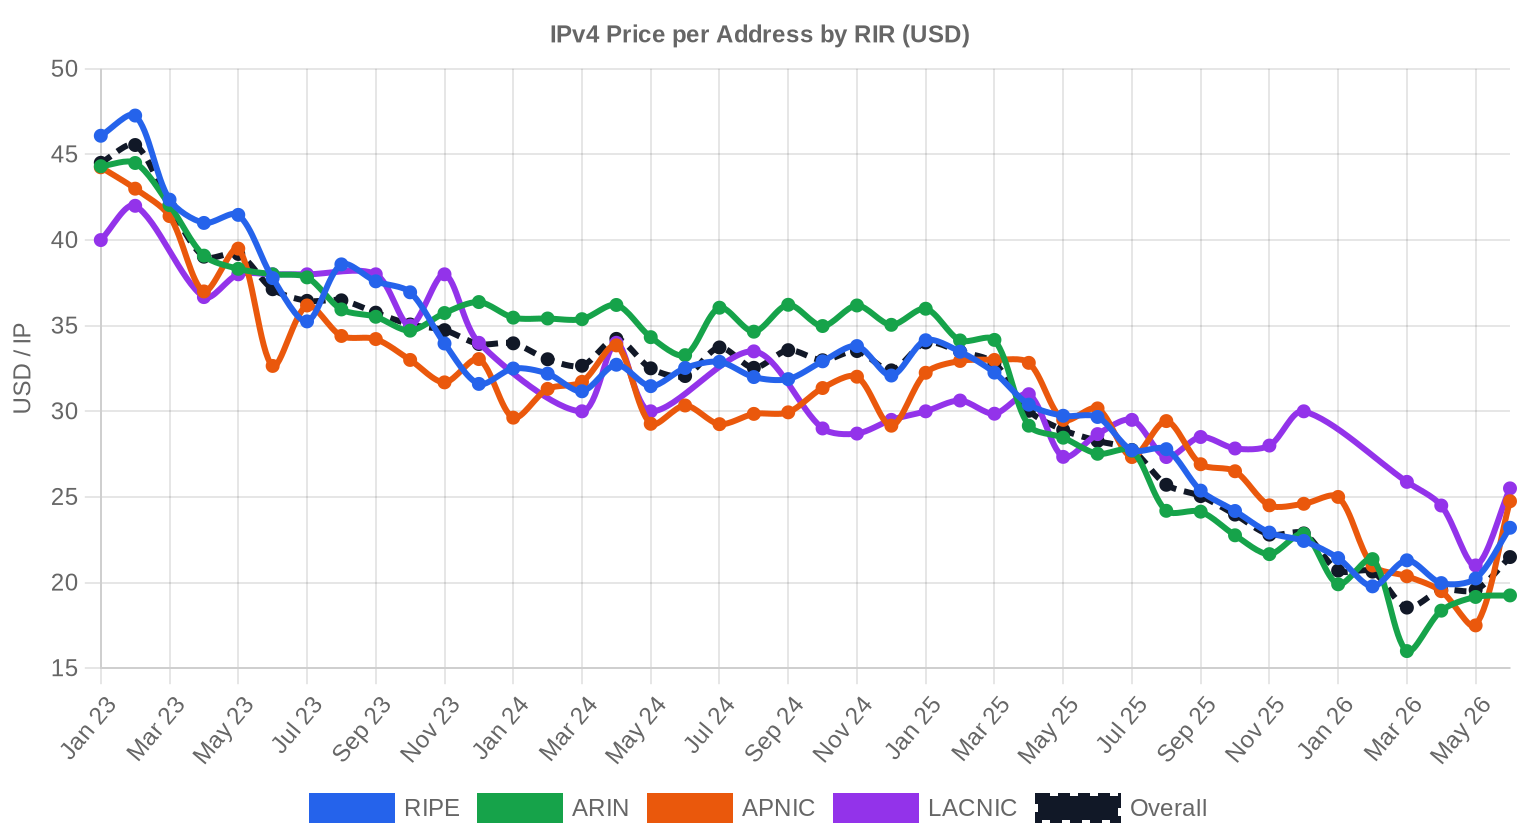
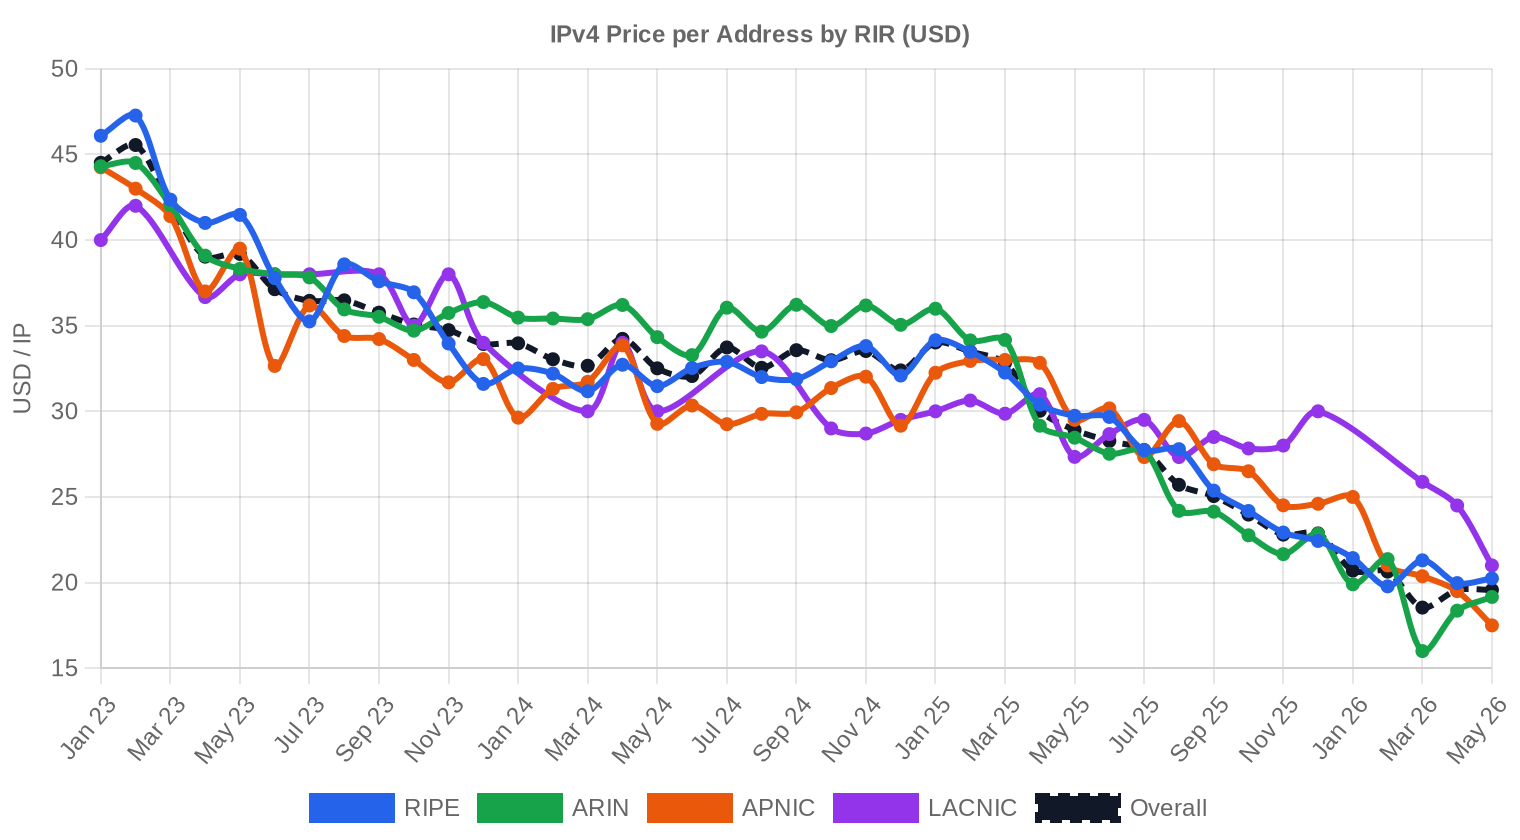
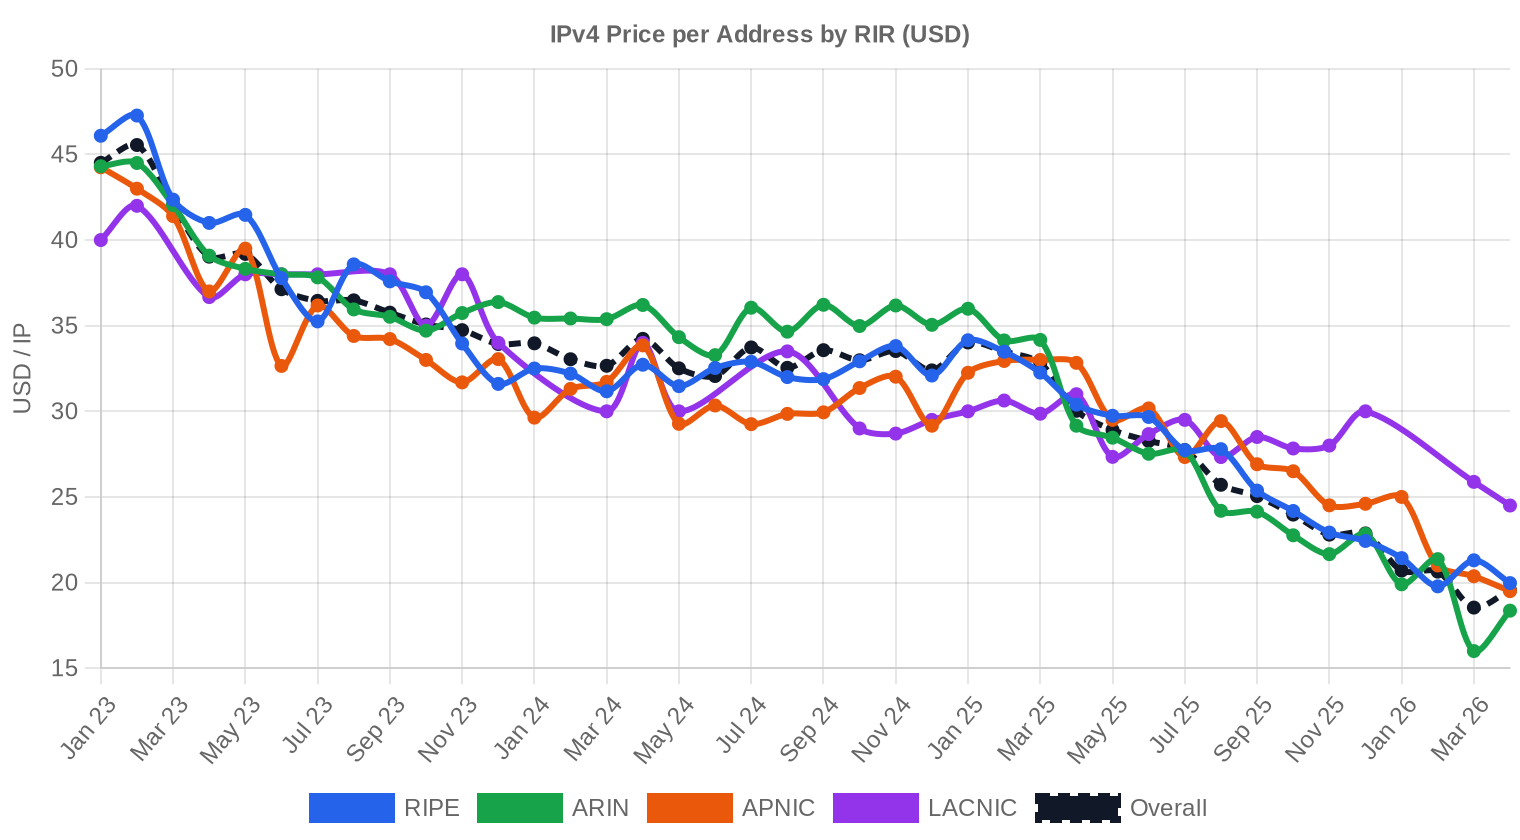
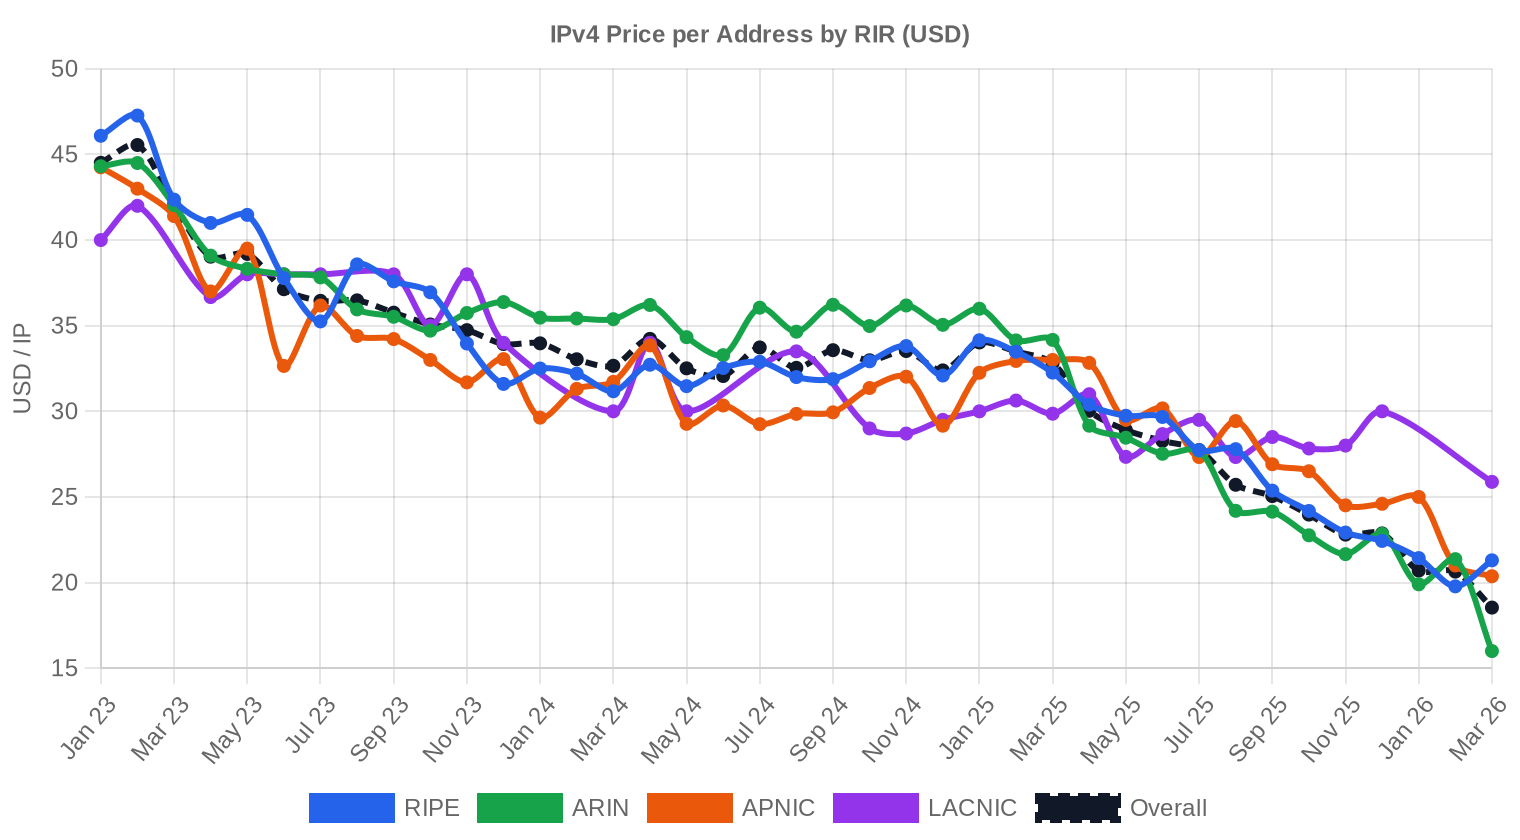
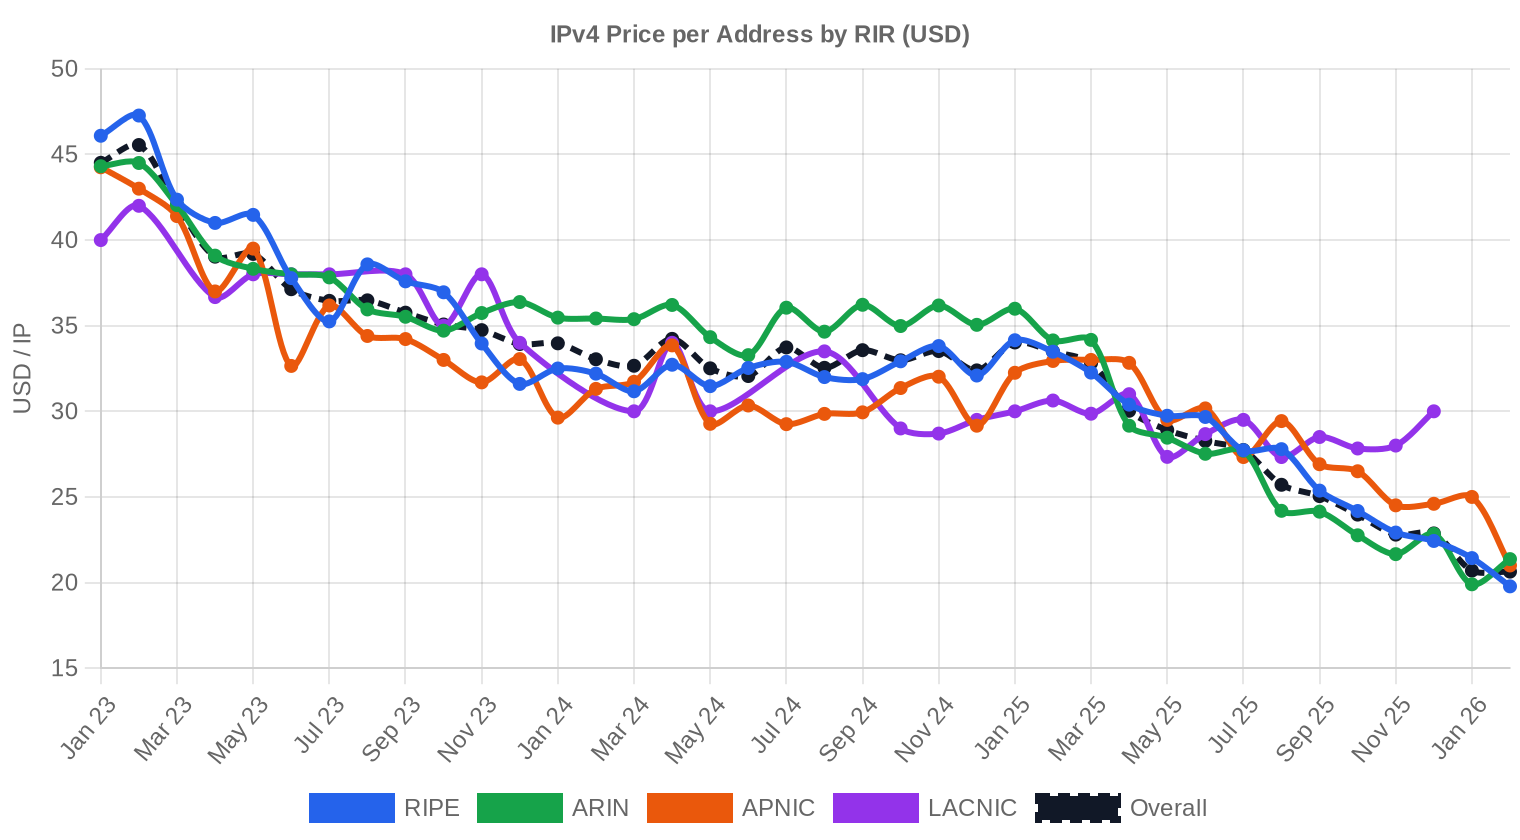
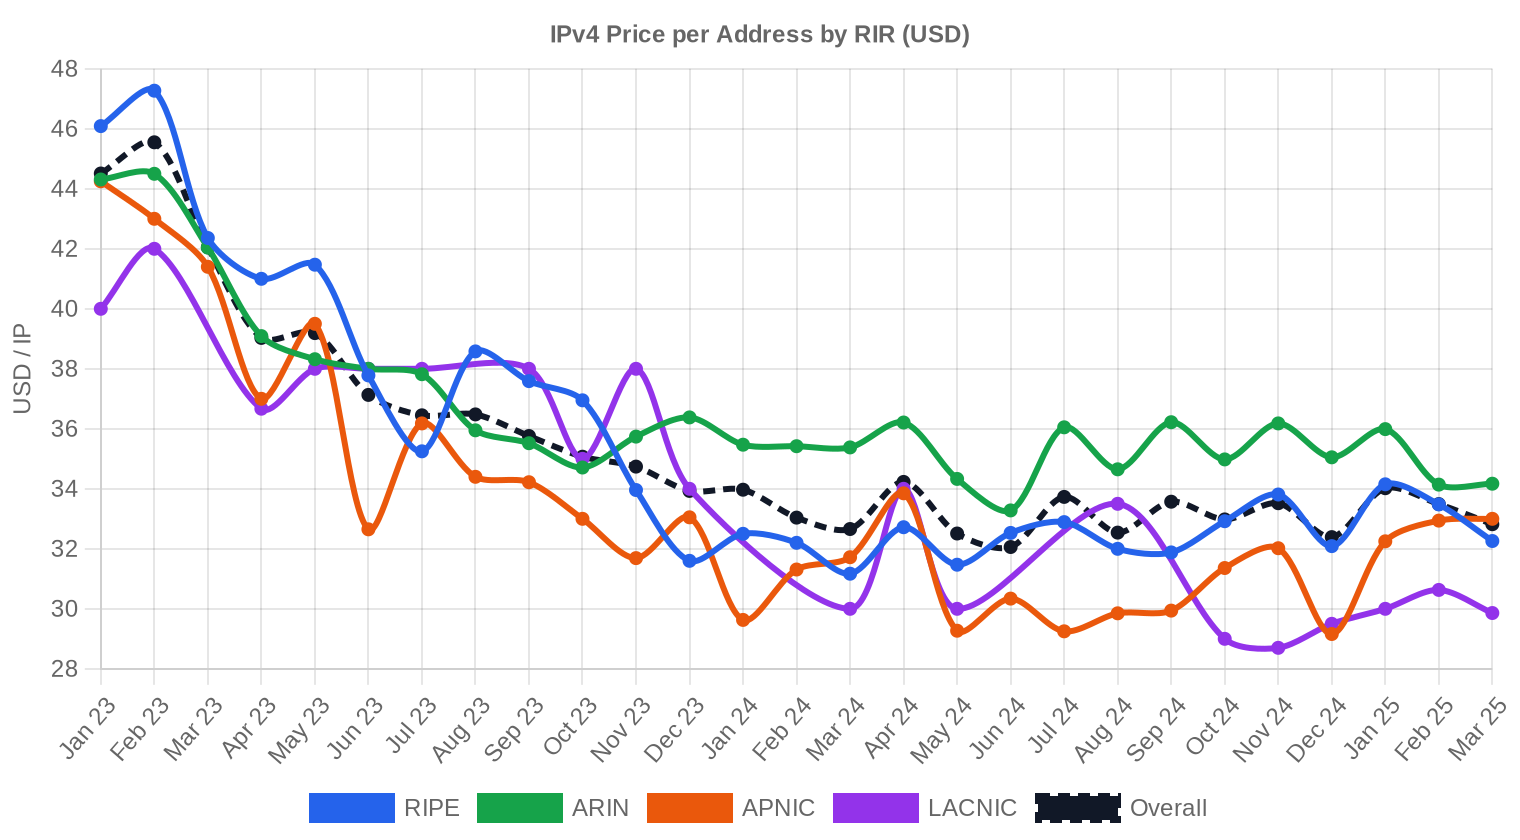
IPv4 Price History: 2011–2026
IPv4 addresses first acquired measurable market value after IANA free pool exhaustion in 2011, when prices hovered around $5-$7/IP. The market climbed steadily through the mid-2010s, accelerated sharply during the pandemic-era cloud buildout, and peaked near $55-$60/IP in late 2023 to early 2024. AWS's decision to charge $3.60/year per public IPv4 address — effective February 2024 — triggered a structural repricing as organizations released unused allocations. January 2026's $20.70 average represents a 63% drawdown from peak levels, and the market appears to be settling into a new equilibrium band between $15 and $25.| Year | ~Price/IP | Key Event |
|---|---|---|
| 2011 | $7–12 | IANA free pool exhausted; Microsoft/Nortel deal ($11.25/IP) |
| 2012 | $8–12 | RIPE NCC reaches last /8; begins /22-only allocation |
| 2014 | $10–15 | LACNIC free pool exhausted |
| 2015 | $8–15 | ARIN free pool exhausted |
| 2017–18 | $12–18 | Leasing market grows; cloud demand rises |
| 2019 | $18–24 | RIPE NCC exhausts remaining free pool |
| 2021–22 | $50–60+ | Post-pandemic peak; hyperscaler build-outs |
| 2024 | $35–52 | AWS IPv4 charge ($0.005/IP/hr); large block correction |
| 2025–26 | $18–45 | Market bifurcation; /16s below $20 for first time since 2019 |
Market Structure: Who Is Buying & Selling
The buy side is dominated by mid-tier ISPs, regional hosting companies, and enterprise IT departments backfilling allocations they can no longer justify leasing. Hyperscalers have largely stepped back from the open market, either self-sufficient from prior acquisitions or managing demand through IPv6 and CGNAT. On the sell side, legacy holders — universities, government agencies, and corporations that received large allocations in the 1990s — continue to monetize surplus space, joined by distressed sellers who acquired blocks at peak prices and need liquidity.IPv4 vs. Other Asset Classes
At a 34% implied annual yield from leasing, IPv4 addresses outperform virtually every traditional asset class on a cash-flow basis. U.S. Treasuries yield under 5%, commercial real estate cap rates sit around 6-8%, and the S&P 500's dividend yield is roughly 1.4%. The catch is illiquidity, operational overhead, and a depreciating underlying asset — the per-IP purchase price is falling, which erodes total returns. Think of it as a high-yield bond with principal erosion: attractive for income, poor for capital appreciation.| Asset Class | Typical Yield | Liquidity | Primary Risk |
|---|---|---|---|
| IPv4 | 34.0% | Moderate | IPv6 adoption, block quality |
| Commercial Real Estate | 5–8% | Low | Vacancy, rate cycle |
| Investment-Grade Bonds | 4–5% | High | Duration, credit risk |
| S&P 500 | ~1,3% | High | Market volatility |
| Money Market / T-Bills | ~4–5% | High | Rate cycle changes |
IPv6 Adoption & Why IPv4 Remains Essential
IPv6 adoption continues its slow crawl. Google's measurement data shows roughly 45% of users reaching its services over IPv6, but enterprise internal networks, legacy infrastructure, and large swaths of the hosting industry remain firmly on IPv4. Dual-stack will be the operational reality for at least another decade. The transition suppresses but does not eliminate IPv4 demand — it simply shifts the buyer profile from growth-driven to maintenance-driven, which explains the price decline without a collapse in transaction volume.AI & Cloud Infrastructure Demand
AI infrastructure buildouts require public IPv4 addressing for API endpoints, model-serving clusters, and data ingestion pipelines. The major training labs — OpenAI, Anthropic, Google DeepMind, xAI — rely primarily on hyperscaler cloud capacity with pre-existing IPv4 pools, but the second wave of AI startups and inference-at-the-edge deployments is creating incremental demand for /23 and /22 blocks. This demand is real but modest relative to total market volume; it's not enough to reverse the pricing trend but may put a floor under it.What Determines IPv4 Block Value
Block cleanliness remains the single most important pricing variable. Addresses with blacklist hits, spam history, or association with bulletproof hosting trade at 30-50% discounts. Allocation age matters — pre-RIR "legacy" blocks carry simpler transfer mechanics in ARIN. RIPE blocks command premiums due to supply constraints from the 24-month rule but face transferability restrictions that ARIN blocks don't. Geographic reputation of the originating network also factors in: blocks previously announced by known-clean networks sell faster and higher.Sell vs. Lease: A Decision Framework
In a declining-price market, sellers with large blocks should seriously consider accelerating dispositions rather than holding for a recovery that the data does not support. Leasing makes sense if you have the infrastructure to manage tenants and can tolerate the operational burden — that 34% yield is compelling. But if prices fall to $16.21 by December as forecast, a block worth $20.70/IP today will have lost 22% of its sale value, and only about $7/IP in lease income could be captured over that period. For blocks you don't plan to lease, sell now.| /24 Purchase price | $5,299 |
| /24 Lease price | $150 / mo |
| Payback period | 35.3 mo (2.9 yr) |
| Gross annual yield | 34.0% |
RIPE NCC 24-Month Transfer Restriction
RIPE's 24-month holding requirement continues to act as a supply brake on the European market. Any block transferred within the RIPE region cannot be re-transferred for two years, which discourages speculative flipping and keeps secondary supply tight. This is the primary reason RIPE pricing ($21.43) runs above ARIN ($19.90) despite lower absolute demand in Europe. The rule effectively creates a two-tier market: RIPE blocks trade at a regulatory premium that has nothing to do with the addresses themselves.Deal Size Distribution
The average deal size ballooned to 119,021 IPs in January, up from 32,542 IPs a year ago — a 266% increase driven by a handful of very large ARIN block transfers. The distribution is extremely bimodal: 69 of 88 transactions fell below $50K in total value, collectively worth just $1.09 million, while 7 deals over $1 million accounted for $17.6 million in notional value. The middle tier — $50K to $250K — saw 12 transactions worth $1.53 million. The $250K-$1M band was completely empty, an unusual gap that suggests institutional buyers are either going big or staying small.Top Trading Countries
The US accounted for 41% of all transactions (36 of 88), consistent with its share of global IPv4 address space and the depth of ARIN's transfer infrastructure. The UK's 11 deals — 12.5% of activity — reflect ongoing demand from British ISPs navigating post-Brexit digital infrastructure investment. The Netherlands continues to punch above its weight at 7 transactions, driven by Amsterdam's status as Europe's densest data center market and a hub for hosting providers who need clean RIPE space.BEAD Broadband Program Impact
The $42.45 billion BEAD program is entering its disbursement phase, and rural broadband buildouts funded by these grants will require IPv4 allocations for subscriber networks. Most BEAD recipients are small and mid-sized ISPs who lack existing IPv4 inventory and will need to acquire /20 to /18 blocks. This cohort hasn't hit the market in force yet, but when it does — likely mid-to-late 2026 — it could absorb meaningful supply in the /22 to /18 range and create localized price support for ARIN blocks even as the broader market drifts lower.Hyperscaler IPv4 Holdings
Amazon, Microsoft, and Google collectively control an estimated 100+ million IPv4 addresses — enough to influence market pricing by either releasing or withholding supply. AWS's public IPv4 charge has been the single most deflationary event in recent market history, incentivizing customers to release addresses back to Amazon's pool rather than the open market. Microsoft's acquisition of large blocks in 2023-2024 appears to have peaked, and there's no indication of further large purchases. If any hyperscaler decided to monetize even 5% of its holdings, the supply shock would push prices well below our $16.21 year-end forecast.Macroeconomic Conditions & Market Impact
Central bank rate cuts through late 2025 have eased financing conditions for enterprise IT spending, but the effect on IPv4 demand is muted. Most IPv4 purchases are funded from operating budgets, not debt. The bigger macro driver is cloud cost optimization: as organizations scrutinize every line item in their infrastructure spend, releasing and selling unused IPv4 space has become a CFO-level initiative. This sell-side pressure is a larger factor in the price decline than any demand-side weakness.Model Update & Calibration
As part of our continuous improvement process, we backtested previous forecasts against realised prices and fine-tuned the model accordingly. Recent months now carry more influence than older data, and the confidence bands have been widened or narrowed based on how well they captured actual outcomes in the past. You can see the full backtest results in the table and chart below.
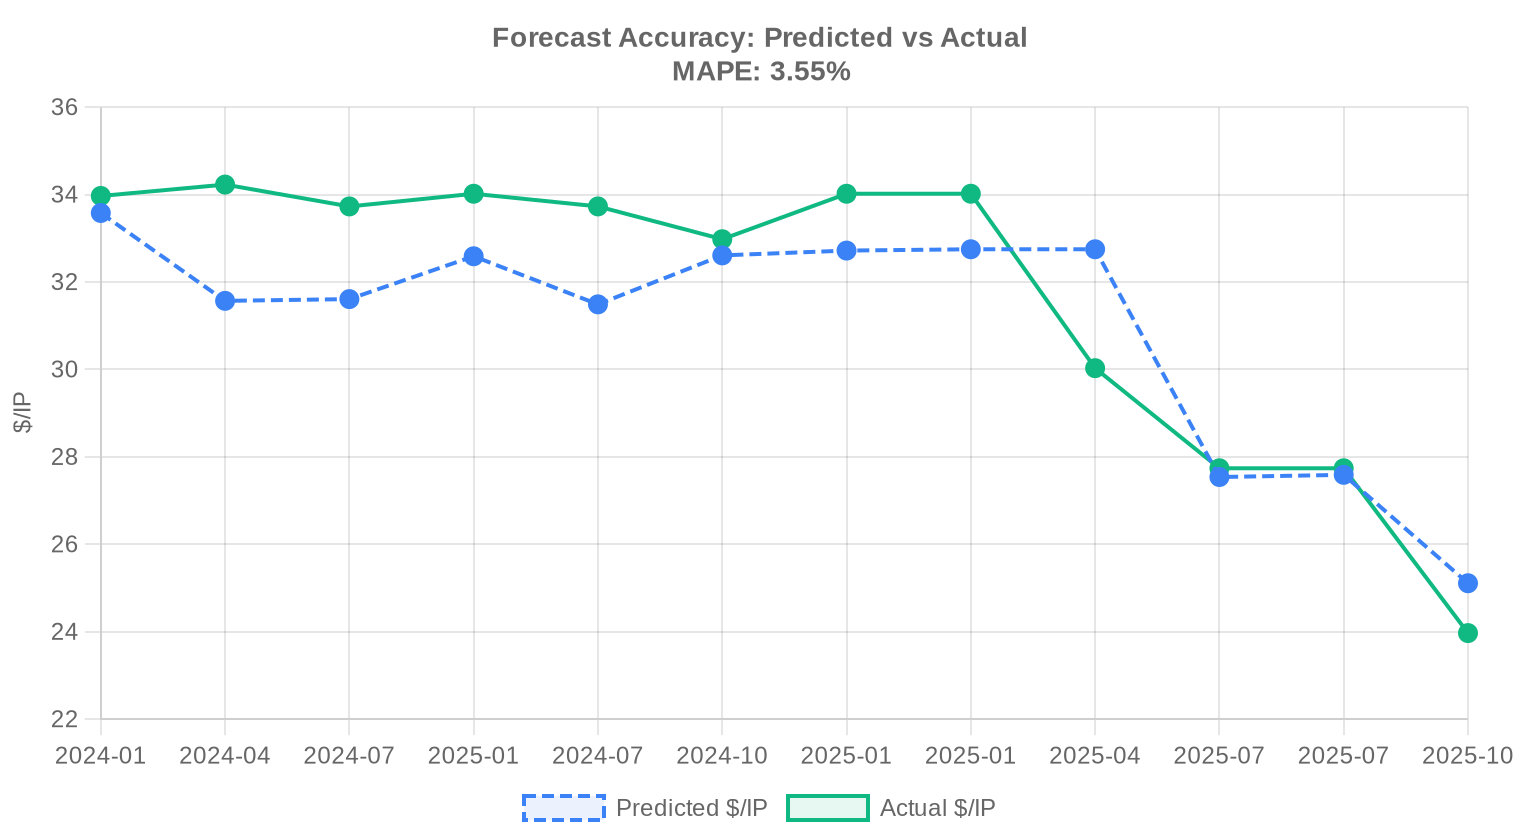
| Report Period | Target Month | Predicted | Actual | Deviation |
|---|---|---|---|---|
| 2024-H2 | 2025-01 | $33 | $34 | -4% |
| 2024-Q4 | 2025-01 | $33 | $34 | -4% |
| 2025-Q1 | 2025-04 | $33 | $30 | +9% |
| 2025-H1 | 2025-07 | $28 | $28 | -1% |
| 2025-Q2 | 2025-07 | $28 | $28 | -1% |
| 2025-Q3 | 2025-10 | $25 | $24 | +5% |
Methodology
Figures are based on completed IPv4Center marketplace transactions and RIR transfer statistics. Prices are in US dollars per IP address. Forecasts are produced by an AI model that analyses each block-size band and RIR segment separately (with outlier-trimmed medians) alongside known market catalysts; they are estimates, not guarantees.
Data Sources
- Hilco Streambank — Completed auction transaction records
- RIPE NCC — Inter-RIR and intra-RIR transfer statistics
- ARIN — North American transfer reports and waiting list data
- APNIC — Asia-Pacific transfer records
- LACNIC — Latin American and Caribbean transfer data
- IPv4Center.com — Proprietary marketplace transaction and lease pricing data
This report is generated automatically for informational purposes only and does not constitute financial advice.
Frequently Asked Questions
What was the average price per IPv4 address in January 2026?
The market-wide average landed at .70 per address, with a median of .95. That 2% gap between mean and median suggests a distribution only mildly skewed by outlier transactions — a relatively orderly tape.
How many transactions closed in January 2026 and what was the total dollar volume?
Eighty-eight sale transactions moved 978,432 addresses for an aggregate .47 million. The average deal size was roughly 119,000 IPs, though that figure is heavily pulled by a handful of seven-figure ARIN block sales.
Why is the ARIN average price lower than RIPE's despite ARIN dominating volume?
ARIN averaged .90 per IP versus RIPE's .43, a .53 discount. ARIN's 860,160 addresses transacted include several very large blocks — which almost always trade at volume discounts. RIPE's 113,152 IPs skewed toward smaller, premium-priced parcels where per-unit economics are less forgiving.
APNIC addresses averaged — is that sustainable or an anomaly?
Only two APNIC transactions closed in January, totaling 5,120 IPs at a flat .00 per address. With a sample that thin, it is dangerous to call it a trend. That said, chronic APNIC supply scarcity has historically supported a premium, and is directionally consistent with that pattern.
What was the price range observed across all deals in January 2026?
The floor was .50 per IP (an ARIN transaction, likely a very large or encumbered block) and the ceiling was .00 — also ARIN. A 4.8x spread between min and max is wide but not unprecedented; block size, cleanliness of WHOIS history, and buyer urgency all drive dispersion.
Which prefix size traded most frequently?
/23 blocks led the board with 21 transactions, reinforcing the pattern that mid-size buyers — typically SMBs and smaller hosting firms — remain the most active cohort. These 512-address blocks hit the sweet spot between affordability and operational utility.
What countries drove the most transaction activity?
The United States dominated with 36 deals, followed by the United Kingdom at 11 and the Netherlands at 7. Canada (6) rounded out the top tier. Collectively the top three countries accounted for over 61% of all transactions.
Is the market trending up or down heading into February 2026?
Down. The current trend shows a 2.06% decline, and our model forecasts a February average near .46 per IP. If you are a buyer, patience is being rewarded — modestly.
Where does the model see year-end 2026 pricing?
The forecast projects an average of .21 per IP by December 2026, implying roughly 22% downside from today's .70. The model is flagged as reliable, though we would note that policy shocks or sudden supply contractions could arrest the slide.
Should I buy or lease IPv4 addresses at current rates?
At .70 per IP to buy versus .5859 per IP per month to lease, the breakeven is 35.3 months — just under three years. For any holding period beyond that, buying is the superior economic choice. Our verdict: buy, provided you have a planning horizon of three-plus years.
What does the current lease market look like for a /24 block?
A /24 (256 IPs) leases for approximately 0 per month, or about ,031 annually. With 44 lease observations in the sample, this is a reasonably liquid market — at least on the RIPE side, which is where virtually all lease pricing data originates.
What yield does an IPv4 block generate for a lessor at current rates?
Annualized yield stands at roughly 34%, based on a .70 acquisition cost and .03 in annual lease revenue per IP. That is an eye-catching return, but it carries re-leasing risk, potential price depreciation, and growing IPv6 substitution headwinds.
What mistakes should buyers avoid in the current declining-price environment?
The biggest error is overpaying for urgency. With prices trending down 2% month-over-month and a year-end forecast of .21, locking in a + per-IP deal today requires a very compelling operational rationale. Also avoid neglecting transfer-policy lead times — ARIN and RIPE approvals can take 4–8 weeks, and that delay is not an excuse to pay a premium.
What are the risks of waiting too long to buy if prices are falling?
Forecasts are not guarantees. A large cloud provider re-entering the market or a policy change restricting transfers could reverse the trend overnight. Buyers who need addresses for near-term deployments should weigh operational cost-of-delay against the 2% monthly savings the model projects.
Are there risks to buying APNIC blocks at the current premium?
Yes. With only two January transactions, the APNIC market is illiquid. Resale could be difficult at the same price, and APNIC's inter-RIR transfer policies are more restrictive than ARIN's or RIPE's. You are paying a scarcity premium for a block whose exit liquidity is uncertain.
What should sellers be wary of in a market with downward price pressure?
Holding inventory in a declining market is a drag on returns. Sellers sitting on blocks hoping for a return to 2024-era pricing may find the bid eroding quarter by quarter. The model suggests .21 by year-end — every month of delay could cost roughly .37 per IP in realized value.
Why were there zero LACNIC and AFRINIC transactions in January?
Neither registry recorded a priced sale this month. LACNIC's transfer framework remains relatively restrictive, and AFRINIC continues to face governance challenges that dampen institutional buyer confidence. These regions are effectively off-the-run markets.
How did the deal-size distribution break down in January?
Sixty-nine transactions (78%) fell below K, accounting for just .09 million in value. Seven deals exceeded million and drove .6 million in notional volume — dwarfing the rest of the tape. The market remains bifurcated: high-frequency small trades and low-frequency whales.
How do RIPE and ARIN compare on transfer activity versus sales?
RIPE recorded 376 total transfers against 39 priced sales; ARIN logged 254 transfers against 47 sales. RIPE's transfer-to-sale ratio of nearly 10:1 indicates substantial internal or non-priced movement — likely intra-group restructurings — while ARIN's 5.4:1 ratio suggests a higher share of genuinely commercial activity.
What share of total transfers does each RIR represent?
Of 630 total transfers recorded in January, RIPE accounted for 59.7% and ARIN for 40.3%. APNIC, LACNIC, and AFRINIC contributed zero. The transatlantic duopoly continues to define the market's plumbing.
Is IPv6 adoption meaningfully pressuring IPv4 prices yet?
The steady downward trend — prices projected to fall from .70 to .21 over 2026 — is consistent with gradual IPv6 substitution eroding marginal demand. But 88 transactions and nearly a million addresses changing hands in a single month tells you IPv4 is far from obsolete. The transition is a slow bleed, not a cliff.
How long does a typical IPv4 transfer take to complete?
ARIN transfers generally close in 4–8 weeks depending on needs-assessment review. RIPE-to-RIPE transfers are often faster — sometimes 2–4 weeks — since RIPE does not require a demonstrated-need justification. Buyers should factor this timeline into deployment plans.
What drove ARIN's .50 floor price — is that a legitimate market print?
An .50 per-IP transaction is well below median and almost certainly reflects a very large block, legacy encumbrances, or a related-party transfer priced at a discount. We would not use it as a reference point for typical /23 or /24 procurement.
How does the maximum ARIN price compare to the broader tape?
At .00 per IP, this was the month's most expensive transaction — roughly double the ARIN median of .45. Small blocks (/28 or /29), clean reputation histories, and buyer urgency can all push prices to these levels. It is an outlier, not a signal.
If I am budgeting for a /24 purchase today, what should I expect to pay?
At the January median of .95 per IP, a /24 (256 addresses) runs approximately ,363. RIPE blocks will likely price slightly higher around ,376–,486, while ARIN /24s may come in closer to ,235. Add broker and escrow fees of 3–5% and you are looking at a fully-loaded cost near ,500–,700.