15 min read
This report analyzes the IPv4 transfer market for Q3 2025, based on completed IPv4Center marketplace transactions and official RIR transfer records.
Executive Summary
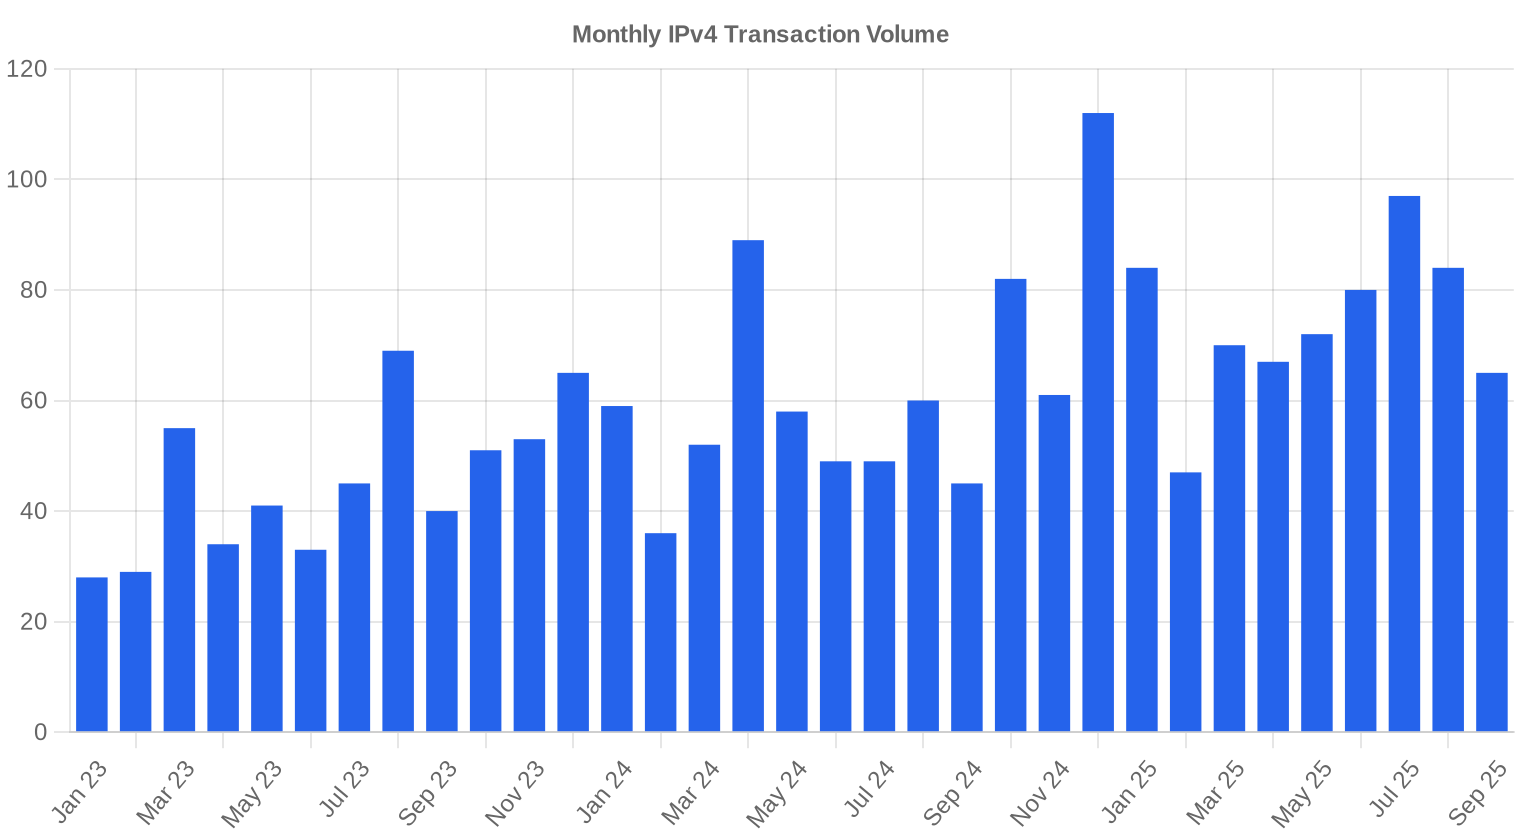
The IPv4 transfer market moved 1,391,360 addresses across 246 transactions in Q3 2025, generating $25.3 million in aggregate deal value. The average price per IP fell to $26.33 — down 9.3% from Q2 2025 and a striking 20.7% below Q3 2024's levels. Median pricing held slightly firmer at $27.00, suggesting a longer tail of discounted bulk deals pulling the average down. Transaction volume rose 12.3% from the prior quarter, indicating that buyers are stepping in at lower price points but not at levels that stabilize the market. The trend remains unambiguously downward, with the pricing regression line pointing to further erosion through year-end.Market Overview
| Transactions | 246 |
| IP Addresses Traded | 1,391,360 |
| Estimated Market Value | $25,327,061 |
| Average Price / IP | $26.33 |
| Median Price / IP | $27.00 |
| RIR Transfers | 2,192 |
Year-over-Year Comparison
| Metric | This period | A year earlier (Q3 2024) | Change |
|---|---|---|---|
| Transactions | 246 | 154 | +59.7% |
| IP Addresses Traded | 1,391,360 | 338,944 | +310.5% |
| Estimated Market Value | $25,327,061 | $11,232,892 | +125.5% |
| Average Price / IP | $26.33 | $33.22 | -20.7% |
| RIR Transfers | 2,192 | 2,279 | -3.8% |
Price Dynamics
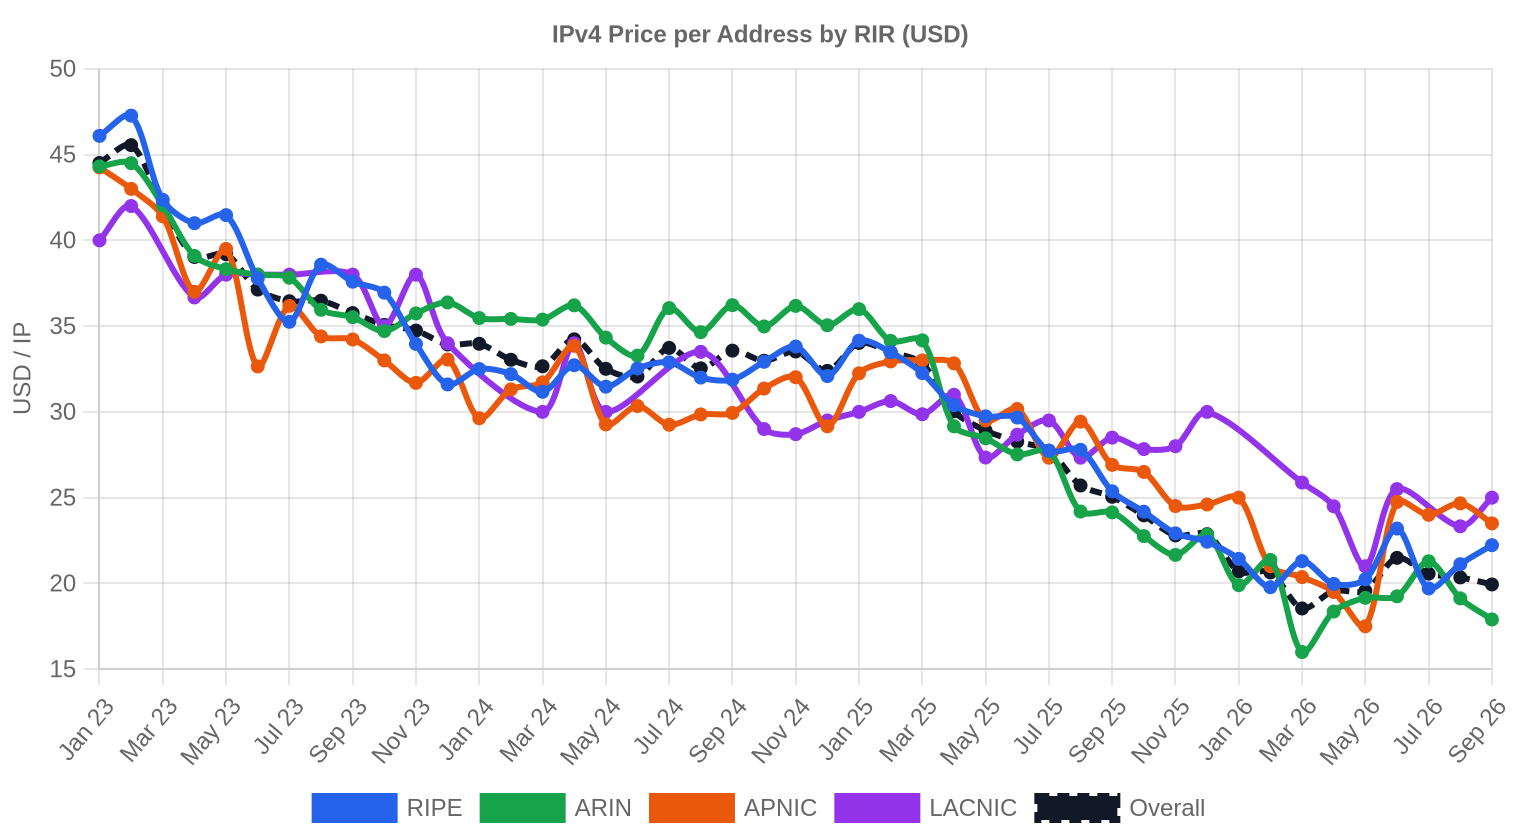
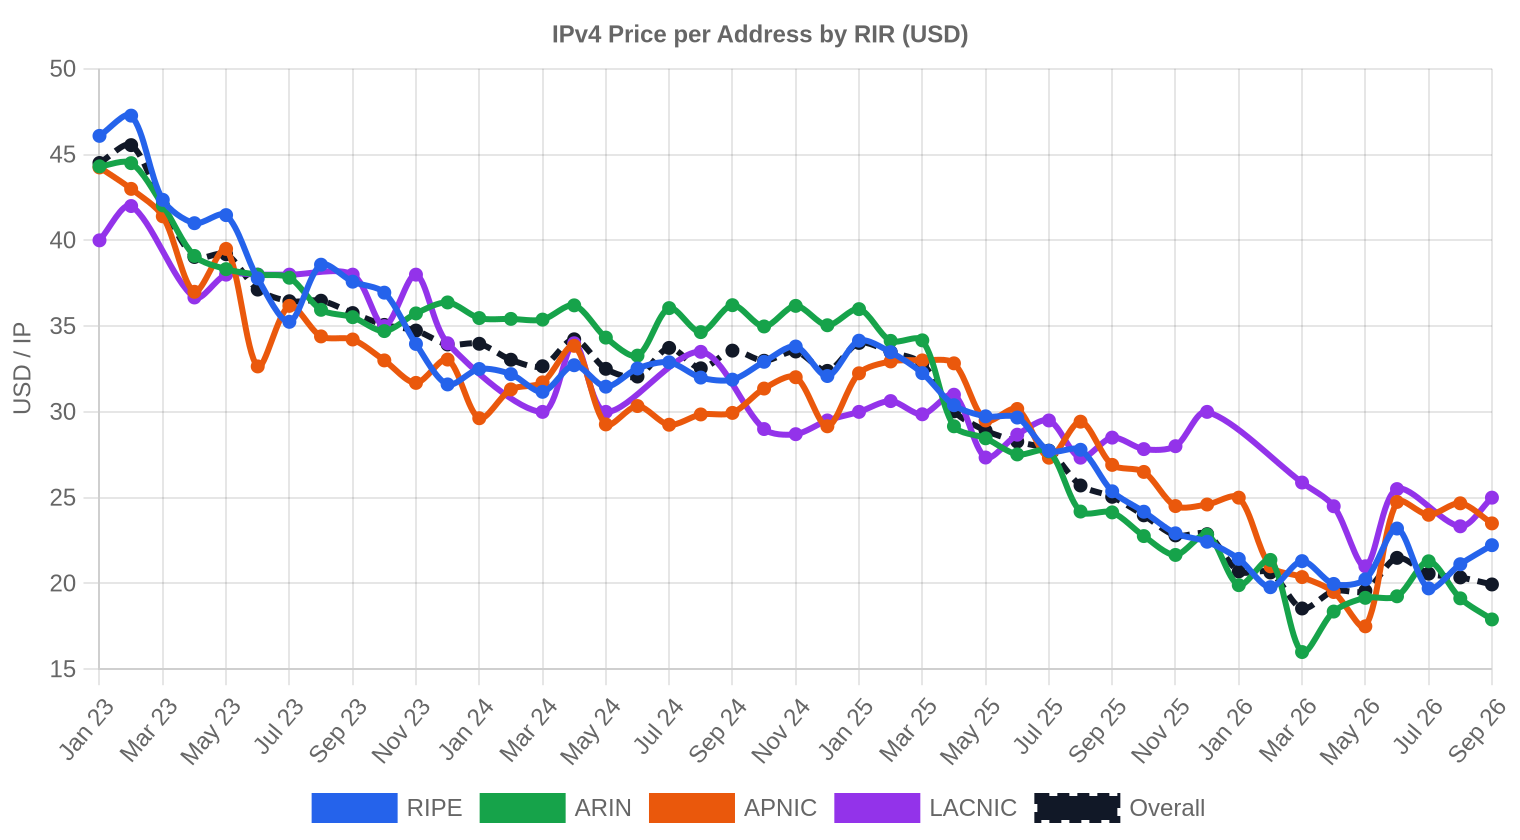
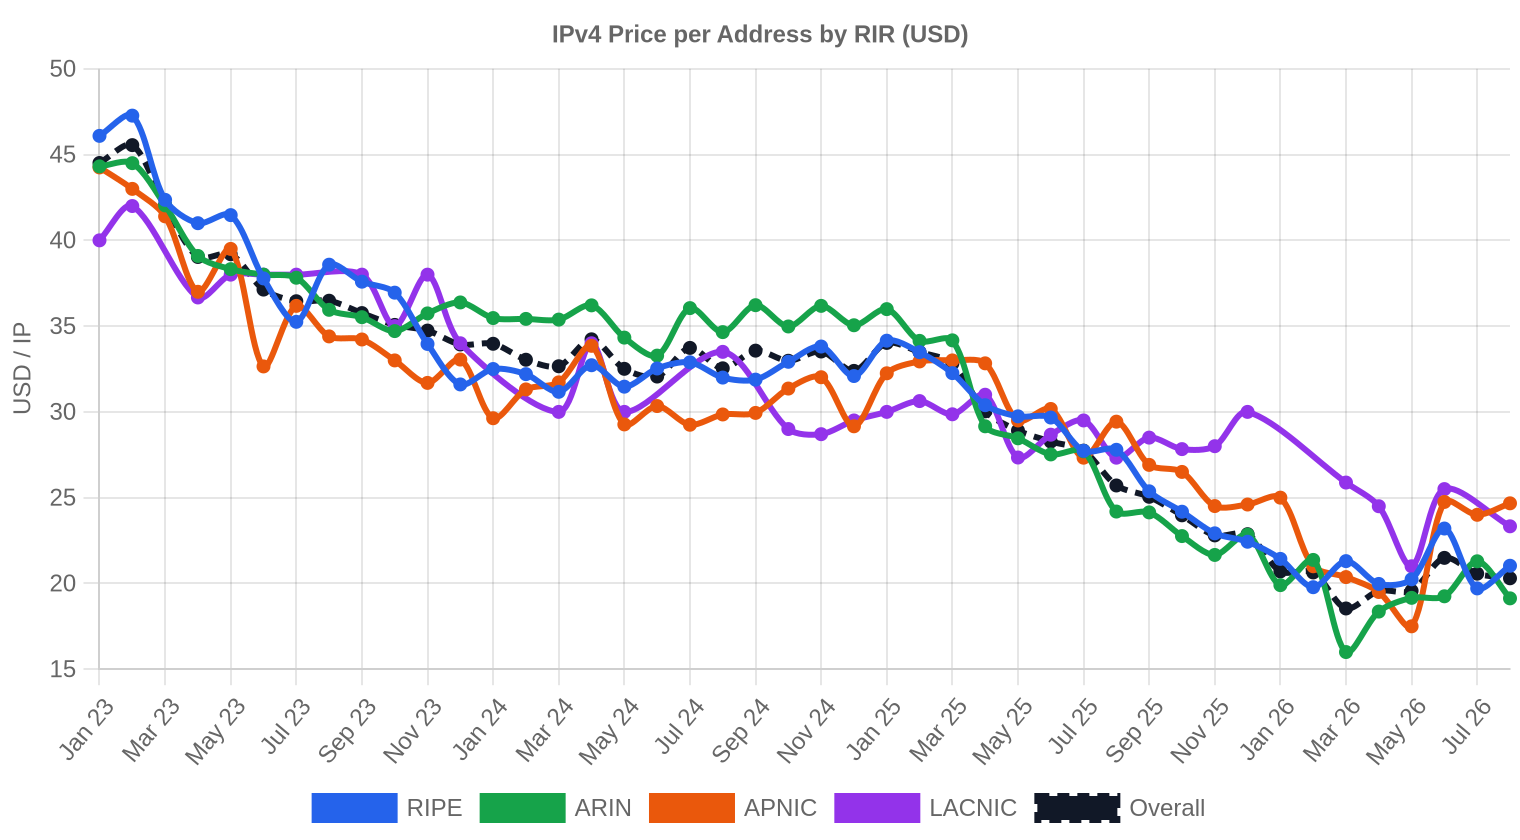
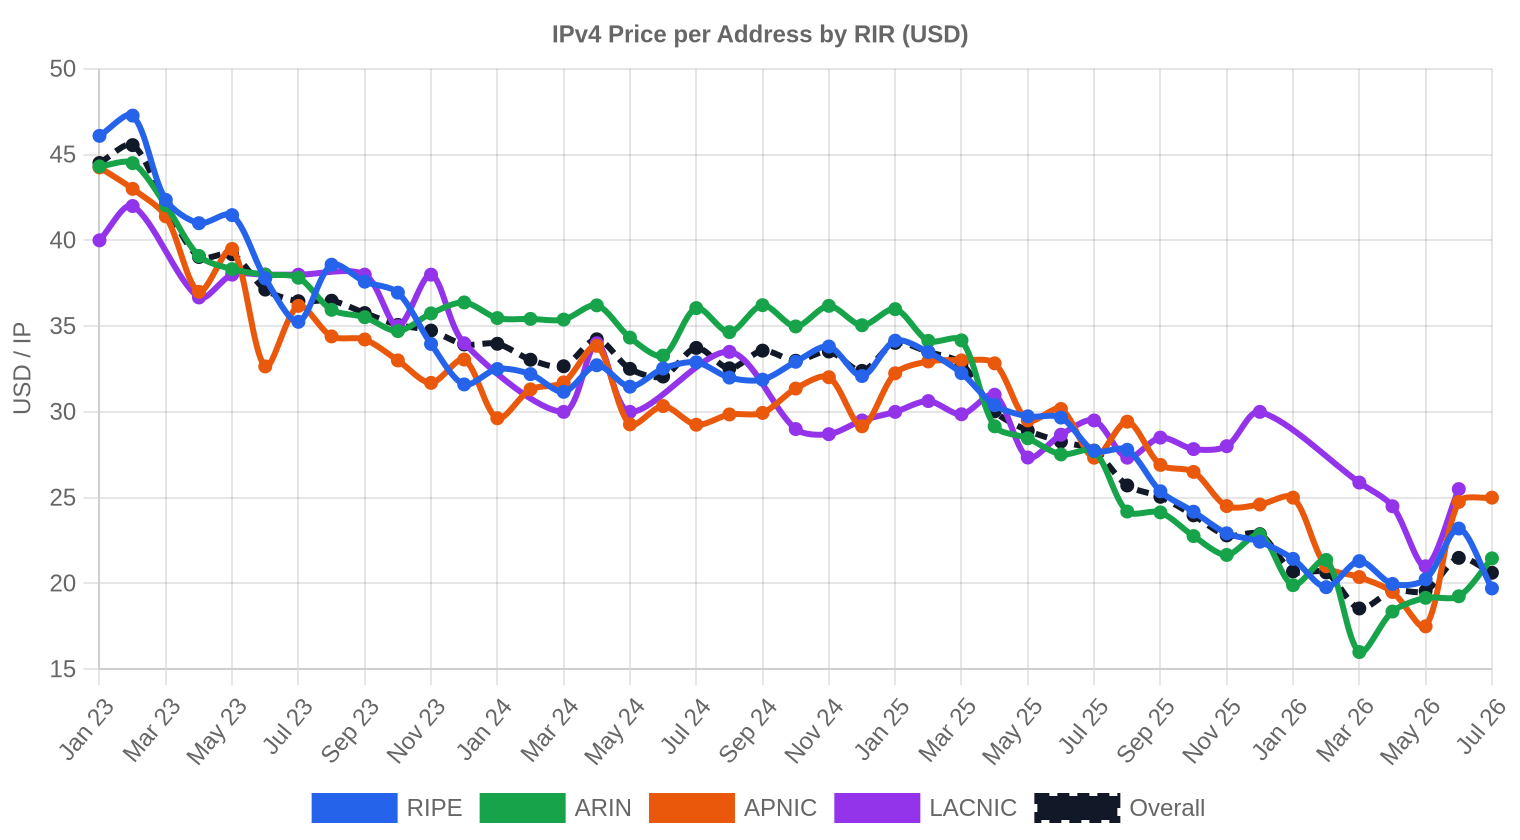
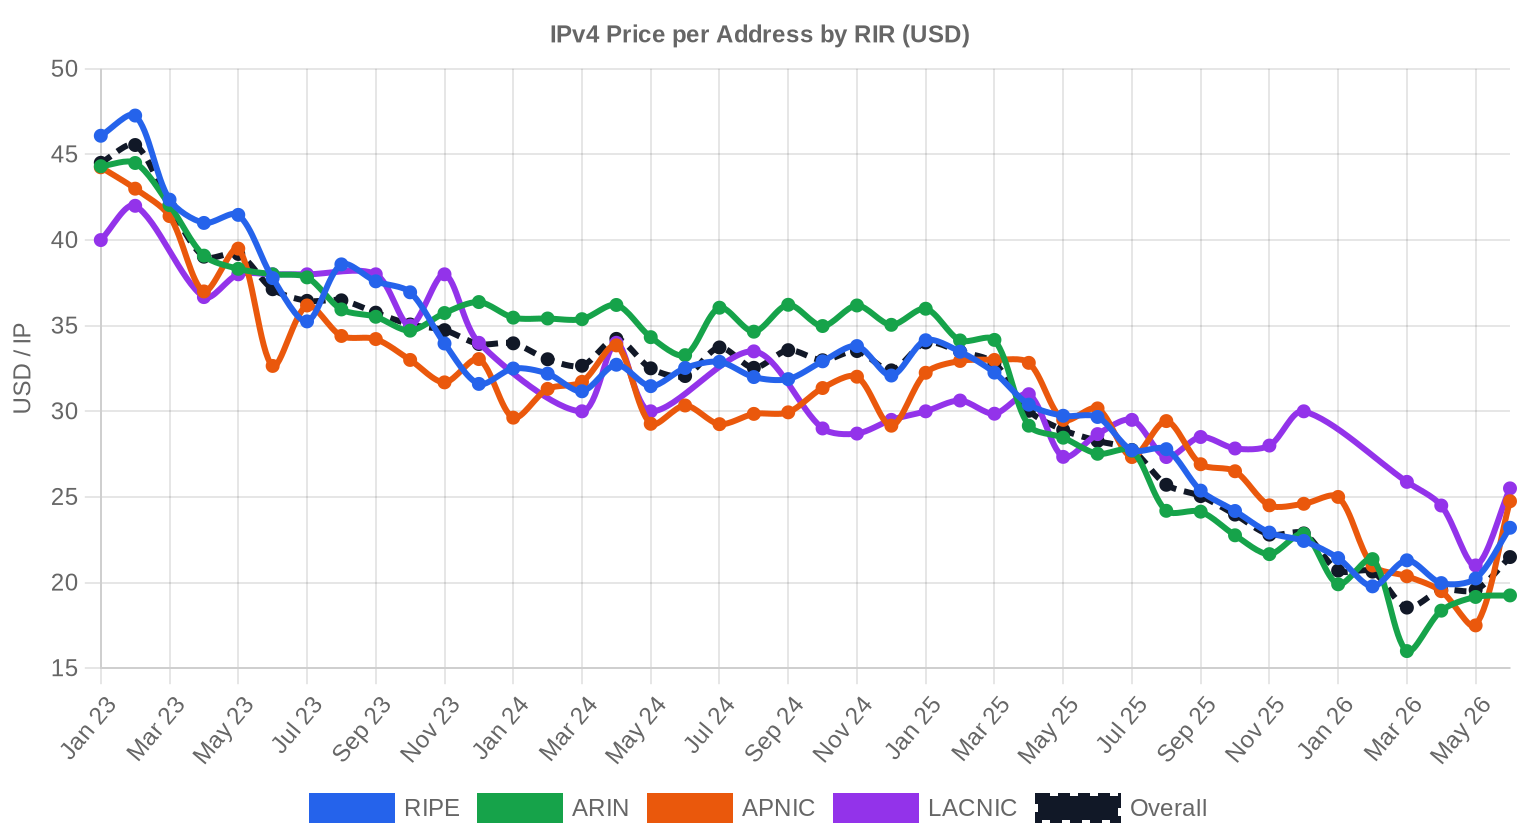
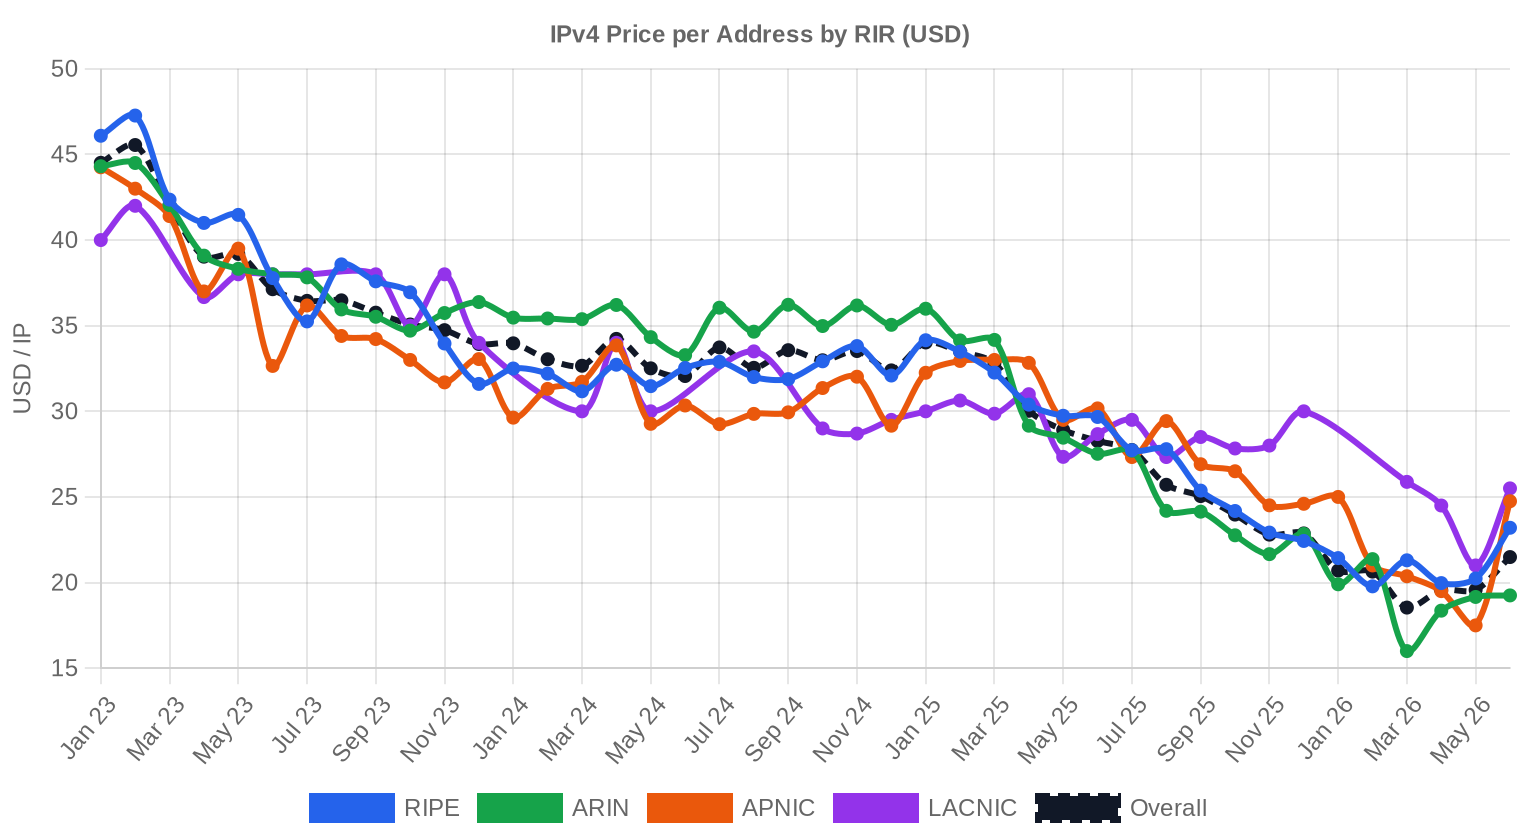
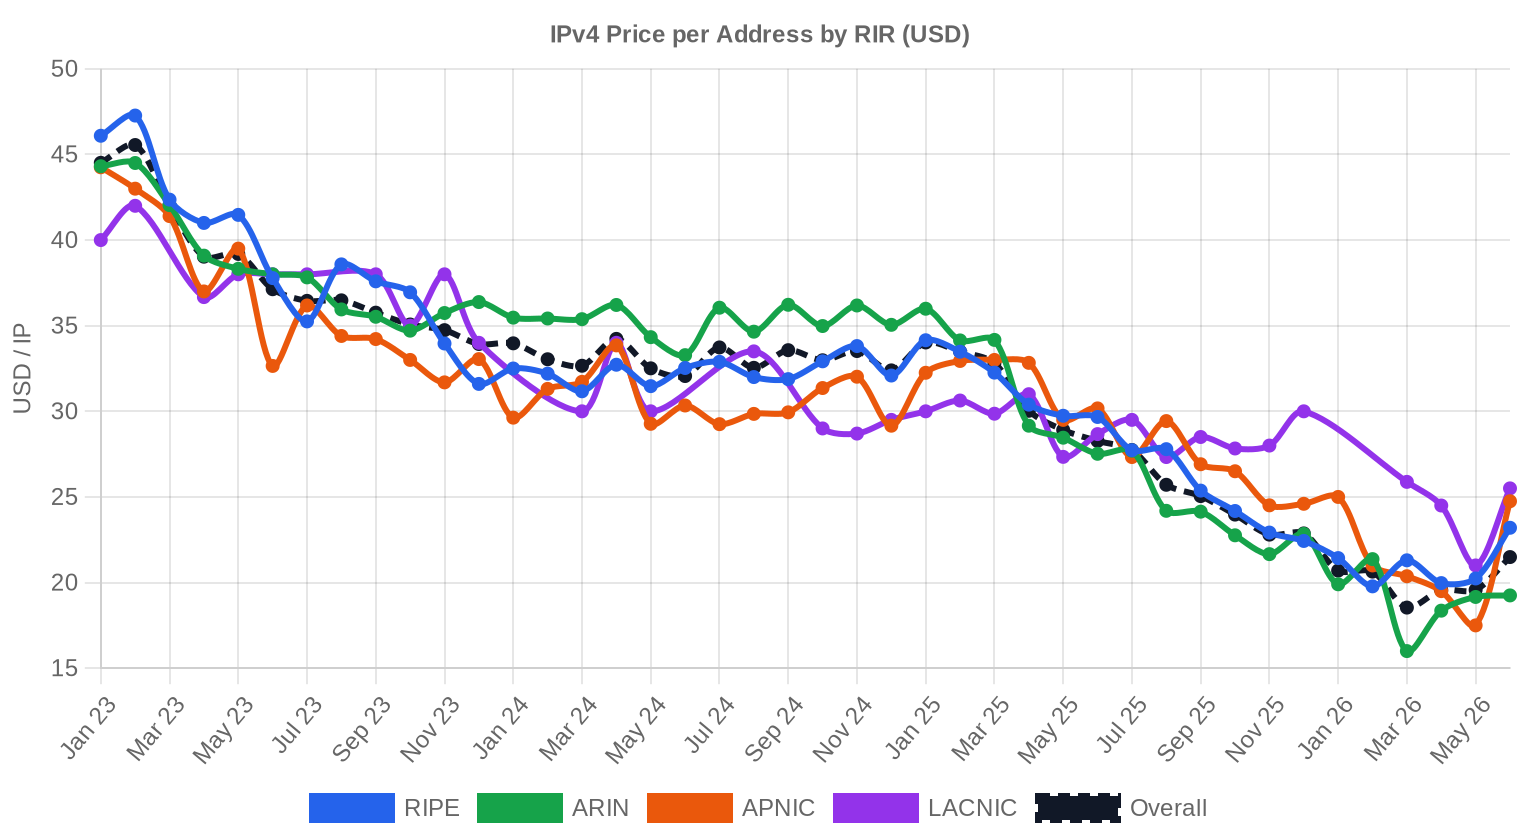
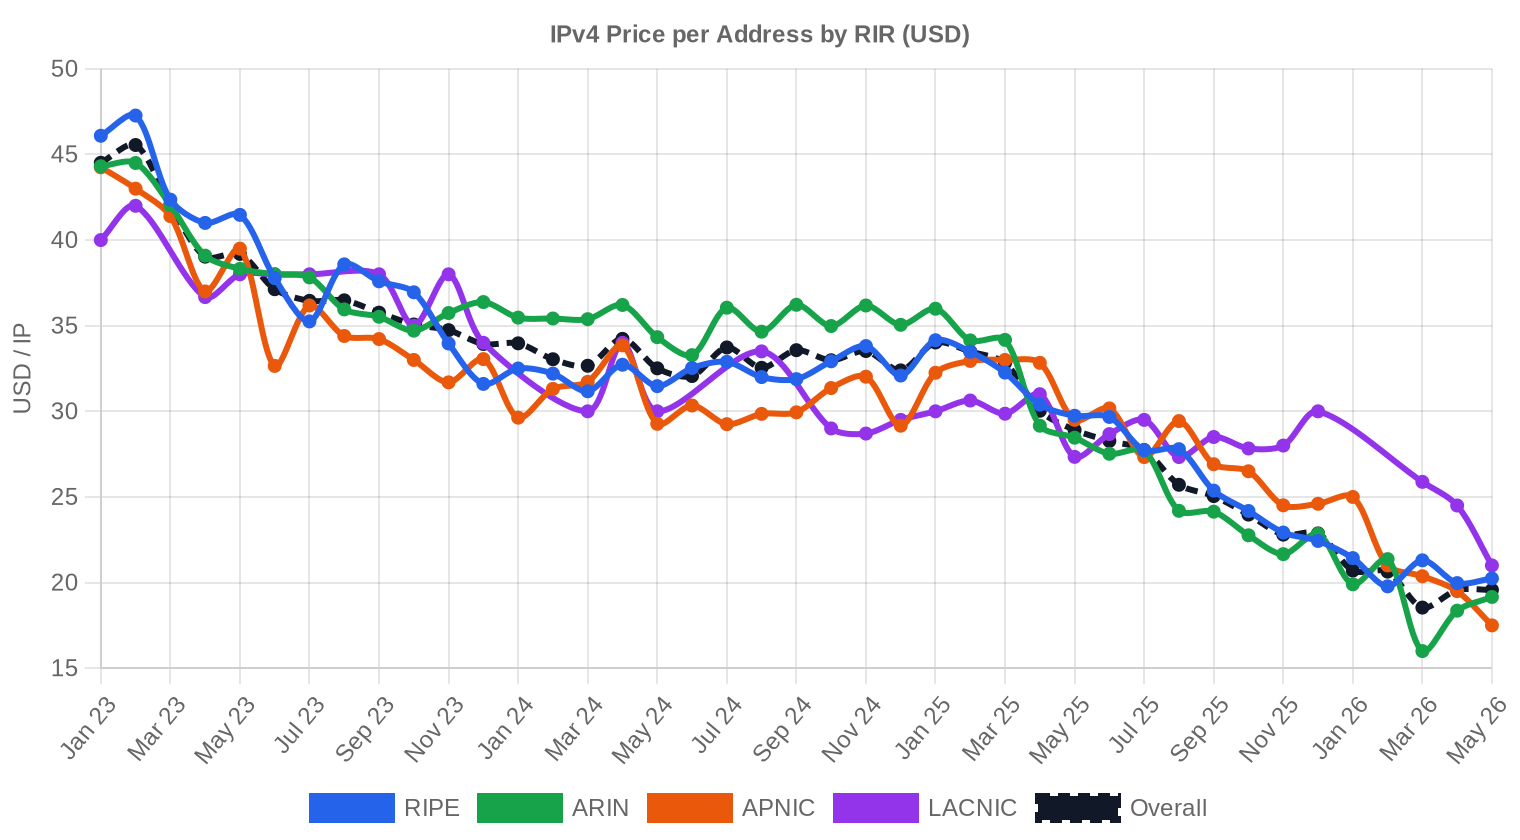
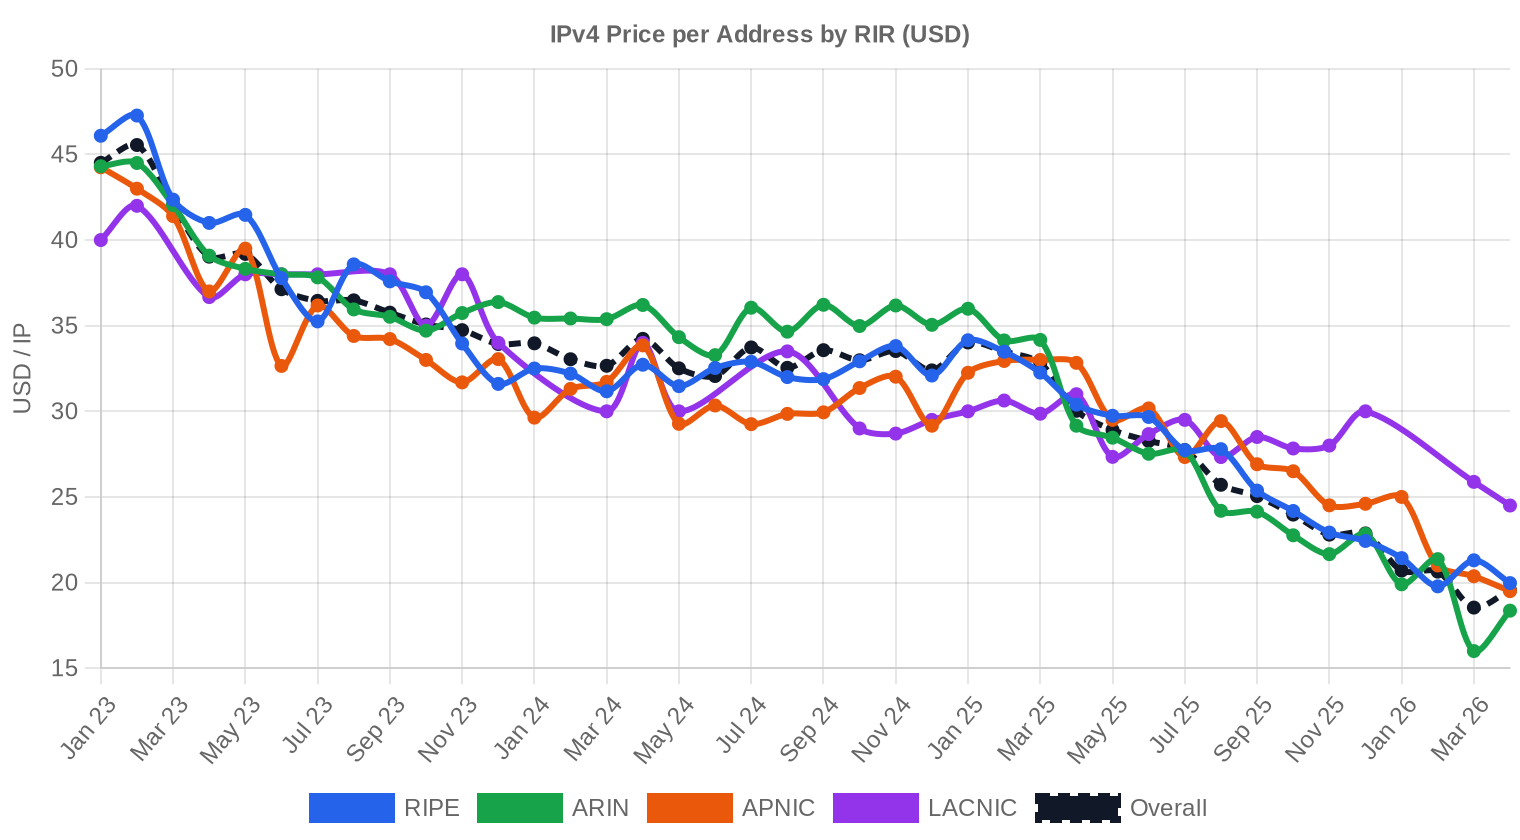
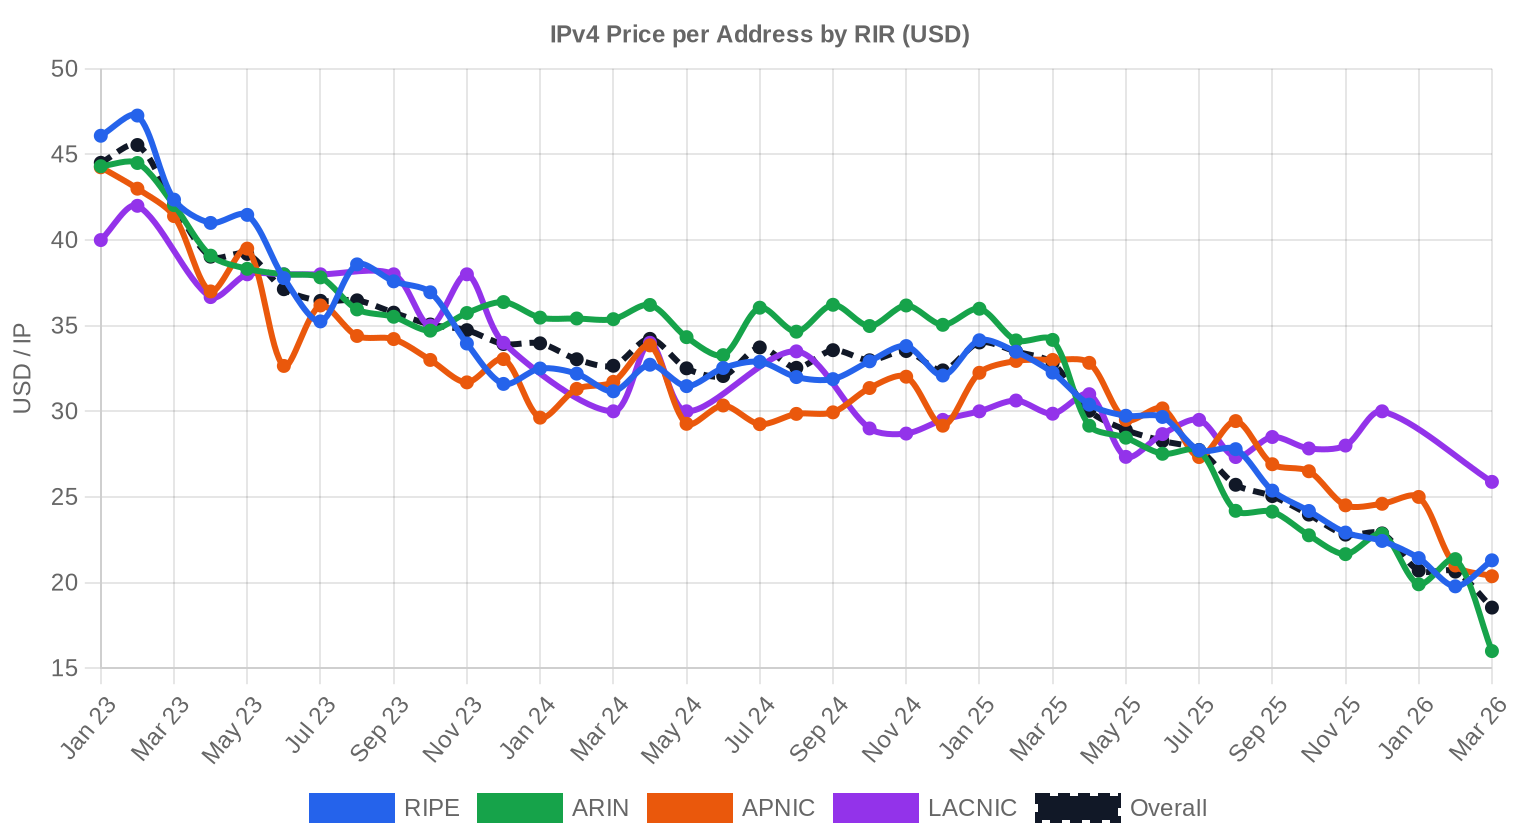
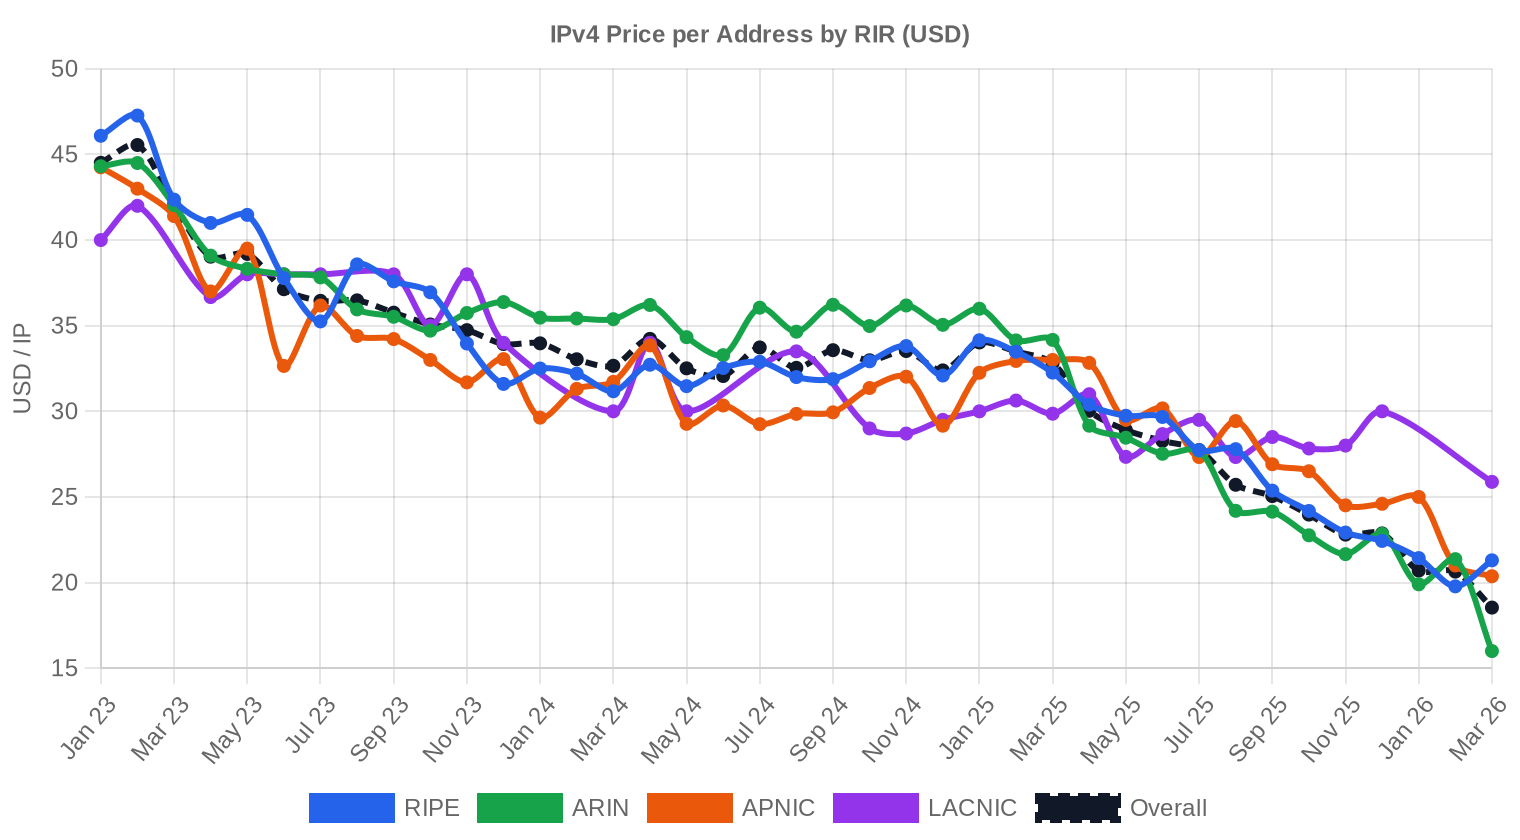
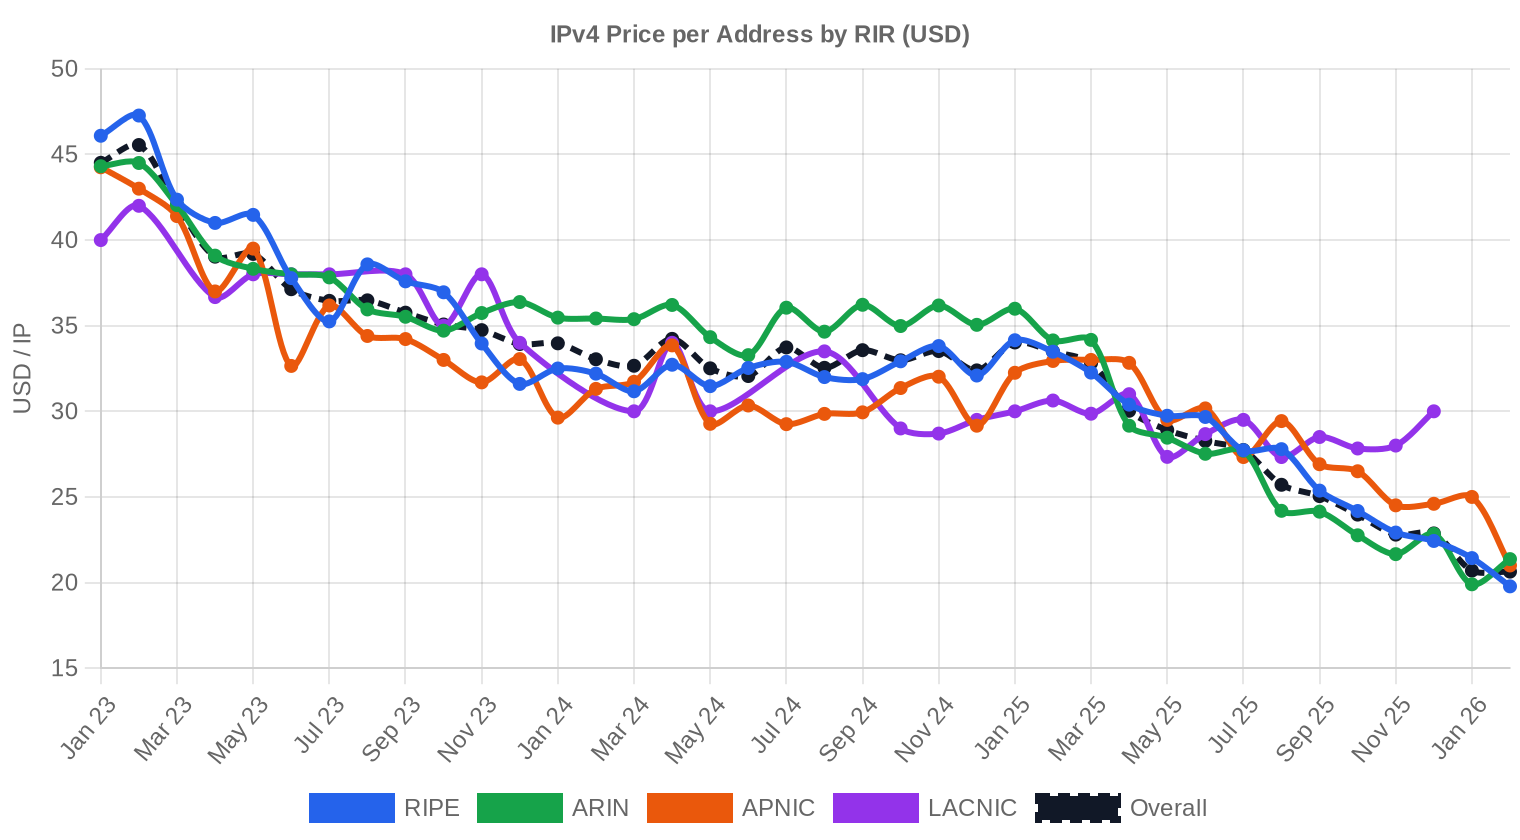
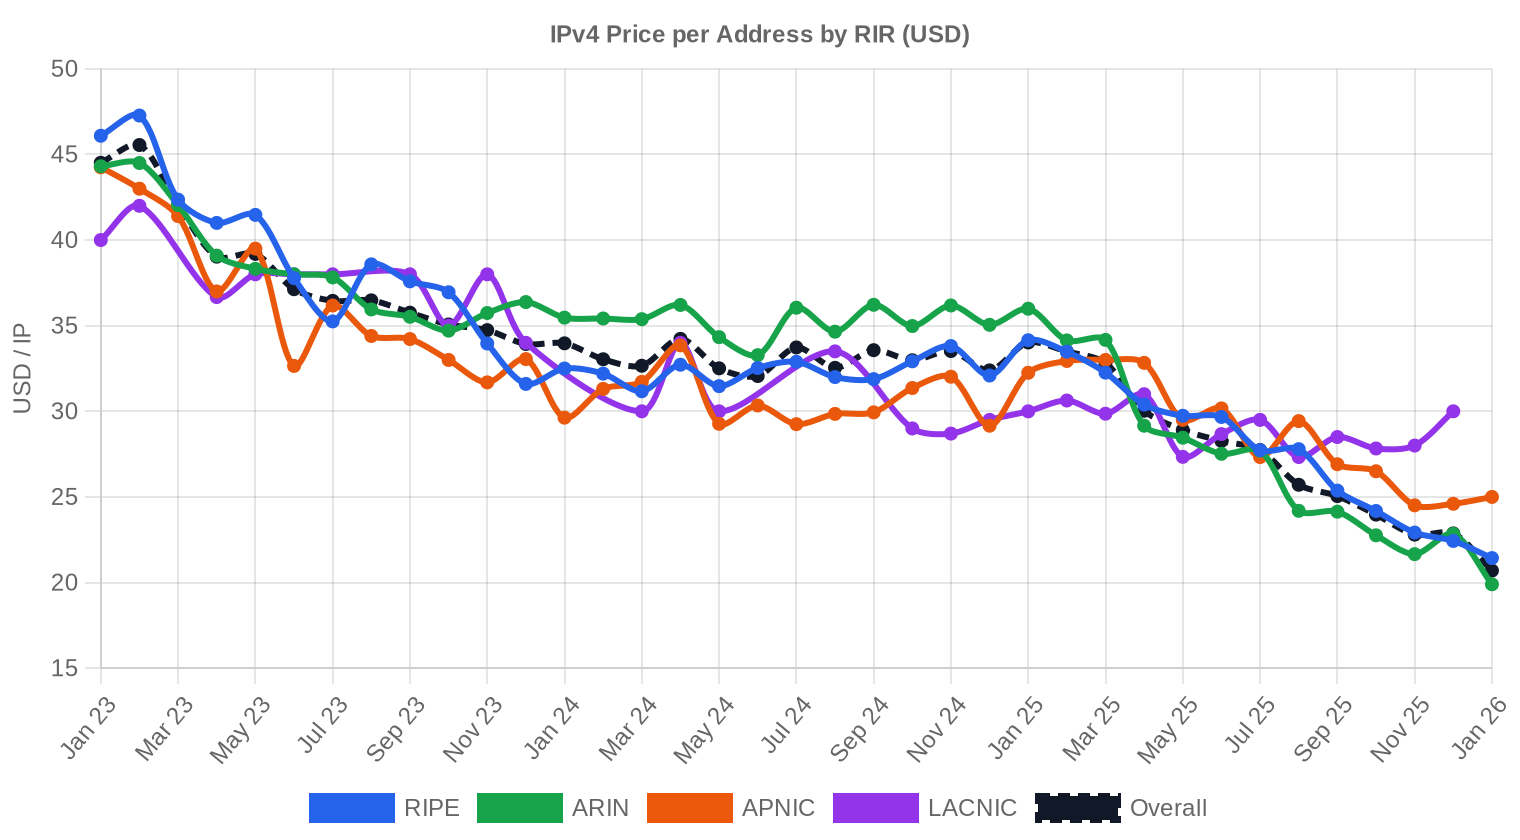
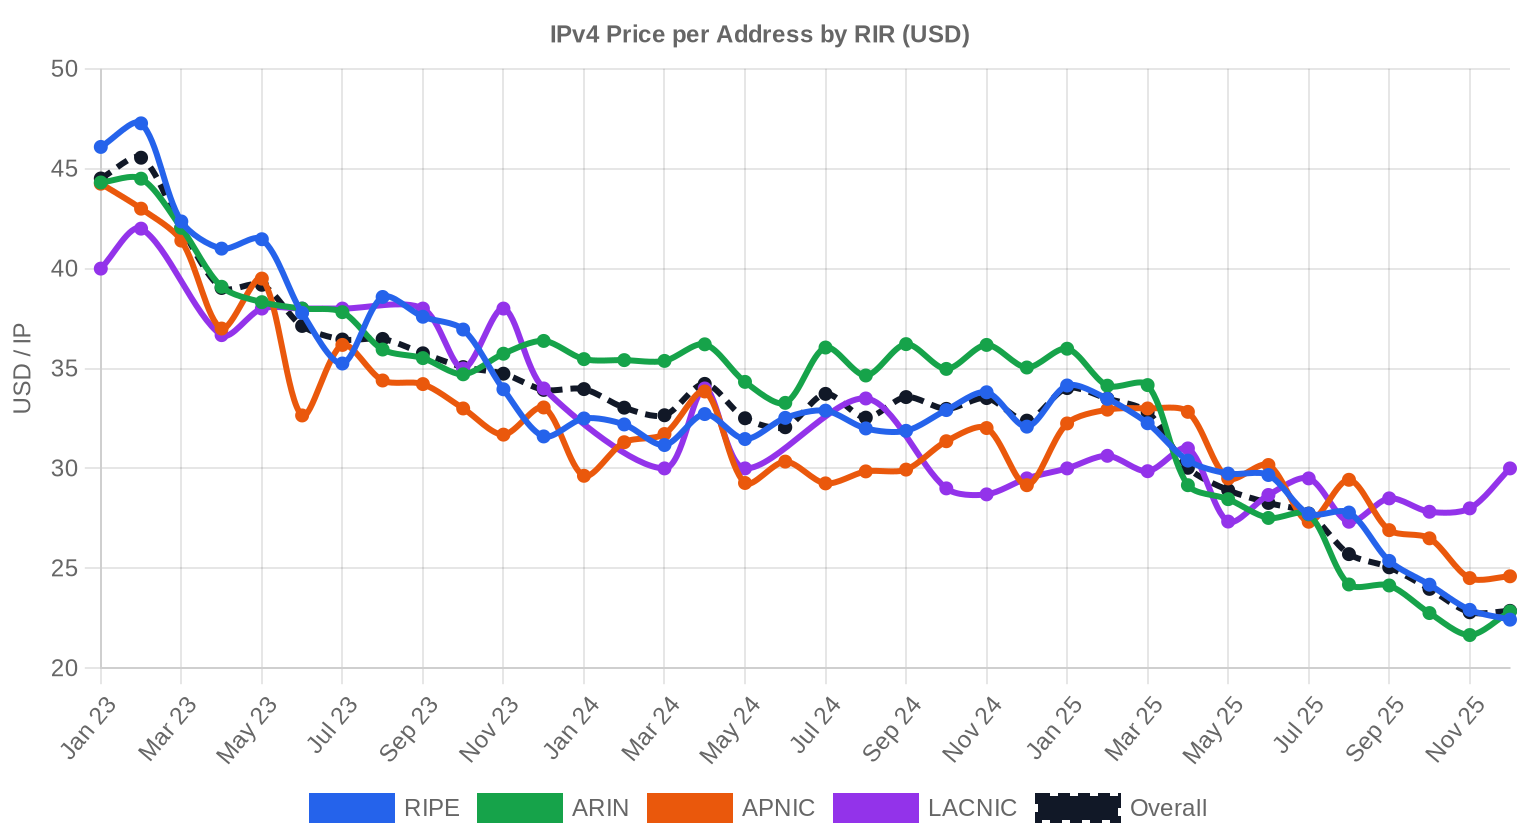
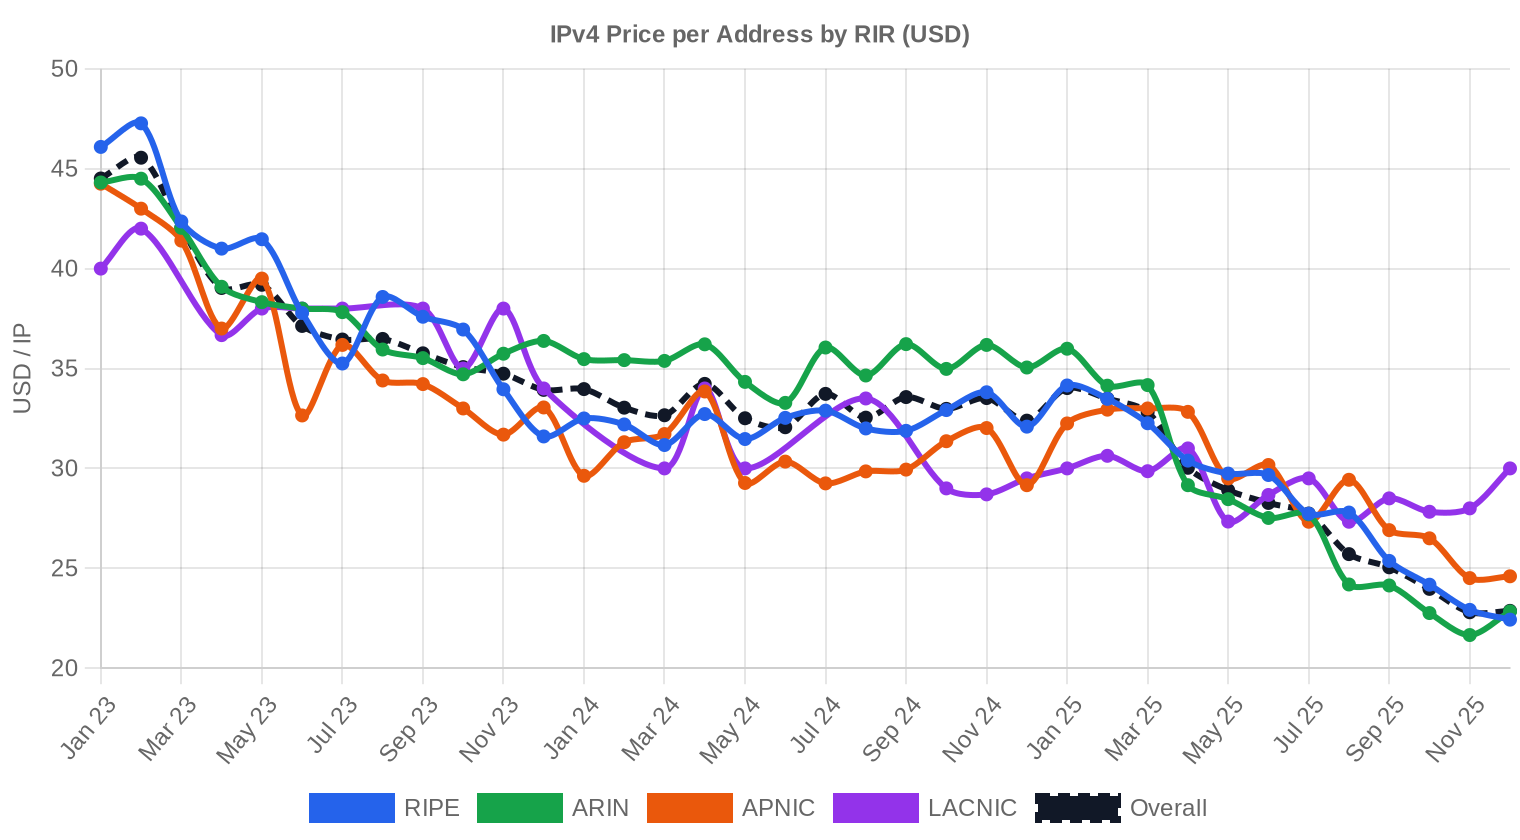
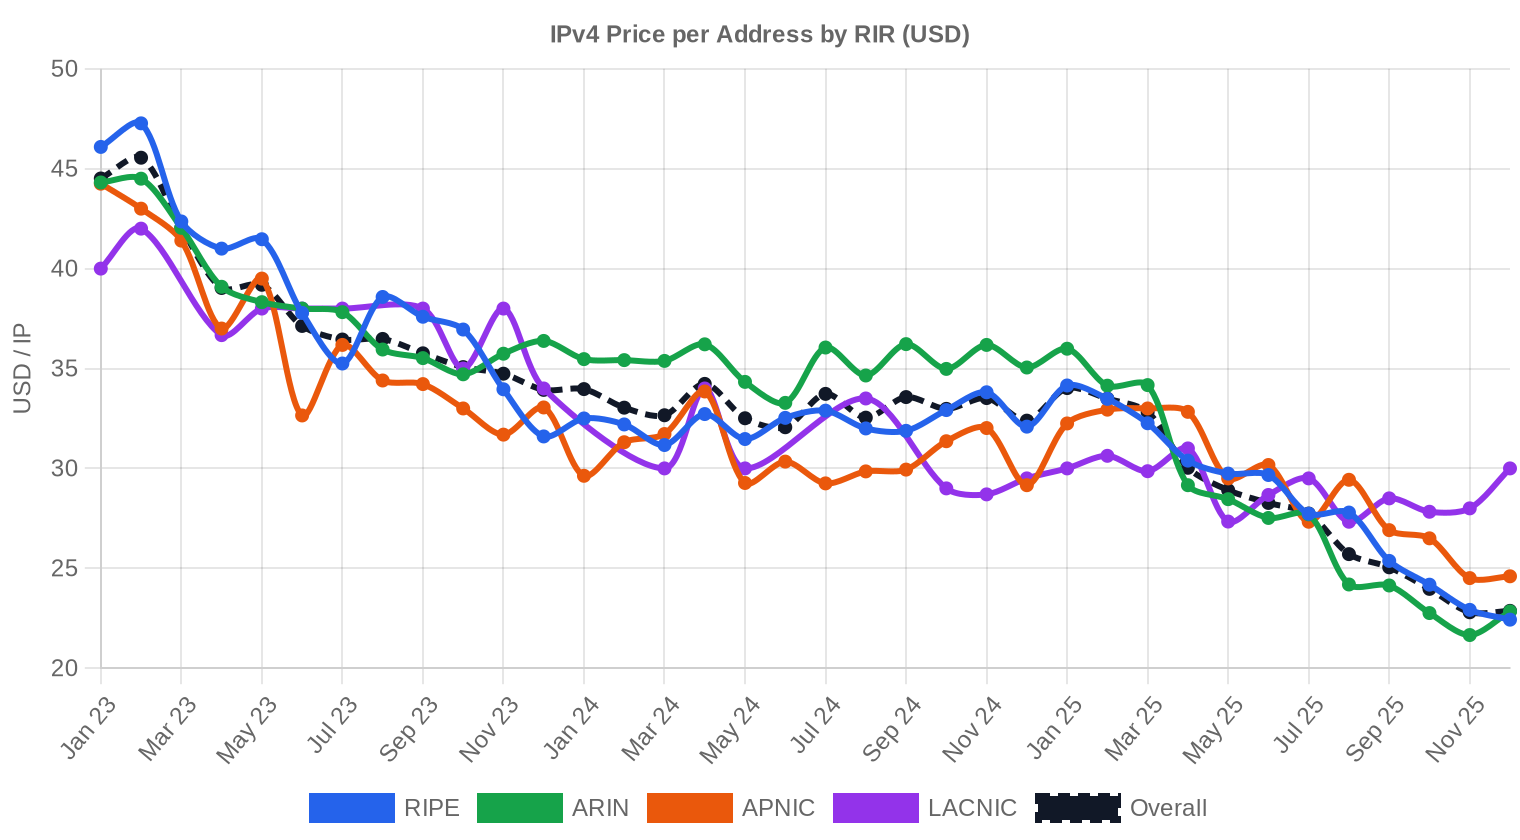
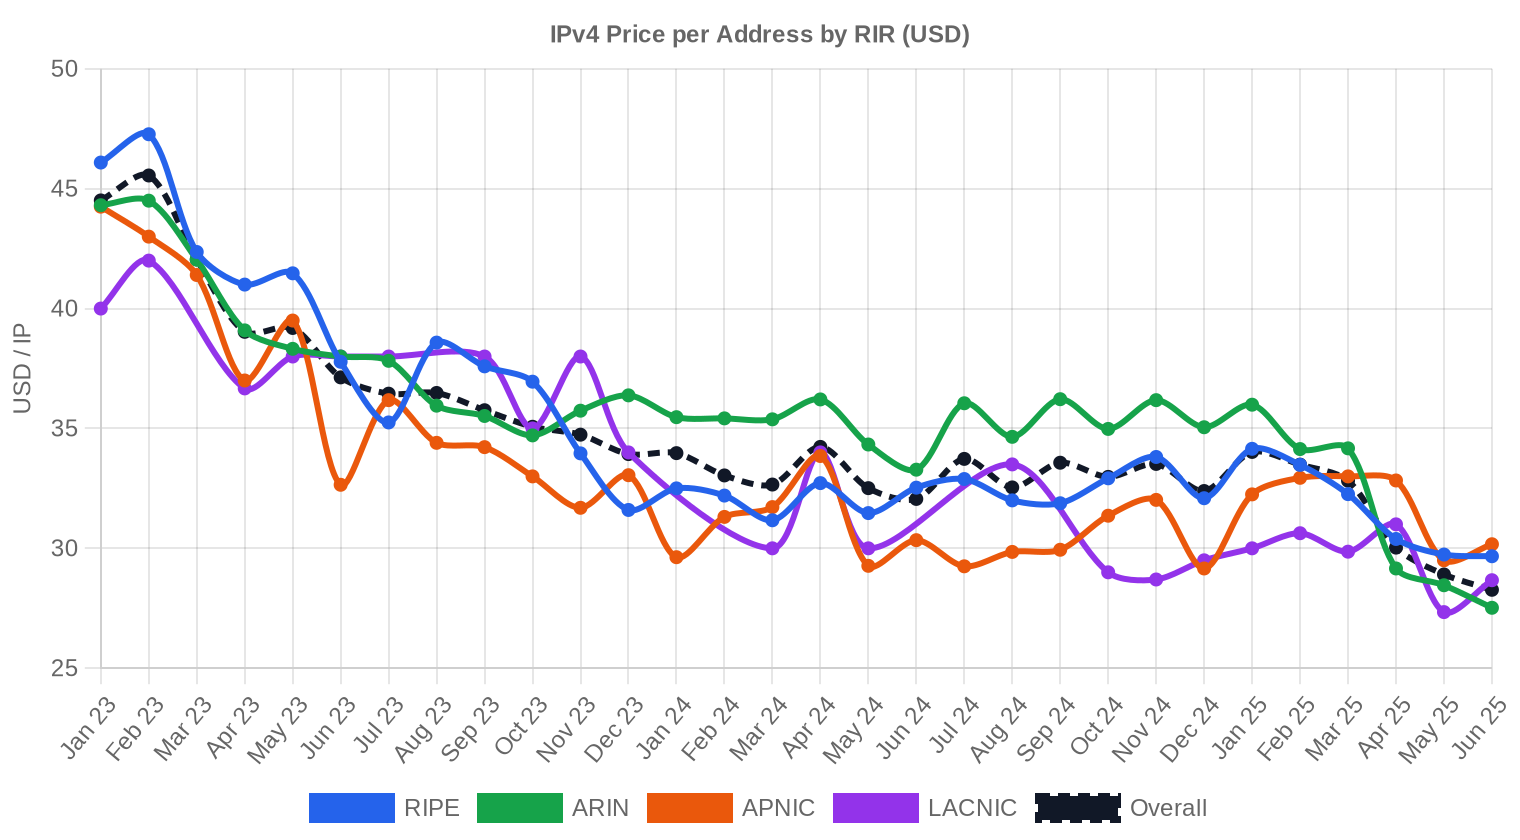
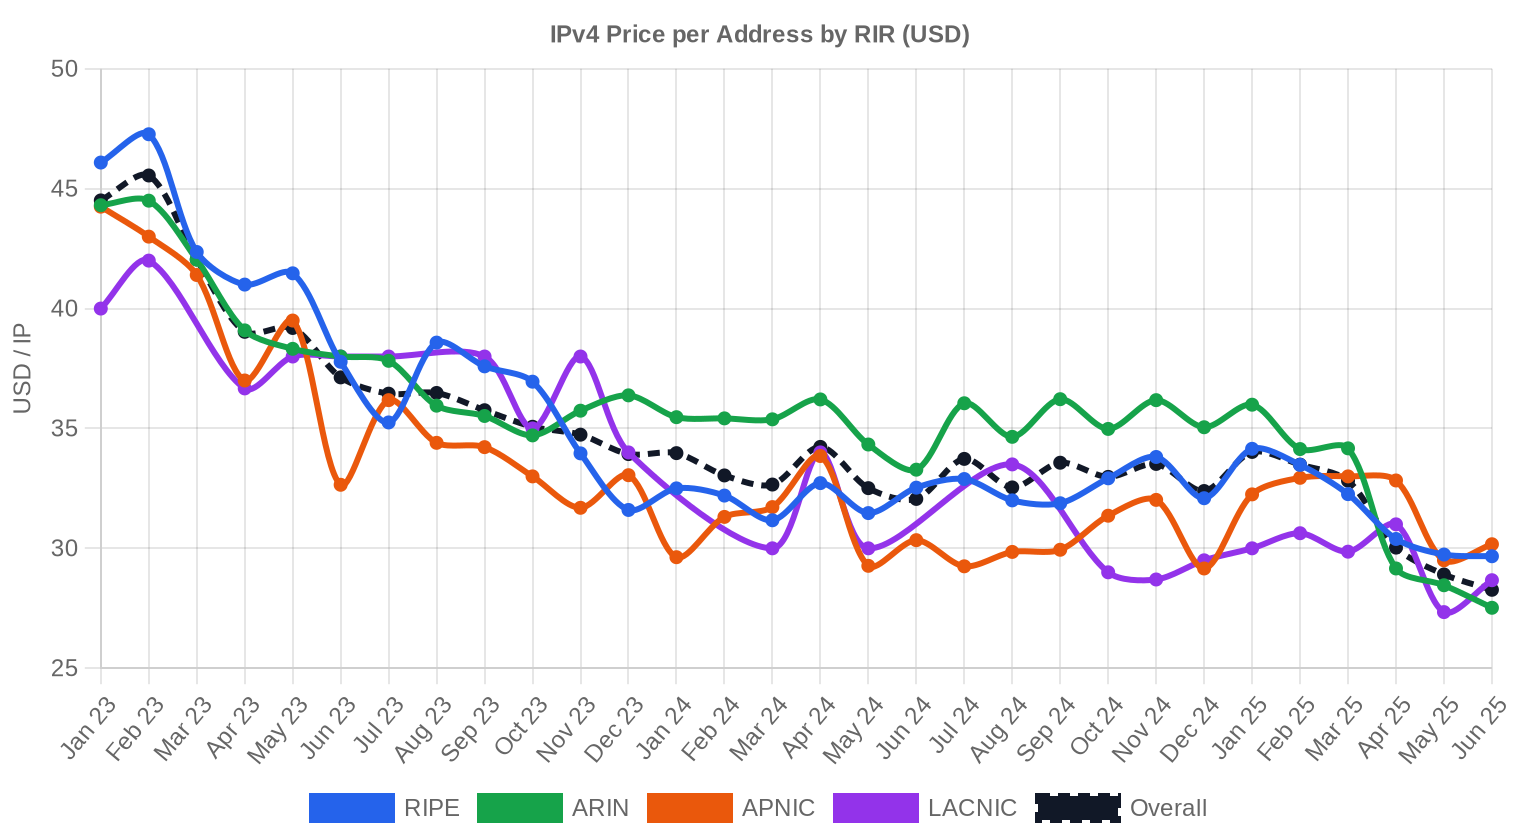
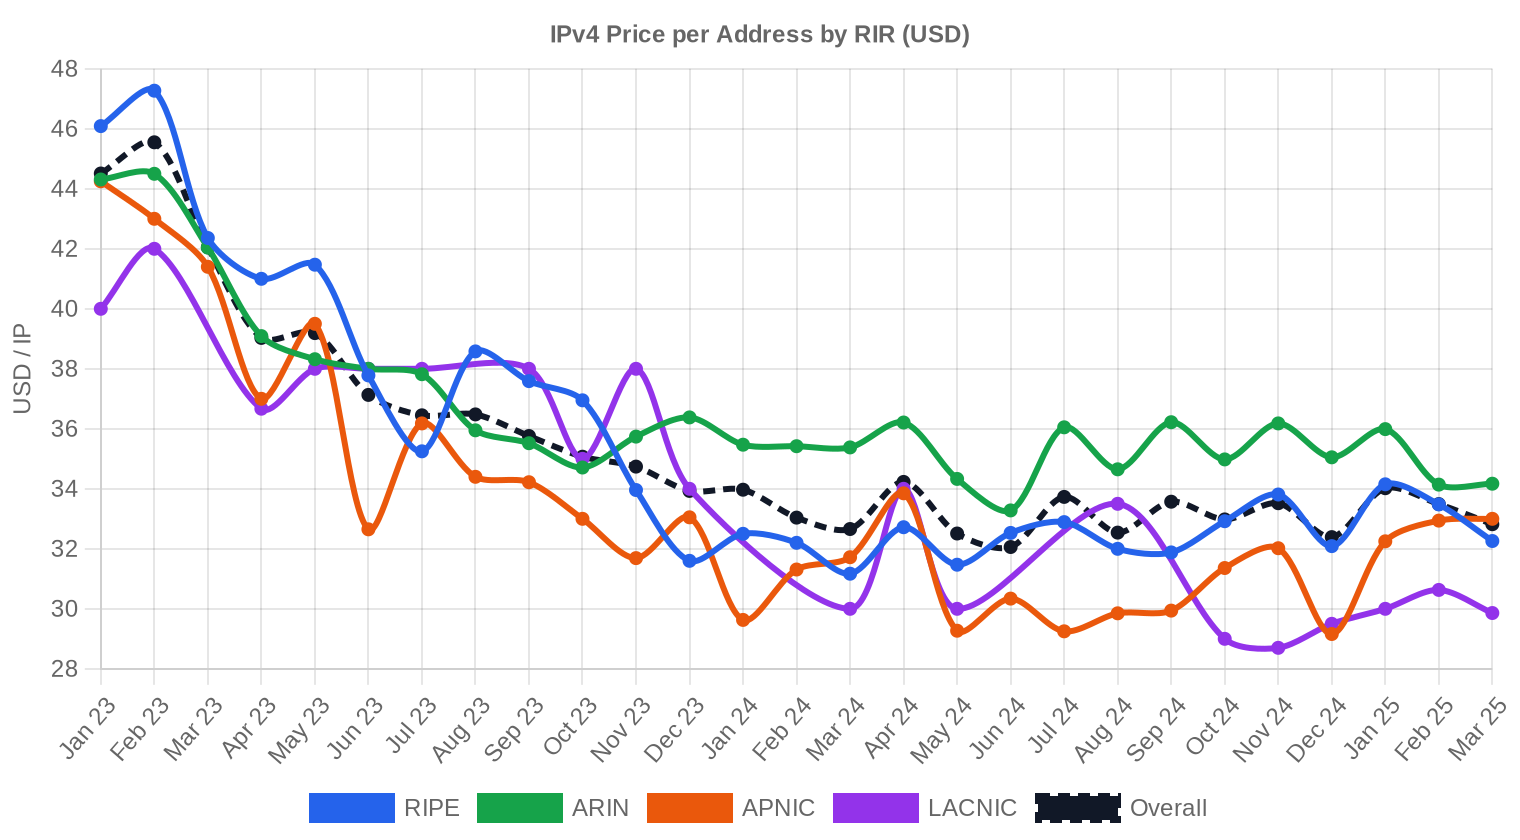
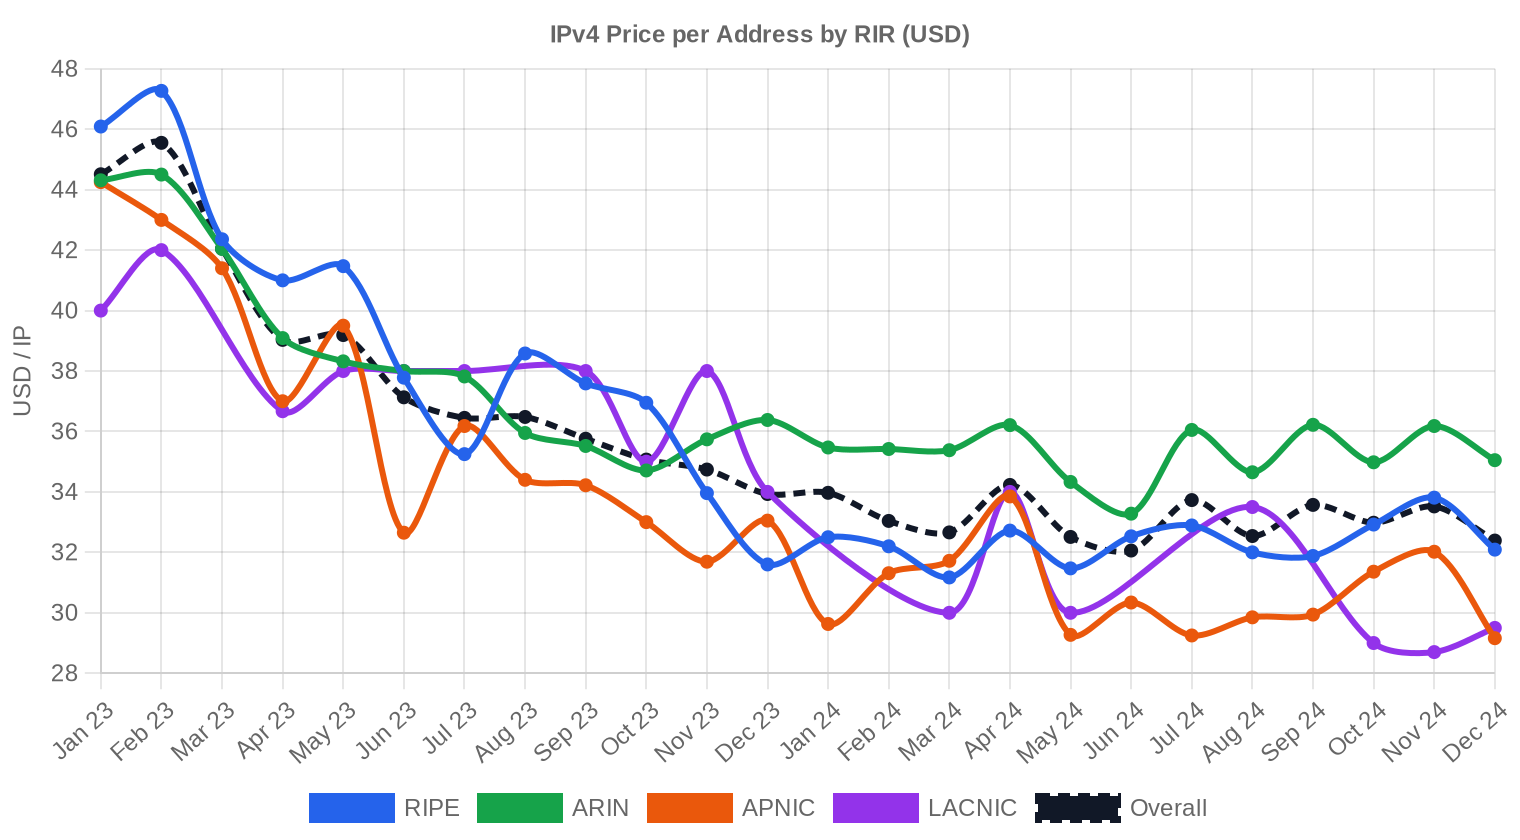
The range this quarter ran from $14/IP at the floor to $45/IP at the top — a $31 spread that reflects the wild heterogeneity in block quality, size, and registry jurisdiction. That $14 floor likely represents large ARIN blocks with reputation baggage or transfer encumbrances; the $45 ceiling is almost certainly a small, clean /24 sold in a thin market pocket. The 9.3% quarter-over-quarter decline from Q2 2025 accelerated the trajectory that's been building since mid-2024, and the 20.7% year-over-year drop is the largest annual decline we've tracked in recent memory. Median pricing at $27 versus the $26.33 average tells us bulk transactions are clearing at discounts deep enough to drag the weighted figure. Buyers have pricing power for the first time in years, and sellers who anchor to 2023-era expectations are sitting on stale listings.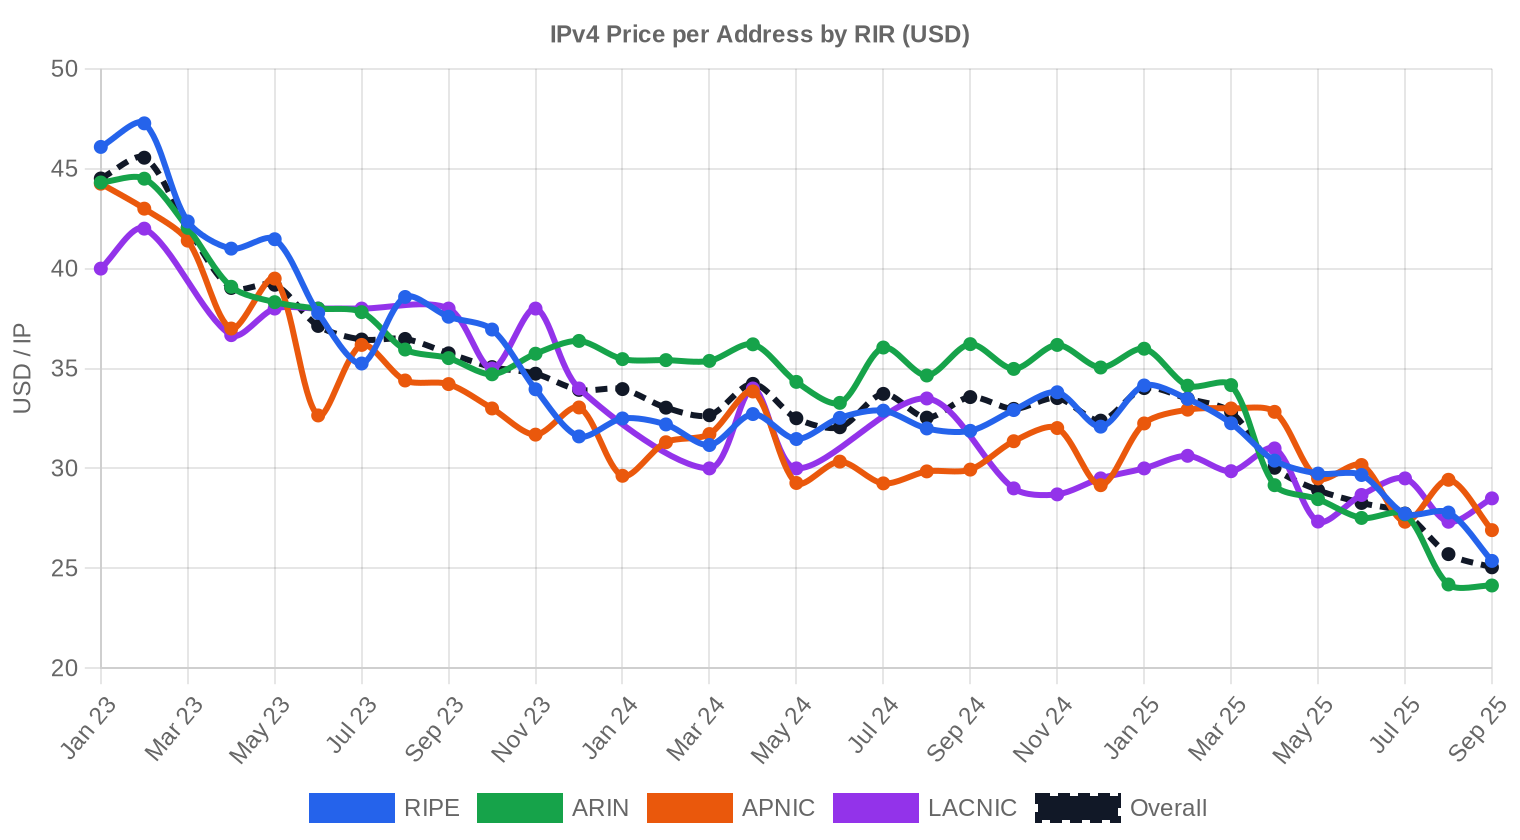
Pricing by RIR
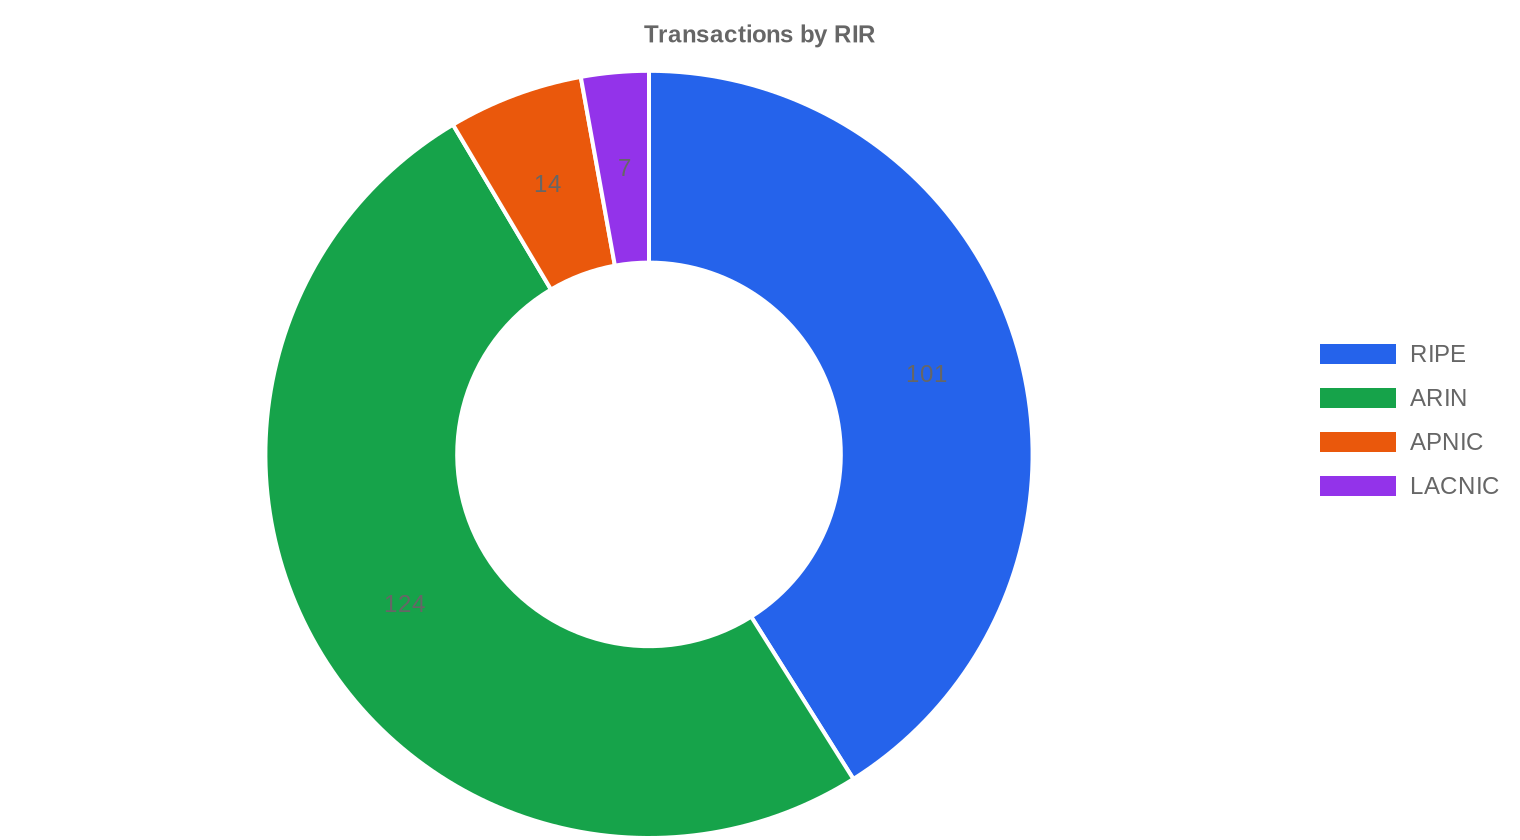
ARIN dominated volume as usual, accounting for 50.4% of total IPs traded, but its average of $25.39/IP makes it the cheapest major registry this quarter. RIPE blocks fetched $27.16 on average — a $1.77 premium per IP that has compressed significantly from the $4–6 gap we saw a year ago. LACNIC commanded the highest per-IP price at $28.29, though on just seven transactions totaling 4,608 addresses — thin enough that a single deal can swing the average. APNIC came in at $27.72 across 14 deals, a registry that rarely generates volume but consistently prices above ARIN. AFRINIC recorded zero transactions, which at this point is a multi-quarter pattern reflecting the ongoing governance uncertainty and buyer reluctance.ARIN: $25.39/IP across 124 transactions (76.5% of volume)
RIPE: $27.16/IP across 101 transactions (22.3% of volume)
APNIC: $27.72/IP across 14 transactions (0.8% of volume)
LACNIC: $28.29/IP across 7 transactions (0.3% of volume)
AFRINIC: No recorded transactions
| RIR | Transactions | Avg $/IP | Median $/IP | IPs Traded | RIR Transfers | Next Month (proj.) | Year-End (proj.) |
|---|---|---|---|---|---|---|---|
| RIPE | 101 | $27.16 | $27.50 | 310,784 | 1,360 | $27.00 | $26.00 |
| ARIN | 124 | $25.39 | $25.00 | 1,064,704 | 832 | $24.50 | $24.00 |
| APNIC | 14 | $27.72 | $28.35 | 11,264 | 0 | $26.00 | $25.00 |
| LACNIC | 7 | $28.29 | $28.00 | 4,608 | 0 | $28.00 | $27.50 |
Transaction Volume
Supply & Block Sizes
/24 blocks dominated with 85 transactions — roughly one-third of all deals. This is the market's most liquid denomination: small enough for a single enterprise deployment, large enough to be routable everywhere without aggregation headaches. The concentration in /24s also reflects the demand profile — mid-market buyers who need a subnet or two, not carriers filling out allocation tables.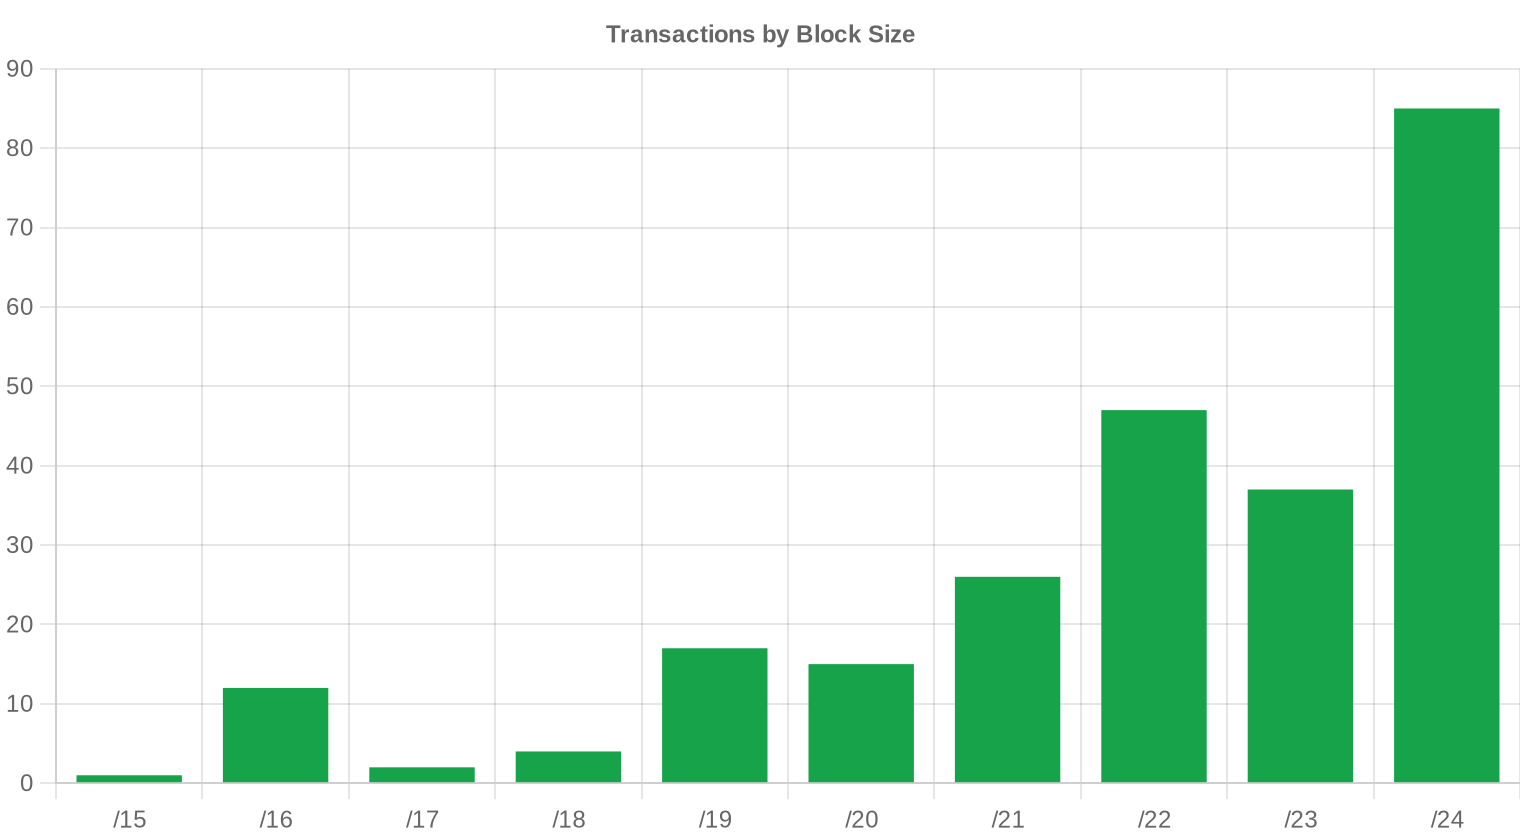
Geographic Activity
Country-level distribution data was not captured at sufficient granularity this quarter. Anecdotally, ARIN's 50.4% IP volume share and RIPE's 101 transactions suggest the US and Western Europe remain the primary theaters. The near-total absence of AFRINIC and the thin LACNIC pipeline point to demand concentration in mature markets with established transfer ecosystems.Registry Transfer Activity
RIR-recorded transfers totaled 2,192 in Q3 2025. RIPE led with 1,360 registered transfers — 62% of the total — reflecting both the depth of the European market and RIPE's comparatively streamlined transfer process. ARIN logged 832 transfers, consistent with its typical quarterly run rate.Long-Run Transfer Trends
Over the 33 months we've tracked, cumulative RIR-recorded transfers have reached 27,419. The peak month was December 2024, when year-end tax and budget considerations drove a burst of closing activity — a seasonal pattern we've observed consistently. RIPE accounts for 58.7% of all historical transfers versus ARIN's 41.3%, a split that reflects RIPE's more fragmented seller base and higher deal count at smaller block sizes.| RIR | RIR Transfers |
|---|---|
| RIPE | 16,091 |
| ARIN | 11,328 |
| RIR Transfers | 27,419 |

Outlook & Forecast
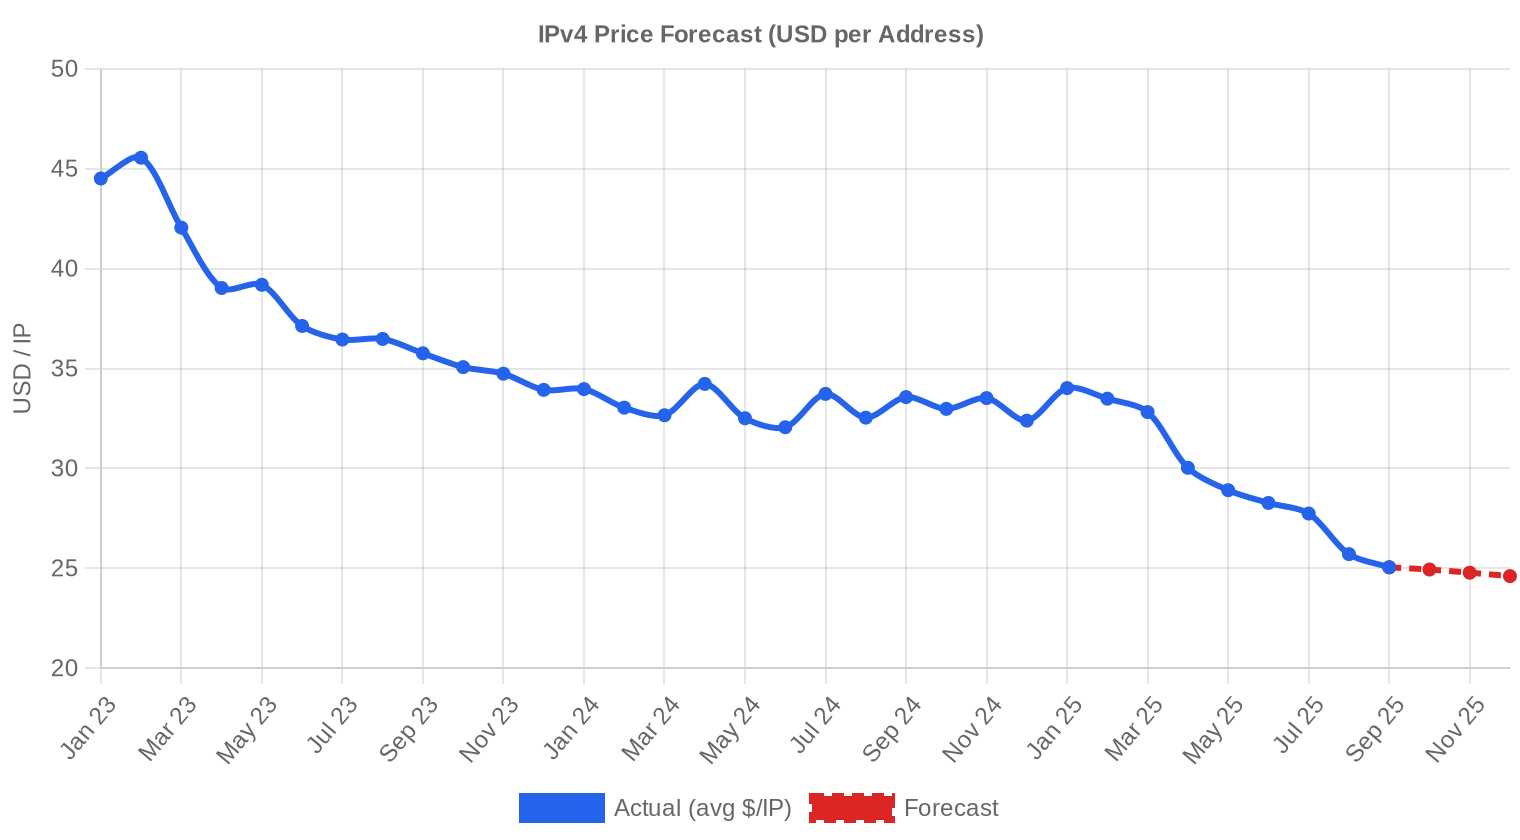
Forecasting each block-size band and RIR separately with our AI model:
The overall average price per IP is projected to reach $24.61 by December 2025, with a next-month estimate of $25.11 per IP.
- RIPE: projected at $27.00 per IP next month, trending toward $26.00 by December 2025.
- ARIN: projected at $24.50 per IP next month, trending toward $24.00 by December 2025.
- APNIC: projected at $26.00 per IP next month, trending toward $25.00 by December 2025.
- LACNIC: projected at $28.00 per IP next month, trending toward $27.50 by December 2025.
- AFRINIC: insufficient data for a reliable forecast.
Forecast by Block Size
| Block | Current $/IP | Next Month | Year-End | Confidence |
|---|---|---|---|---|
| /24 | $28.50 | $28.00 (-1.8%) | $27.50 (-3.5%) | medium |
| /23 | $26.00 | $26.00 (0.0%) | $25.50 (-1.9%) | medium |
| /22 | $24.95 | $24.50 (-1.8%) | $24.00 (-3.8%) | medium |
| /21 | $25.00 | $24.50 (-2.0%) | $24.00 (-4.0%) | medium |
| /20 | $22.50 | $22.00 (-2.2%) | $21.50 (-4.4%) | low |
| /19 | $21.00 | $21.00 (0.0%) | $20.50 (-2.4%) | low |
| /18-/16 | $16.00 | $16.00 (0.0%) | $15.50 (-3.1%) | low |
| /15-up | $14.00 | $14.00 (0.0%) | $13.50 (-3.6%) | low |
Editor's Take: Buy vs. Lease
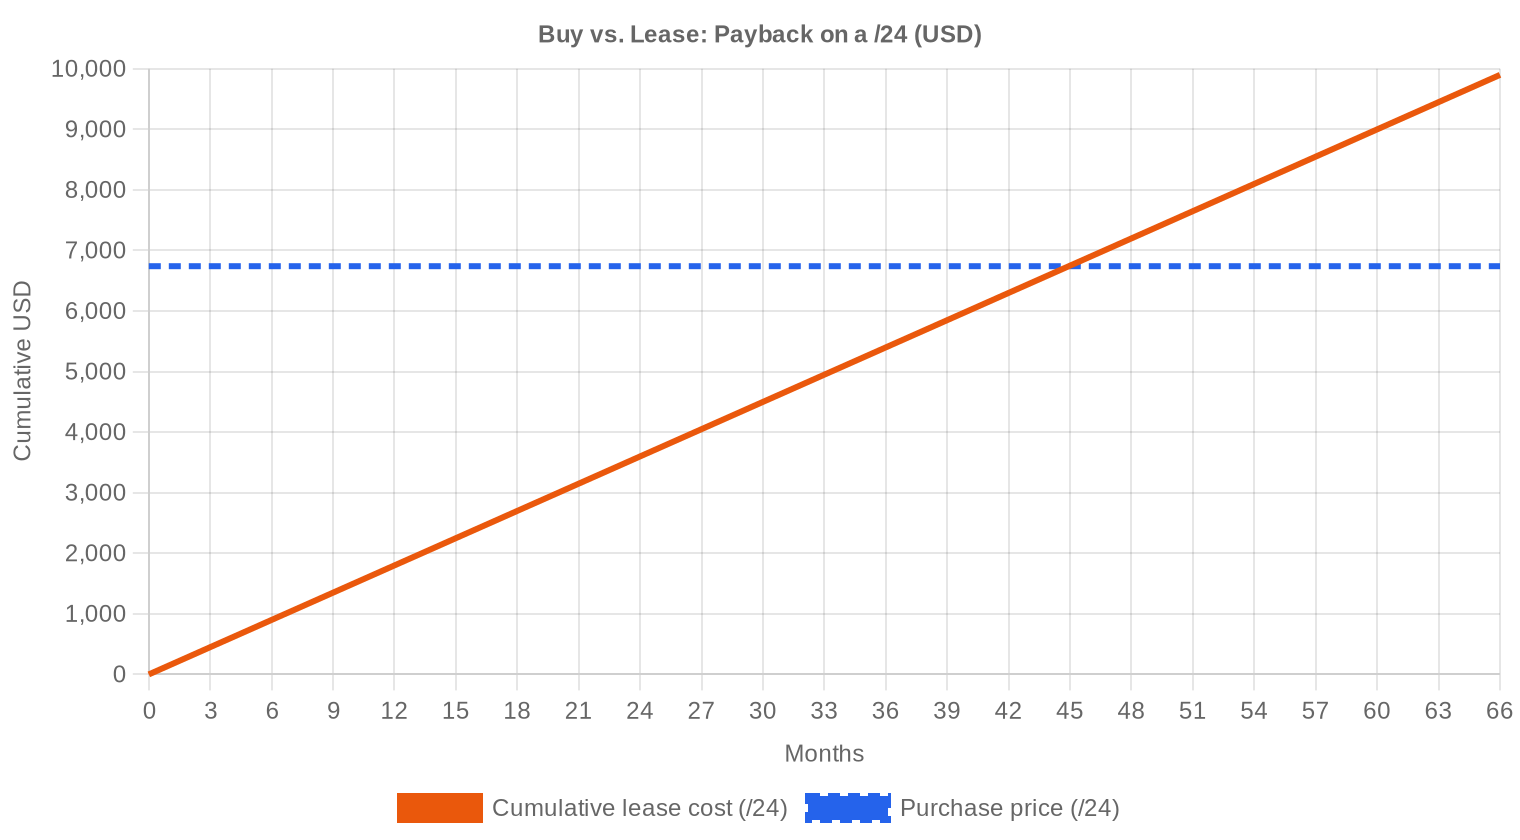
The buy-versus-lease math is unambiguous this quarter. At a purchase price of $26.33/IP and a lease rate of $0.59/month per IP, the payback period is approximately 44.9 months — just under 3.7 years. That implies an annualized yield of 26.7% for holders who lease out their inventory, a return that no reasonable fixed-income comparison can match. For buyers with a holding horizon beyond four years, purchasing makes clear economic sense; you own the asset outright and eliminate ongoing cash outflows. For short-term needs — project-based deployments, lab environments, temporary scaling — leasing remains the rational path. At the /24 level, the numbers are $6,740 to buy versus $150/month to lease. If you'll need the block for more than 45 months, buy it.| /24 Purchase price | $6,740 |
| /24 Lease price | $150 / mo |
| Payback period | 44.9 mo (3.7 yr) |
| Gross annual yield | 26.7% |
What This Means for You
Buyers: You are operating in the most favorable pricing environment since 2020. Average prices have dropped 20.7% year-over-year and the forecast points lower. If you have budgeted needs, accelerating procurement now locks in prices that may not hold indefinitely — markets overshoot in both directions. Push for ARIN blocks if you can tolerate the transfer timeline; $25.39/IP versus $27+ elsewhere is real money on a /16.Sellers: The window for extracting 2023-level pricing has closed. If you're holding clean, transferable blocks and have been waiting for a bounce, the data does not support that thesis through year-end. Pricing blocks competitively — at or below median — is the fastest path to liquidity. Stale listings at $30+ will sit.
Leasers: Lease rates have held relatively steady at $0.59/month per IP even as sale prices have fallen, which compresses the payback ratio and makes leasing incrementally less attractive for long-duration users. Re-evaluate your lease commitments against current purchase prices.
Block Holders: The 26.7% annualized yield on leased-out inventory is extraordinary by any asset-class standard. If you're sitting on unused allocations, leasing generates cash flow while preserving optionality on the sale. Don't sell into a falling market if you don't have to — lease and wait.
Browse verified IPv4 blocksSell IPv4 →
List your blocks with managed transferLease IPv4 →
Flexible short-term capacityLease Out IPv4 →
Turn idle blocks into recurring revenue
IPv4 Pricing by Block Size
The per-IP premium on /24 blocks remains the market's most persistent feature. A clean /24 at median pricing runs about $6,912 ($27 × 256), while larger blocks — /20s and above — clear in the $22–25 range per IP as buyers negotiate volume discounts. The spread between a /24 and a /16 can be 20–30% on a per-IP basis, which makes bulk acquisition materially cheaper for buyers with the capital and the routing need.| Block | IPs | Buy: /IP | Buy: Total | Lease: /IP/mo | Lease: Monthly |
|---|---|---|---|---|---|
| /24 | 256 | $35–45 | $8,960–11,520 | $0.38–0.50 | $97–128 |
| /22 | 1,024 | $28–38 | $28,672–38,912 | $0.33–0.45 | $338–461 |
| /20 | 4,096 | $22–32 | $90,112–131,072 | $0.30–0.40 | $1,229–1,638 |
| /18 | 16,384 | $20–30 | $327,680–491,520 | $0.30–0.38 | $4,915–6,226 |
| /16 | 65,536 | $18–28 | $1,179,648–1,835,008 | $0.30–0.35 | $19,661–22,938 |
IPv4 Price History: 2011–2026
IPv4 addresses first acquired monetary value after IANA pool exhaustion in 2011, trading in the low single digits. Prices climbed steadily through the 2010s, accelerated during 2021–2022 on cloud demand and pandemic-driven digitization, and peaked near $50–55/IP in some RIR zones by early 2023. AWS's introduction of public IPv4 charges in February 2024 marked an inflection — enterprises started returning unused elastic IPs, and the psychological ceiling on pricing broke. The current $26.33 average represents roughly a 50% drawdown from peak levels, establishing a new trading range that the market is still in the process of discovering.| Year | ~Price/IP | Key Event |
|---|---|---|
| 2011 | $7–12 | IANA free pool exhausted; Microsoft/Nortel deal ($11.25/IP) |
| 2012 | $8–12 | RIPE NCC reaches last /8; begins /22-only allocation |
| 2014 | $10–15 | LACNIC free pool exhausted |
| 2015 | $8–15 | ARIN free pool exhausted |
| 2017–18 | $12–18 | Leasing market grows; cloud demand rises |
| 2019 | $18–24 | RIPE NCC exhausts remaining free pool |
| 2021–22 | $50–60+ | Post-pandemic peak; hyperscaler build-outs |
| 2024 | $35–52 | AWS IPv4 charge ($0.005/IP/hr); large block correction |
| 2025–26 | $18–45 | Market bifurcation; /16s below $20 for first time since 2019 |
Market Structure: Who Is Buying & Selling
The buyer base has shifted. Hyperscalers have largely filled their near-term needs; the active demand now comes from mid-tier ISPs, regional cloud providers, managed hosting firms, and enterprises with on-premises infrastructure that can't run dual-stack yet. On the sell side, legacy holders — universities, government agencies, corporations allocated massive blocks in the 1990s — continue to monetize unused space. Bankruptcy estates and M&A-driven divestitures provide a secondary supply channel that tends to cluster around quarter-end.IPv4 vs. Other Asset Classes
At a 26.7% annualized lease yield, IPv4 addresses outperform virtually every conventional asset class on a cash-flow basis. US 10-year Treasuries yield roughly 4.3%; residential cap rates in major US markets sit around 5–6%; the S&P 500 dividend yield hovers near 1.3%. The caveat is liquidity and terminal value risk — IPv4 blocks don't trade on an exchange, and the eventual transition to IPv6 represents a long-duration impairment risk that no bond or REIT carries. Still, for a three-to-five-year holding period, the risk-adjusted return is compelling.| Asset Class | Typical Yield | Liquidity | Primary Risk |
|---|---|---|---|
| IPv4 | 26.7% | Moderate | IPv6 adoption, block quality |
| Commercial Real Estate | 5–8% | Low | Vacancy, rate cycle |
| Investment-Grade Bonds | 4–5% | High | Duration, credit risk |
| S&P 500 | ~1,3% | High | Market volatility |
| Money Market / T-Bills | ~4–5% | High | Rate cycle changes |
IPv6 Adoption & Why IPv4 Remains Essential
IPv6 deployment continues to advance — Google reports roughly 45% of its traffic arriving over IPv6 — but the transition timetable keeps stretching. Legacy applications, enterprise firewalls, IoT device stacks, and carrier-grade NAT infrastructure all maintain hard dependencies on IPv4. The realistic planning horizon for full IPv4 displacement remains 10–15 years at minimum, which means the address space retains economic utility well beyond any reasonable investment holding period.AI & Cloud Infrastructure Demand
AI infrastructure buildouts are generating incremental IPv4 demand, particularly for inference endpoints that require public-facing IP addresses. Training clusters are largely internal and can operate behind NAT, but inference-as-a-service deployments — API endpoints, edge nodes, model-serving farms — need routable addresses at scale. Several mid-tier AI hosting providers have been active buyers through Q2 and Q3 2025, acquiring /20 and /19 blocks for GPU cluster deployments.What Determines IPv4 Block Value
Block valuation depends on a hierarchy of factors: blacklist cleanliness, spam-database reputation, allocation age, and RIR jurisdiction. A block that's been parked clean for five years commands a premium over recently transferred space that might carry residual reputation issues. RIPE and ARIN blocks are the most liquid; APNIC blocks trade at a slight premium due to scarcity in-region. AFRINIC blocks remain nearly untradeable given ongoing legal and governance disputes at the registry.Sell vs. Lease: A Decision Framework
In a declining-price environment, holders who don't need immediate capital should lean toward leasing. The 26.7% annualized yield generates cash flow that can exceed the sale price within four years while preserving the option to sell later if prices stabilize. Selling makes sense if you need to exit entirely, if the block has reputation issues that limit lease demand, or if you believe the decline will accelerate beyond the current forecast of $24.61 by December.| /24 Purchase price | $6,740 |
| /24 Lease price | $150 / mo |
| Payback period | 44.9 mo (3.7 yr) |
| Gross annual yield | 26.7% |
RIPE NCC 24-Month Transfer Restriction
RIPE's 24-month holding requirement before inter-RIR transfer continues to function as a supply throttle. Blocks acquired in H1 2024 won't be eligible for re-transfer until H1 2026, which removes a tranche of inventory from the near-term supply pool. This rule contributes to the persistent RIPE premium — buyers pay more because supply is structurally constrained relative to ARIN, where no comparable holding period exists.Deal Size Distribution
Average deal size fell to approximately 5,656 IPs ($102,956 per transaction), down from roughly 6,400 IPs in Q2 2025. The distribution is heavily right-skewed: 169 deals (68.7%) came in under $50,000, accounting for just $2.3 million of the $25.3 million total. At the other end, 13 deals above $1 million generated $24.2 million — nearly the entire market value. The mid-market ($50K–$250K) produced 58 deals worth $6.7 million, representing the most active institutional segment.Top Trading Countries
Granular country-level data was limited this quarter. Based on RIR share, the United States remains the largest single-country market by IP volume, driven by ARIN's 76.5% share of addresses traded. European activity — primarily Germany, the UK, and the Netherlands — underpins RIPE's 101 transactions and 22.3% IP volume share.BEAD Broadband Program Impact
The $42.5 billion BEAD broadband program continues its slow rollout through state-level subgrantee selection. As ISPs receiving BEAD funding begin deploying fixed wireless and fiber networks in underserved areas, they will need routable IPv4 space — typically /20 to /18 blocks — for subscriber CPE and management infrastructure. This demand hasn't materialized in volume yet, but it represents a structural tightening factor for mid-size blocks over the next 12–24 months that could put a floor under pricing.Hyperscaler IPv4 Holdings
Amazon, Microsoft, and Google collectively hold an estimated 100+ million IPv4 addresses — enough to influence market dynamics simply through retention or release decisions. AWS's 2024 pricing move ($0.005/hr per public IPv4) already triggered a wave of address returns that softened demand. If any hyperscaler decided to monetize even a fraction of its holdings, the supply shock would push prices materially lower. For now, they appear to be holding, using their blocks operationally, and treating them as strategic infrastructure rather than tradeable assets.Macroeconomic Conditions & Market Impact
Interest rates remain elevated, with the Fed funds rate still above 4.5%. Higher rates increase the carrying cost of capital-intensive IP address portfolios and dampen speculative accumulation. Enterprise IT budgets for 2025 have been generally flat to slightly up, with spending priorities shifting toward AI infrastructure at the expense of traditional networking. The net effect is a buyer pool that is selective, price-sensitive, and focused on near-term operational needs rather than speculative inventory building.Model Update & Calibration
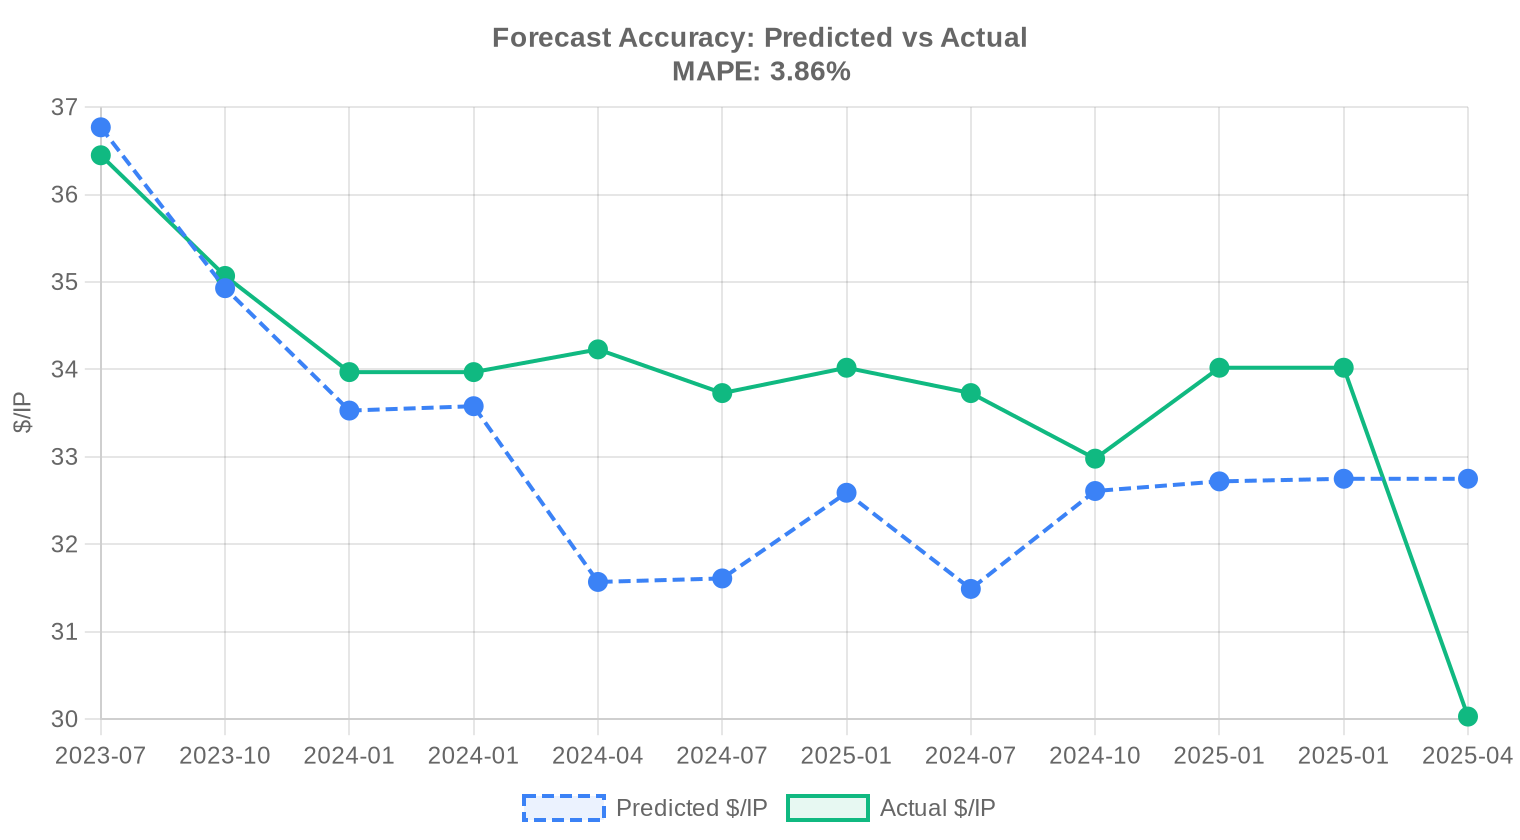
We reviewed our past projections against actual market outcomes and recalibrated the model for this report. The updated model places more weight on recent price movements using exponential decay, dynamically adjusts prediction bands to reflect current market conditions, and corrects for any systematic bias detected in earlier forecasts. The predicted-vs-actual comparison chart below shows how closely our past estimates tracked reality.
| Report Period | Target Month | Predicted | Actual | Deviation |
|---|---|---|---|---|
| 2024 | 2025-01 | $33 | $34 | -4% |
| 2024-Q2 | 2024-07 | $31 | $34 | -7% |
| 2024-Q3 | 2024-10 | $33 | $33 | -1% |
| 2024-H2 | 2025-01 | $33 | $34 | -4% |
| 2024-Q4 | 2025-01 | $33 | $34 | -4% |
| 2025-Q1 | 2025-04 | $33 | $30 | +9% |
Methodology
Figures are based on completed IPv4Center marketplace transactions and RIR transfer statistics. Prices are in US dollars per IP address. Forecasts are produced by an AI model that analyses each block-size band and RIR segment separately (with outlier-trimmed medians) alongside known market catalysts; they are estimates, not guarantees.
Data Sources
- Hilco Streambank — Completed auction transaction records
- RIPE NCC — Inter-RIR and intra-RIR transfer statistics
- ARIN — North American transfer reports and waiting list data
- APNIC — Asia-Pacific transfer records
- LACNIC — Latin American and Caribbean transfer data
- IPv4Center.com — Proprietary marketplace transaction and lease pricing data
This report is generated automatically for informational purposes only and does not constitute financial advice.
Frequently Asked Questions
What was the average price per IPv4 address in Q3 2025?
The global weighted average landed at .33 per IP, with a median of . That represents a modest -0.66% decline from the prior period, consistent with the broader downward drift the market has exhibited through 2025.
How many transactions closed in Q3 2025, and what was the aggregate dollar volume?
We tracked 246 completed sale transactions covering roughly 1.39 million addresses for a combined value of .3 million. The average deal size was approximately 103,000 addresses — skewed upward by a handful of large ARIN blocks.
Which RIR region commanded the highest per-IP prices this quarter?
LACNIC blocks were the priciest at .29 per IP on average, followed closely by APNIC at .72 and RIPE at .16. ARIN, despite dominating volume, averaged just .39 — a discount that reflects its deeper supply of large legacy blocks.
Why are ARIN blocks trading at a discount to RIPE and APNIC when ARIN accounts for over half the market?
ARIN contributed 50.4% of transaction count and roughly 76% of total IPs traded this quarter (1.06 million of 1.39 million). That supply concentration naturally compresses prices. ARIN's median was versus RIPE's .50; buyers shopping for large blocks simply have more options in the ARIN registry.
What was the price range observed across all transactions in Q3 2025?
The floor was per IP — seen in both ARIN and RIPE, likely distressed or legacy micro-blocks — while the ceiling hit on an ARIN transaction. That spread is wide, underscoring how much block size, cleanliness, and routing history still matter.
How did RIPE transfer activity compare to ARIN this quarter?
RIPE led all registries in recorded transfers with 1,360 out of 2,192 total (58.7% share), versus ARIN's 832 (41.3%). Note that many RIPE transfers are intra-RIR reassignments that don't involve a sale. On priced transactions, ARIN led with 124 deals to RIPE's 101.
Is the IPv4 market trending up or down heading into Q4 2025?
Down, gently. Our model forecasts an average price of .11 next month and .61 by December 2025. The decline is orderly — roughly a dollar per IP over the balance of the year — not a collapse. We rate the forecast as reliable based on current data density.
What mistakes should buyers avoid when acquiring IPv4 blocks in the current market?
Three common errors: overpaying for small ARIN blocks when the median is , neglecting to check blocklist and abuse history before closing, and rushing a transaction without verifying the seller's standing with the RIR. In a market trending down at -0.66% per period, urgency premiums are rarely justified.
What are the risks of buying IPv4 addresses at + when the forecast points to .61 by year-end?
At face value, a buyer paying today on a /16 would see roughly .65 million in mark-to-market erosion by December if our .61 forecast holds. For organizations with immediate operational need, the opportunity cost of waiting may exceed that. For purely speculative positions, the math is less forgiving.
Is it better to buy or lease IPv4 addresses at current rates?
At .59 per IP per month lease versus .33 to purchase, the buy-versus-lease breakeven is approximately 44.9 months — just under 3.7 years. If your planning horizon exceeds four years, buying is the clear winner. For shorter-term needs or uncertain capacity planning, leasing preserves optionality. Our model verdict: buy.
What annual yield does an IPv4 block generate at current lease rates?
Roughly 26.7% annualized, based on a .33 acquisition cost and .03 per IP in annual lease income. That is an eye-catching yield — but it assumes full occupancy, a creditworthy tenant, and stable lease rates, none of which are guaranteed in a softening market.
What does a /24 block cost to buy versus lease in Q3 2025?
A /24 (256 IPs) costs approximately ,740 to purchase outright at the market average. Leasing the same block runs about 0 per month or ,800 per year. The crossover point is around 45 months.
Which prefix size was most frequently traded this quarter?
/24 blocks accounted for 85 transactions, making them the most popular prefix by deal count. This is unsurprising — a /24 is the minimum independently routable block on the public internet, and it fits the budget of small and mid-size operators.
Were there any AFRINIC transactions in Q3 2025?
Zero. AFRINIC recorded no priced sales and no transfers this quarter. The registry's ongoing governance and legal challenges continue to freeze secondary-market activity in the African region.
How active was the APNIC market this quarter?
Thin. Only 14 transactions closed in the APNIC region, covering 11,264 addresses worth 5,050. The average was .72 per IP with a tight range of –, reflecting a small, price-aware buyer pool and limited block supply.
What does the deal-size distribution look like in Q3 2025?
The market is barbell-shaped: 169 deals (69%) were under K, totaling just .3 million, while 13 deals over million accounted for .2 million — nearly the entire dollar volume. The institutional end of the market is driving valuations; the retail end is driving transaction count.
What risks should sellers be aware of in a declining-price environment?
Every month of delay costs roughly .17 per IP if the forecast trajectory holds. Sellers sitting on unused blocks should price to market rather than anchoring to last quarter's highs. The bid-ask spread widens in a downturn, and stale listings attract lowball offers.
How many total transfers — including non-sale transfers — were recorded in Q3 2025?
2,192 total transfers across all RIRs. Of those, only 246 were priced sale transactions — the rest were mergers, acquisitions, reorganizations, or policy-based transfers. RIPE dominated with 1,360 transfers (62%), reflecting its active intra-European reallocation ecosystem.
Will IPv6 adoption materially reduce IPv4 prices in the near term?
Not in any quarter visible from here. IPv6 has been 'imminent' for over a decade. While adoption is genuinely climbing, legacy infrastructure, CDN dependencies, and enterprise inertia ensure IPv4 demand persists. Our year-end forecast of .61 prices in gradual softening — not a v6-driven cliff.
What does the LACNIC market look like, and should buyers consider it?
LACNIC saw just 7 transactions on 4,608 IPs at an average of .29 — the highest of any RIR this quarter. The premium reflects extreme scarcity; supply is razor-thin. Buyers should expect longer lead times and limited negotiating leverage in the Latin American registry.
What is the typical transfer timeline for an IPv4 block purchase?
Plan for 4–8 weeks on ARIN transactions and 2–4 weeks for RIPE, assuming clean documentation and no policy flags. APNIC and LACNIC can stretch longer due to smaller transfer-desk staffing. Escrow release typically adds 3–5 business days after RIR approval.
What should I avoid when leasing IPv4 addresses at current rates?
Don't lock into a multi-year lease at .59/month per IP without a termination clause. If purchase prices continue declining toward .61 by year-end, the buy-versus-lease math shifts further toward ownership. Also avoid lessors who cannot demonstrate clean WHOIS and routing authority.
How reliable is the year-end price forecast of .61?
We flag this forecast as reliable, supported by 246 transactions and over 33 months of historical pricing data covering approximately 27,400 observed data points. That said, 'reliable' means directionally sound — not precise to the cent. A large M&A event or policy change could alter the trajectory.
Are there signs of speculative buying distorting Q3 2025 prices?
The 13 transactions exceeding million — collectively worth .2 million — could include speculative positions, but the declining average price and negative trend (-0.66%) suggest speculators are not currently setting the marginal price. If anything, the smart money appears to be selling, not accumulating.
What is the risk of holding IPv4 assets through the end of 2025 without selling?
Based on our forecast, a holder of a /16 block (65,536 IPs) valued at .33 per IP today — roughly .73 million — could see that valuation decline to approximately .61 million by December 2025. That's a potential 2K erosion in five months. Carrying costs (WHOIS maintenance, insurance, opportunity cost of capital) add to the drag.