14 min read
This report analyzes the IPv4 transfer market for Q1 2025, based on completed IPv4Center marketplace transactions and official RIR transfer records.
Executive Summary
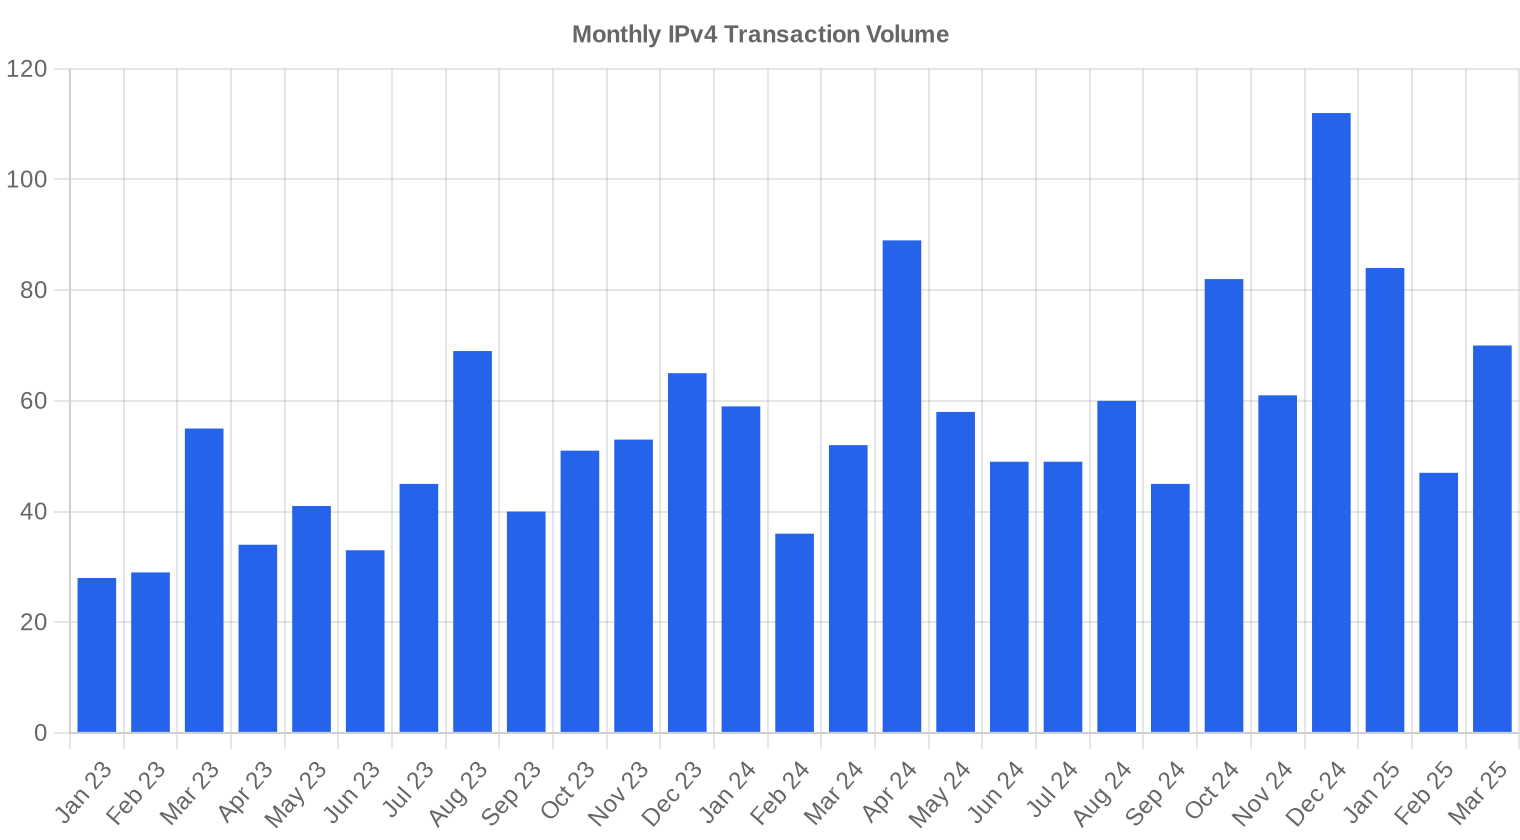
The IPv4 transfer market opened 2025 with 201 completed transactions covering 734,464 addresses at a weighted average of $33.48 per IP — up 1.9% from Q4 2024 and 0.6% above Q1 2024 levels. Total deal value reached $22.9 million. Transaction count fell 21.2% quarter-over-quarter, a sharp pullback in activity even as pricing held firm. The combination of rising prices and declining volume suggests sellers are extracting slightly more per address while buyers grow more selective. ARIN-region blocks accounted for 40.8% of total volume, and the overall trend direction remains up, though the pace is slow — just 0.21% regression slope for the quarter.Market Overview
| Transactions | 201 |
| IP Addresses Traded | 734,464 |
| Estimated Market Value | $22,926,883 |
| Average Price / IP | $33.48 |
| Median Price / IP | $33.00 |
| RIR Transfers | 3,511 |
Year-over-Year Comparison
| Metric | This period | A year earlier (Q1 2024) | Change |
|---|---|---|---|
| Transactions | 201 | 147 | +36.7% |
| IP Addresses Traded | 734,464 | 247,808 | +196.4% |
| Estimated Market Value | $22,926,883 | $8,529,145 | +168.8% |
| Average Price / IP | $33.48 | $33.28 | +0.6% |
| RIR Transfers | 3,511 | 2,928 | +19.9% |
Price Dynamics
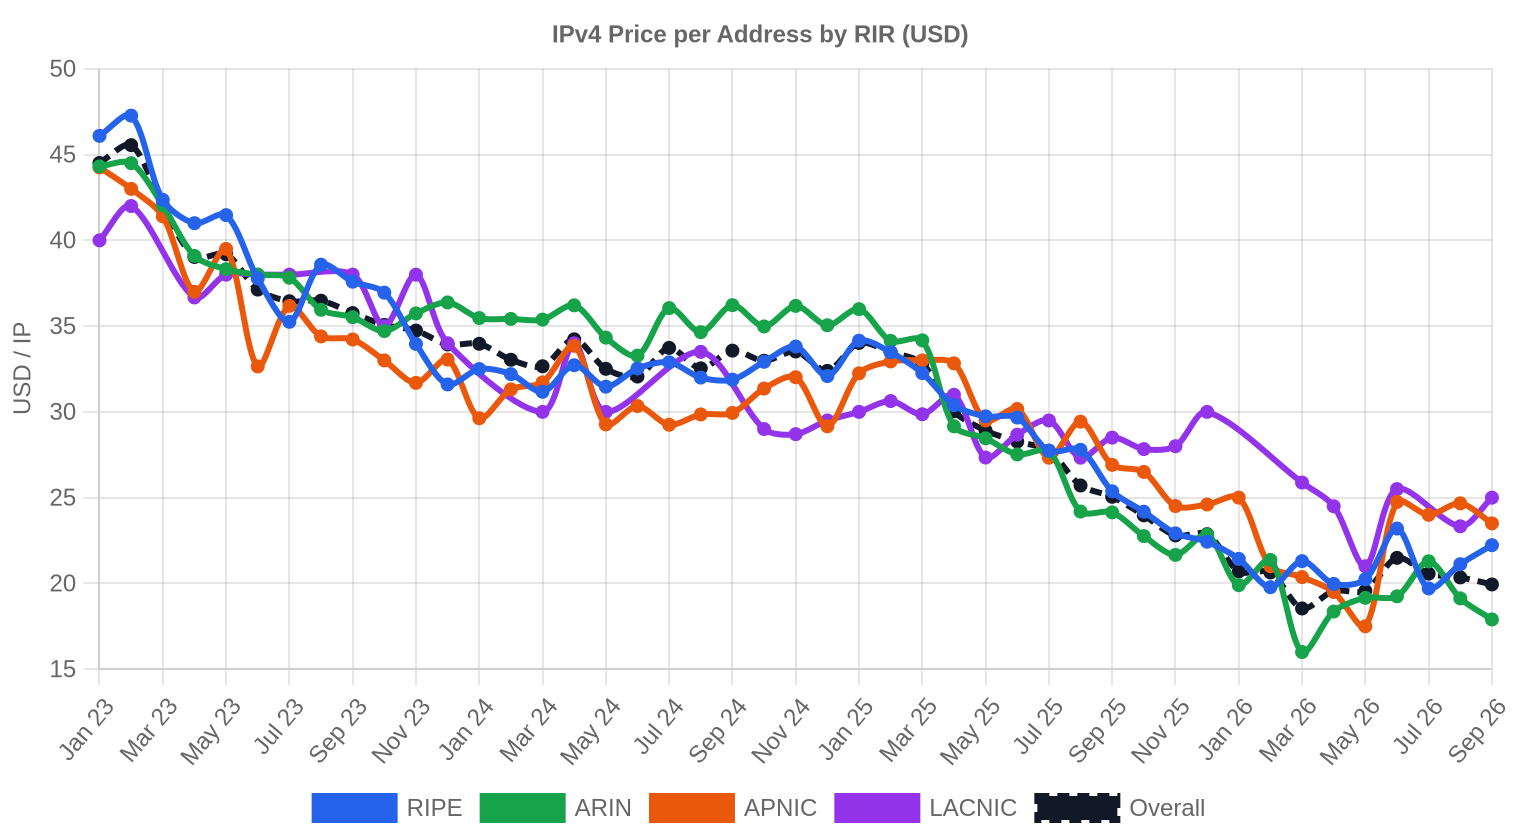
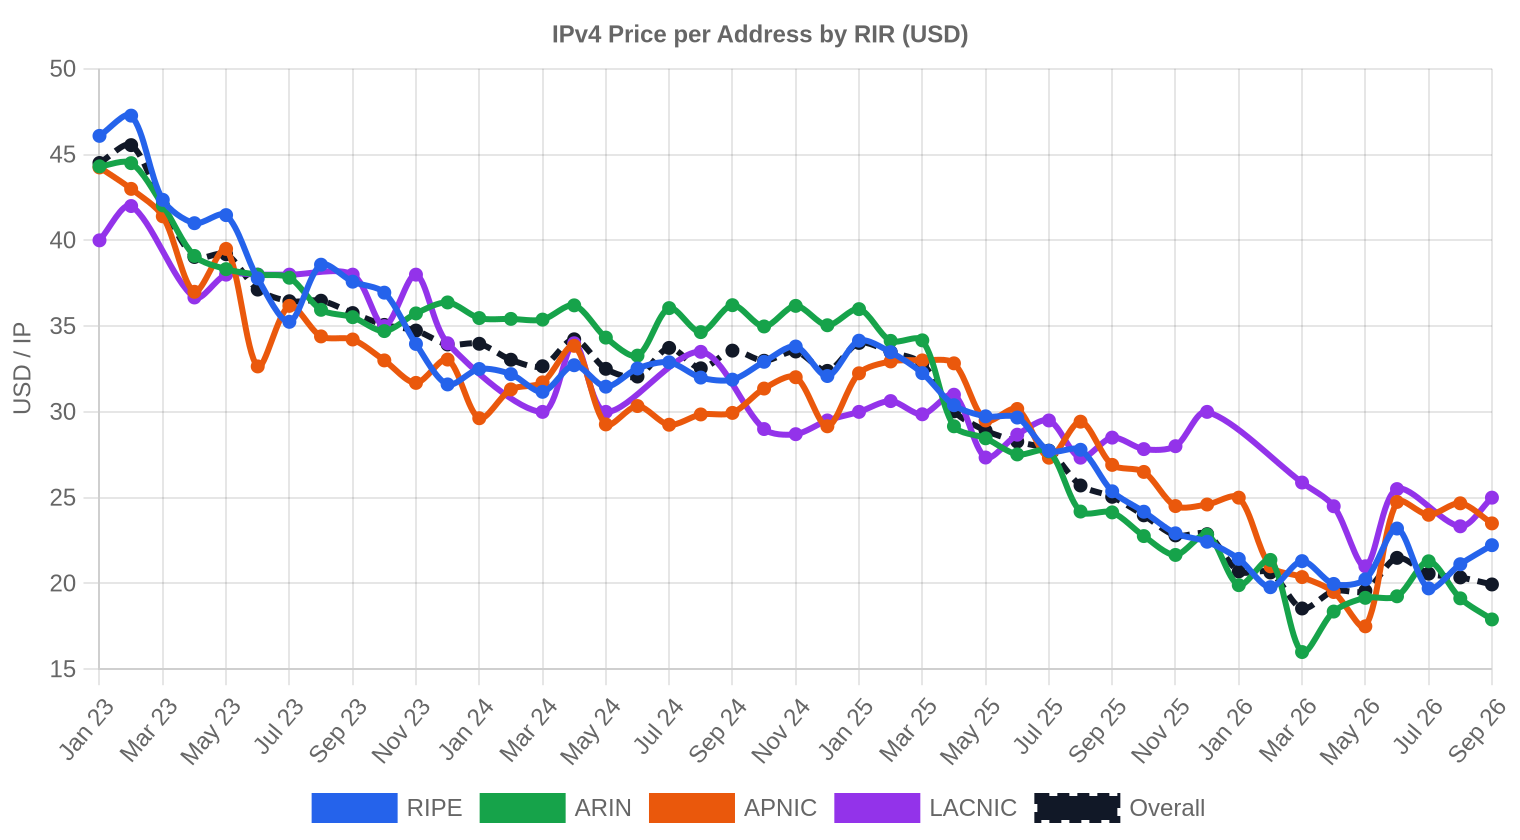
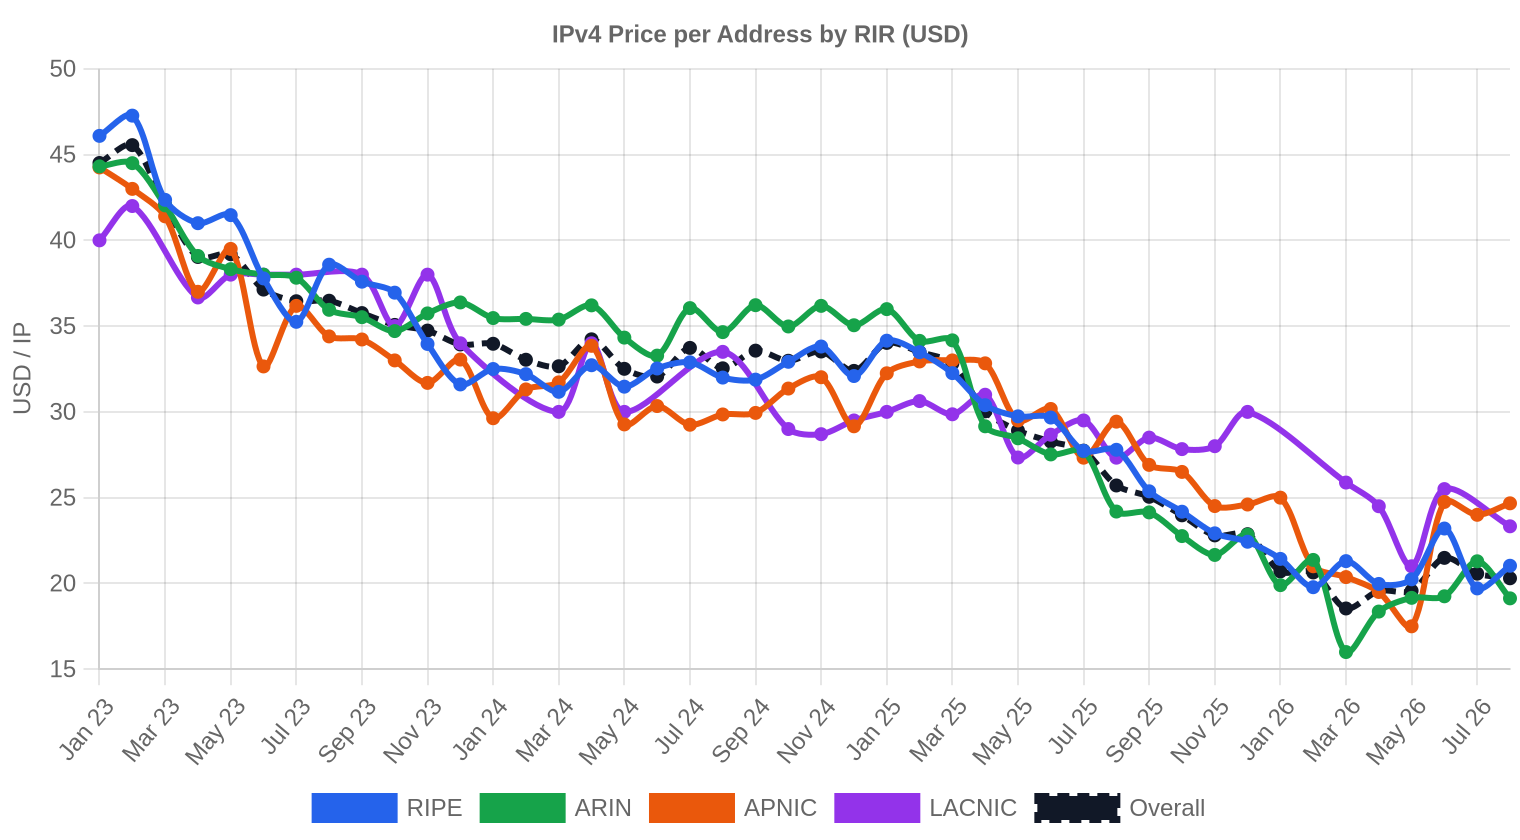
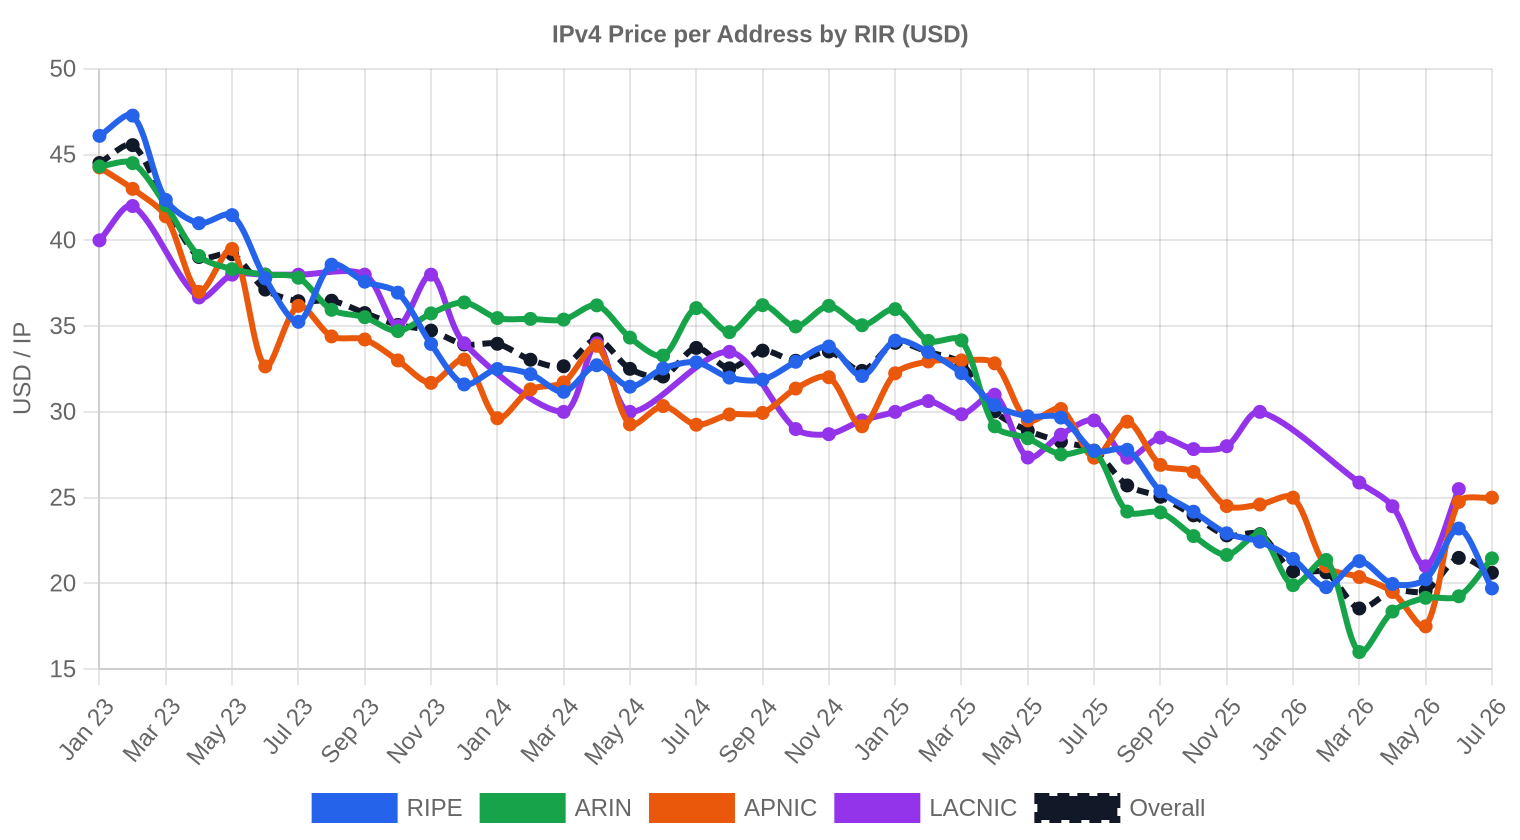
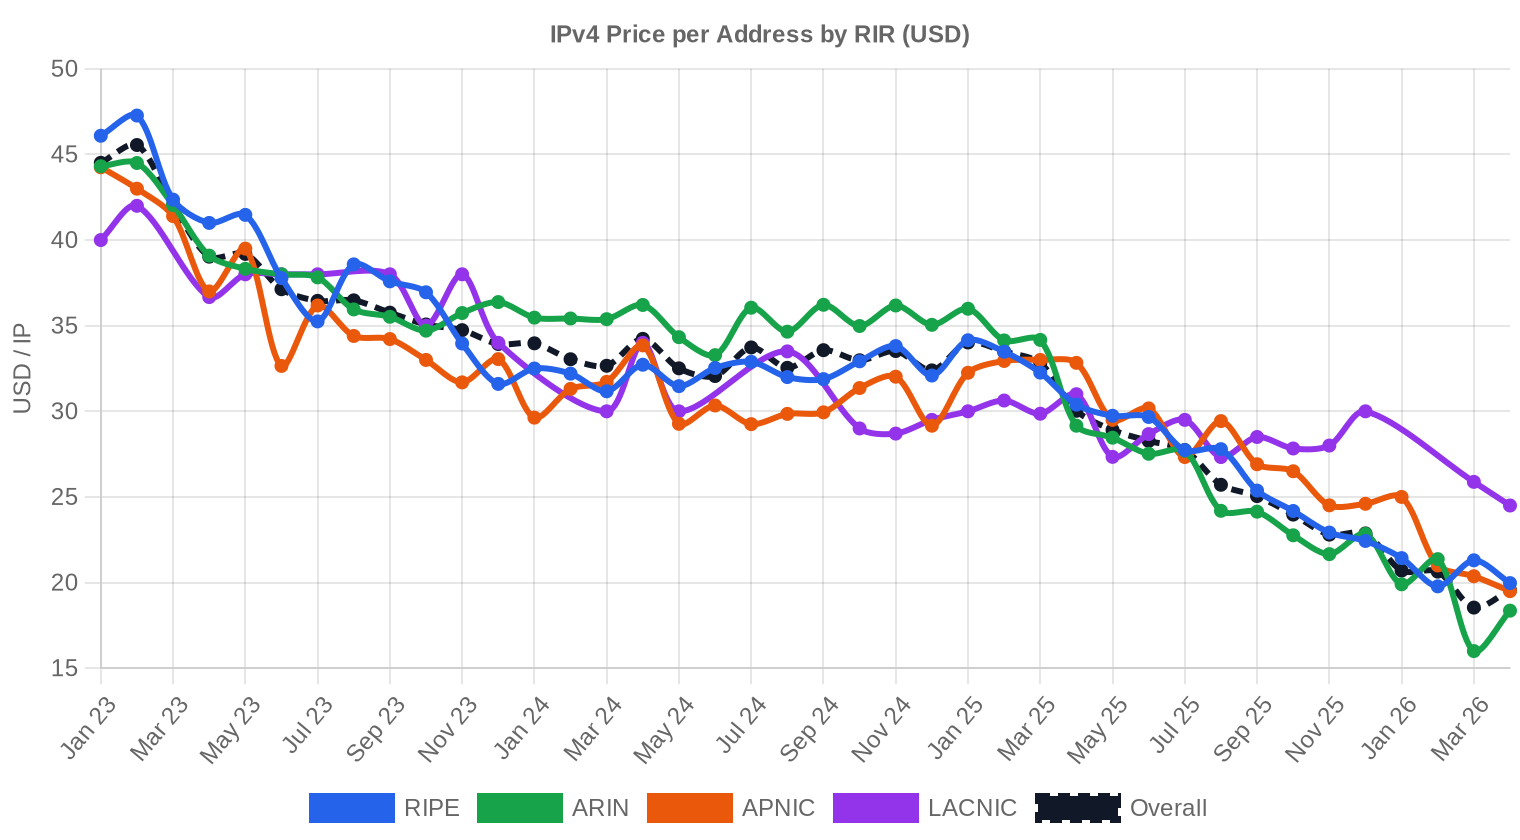
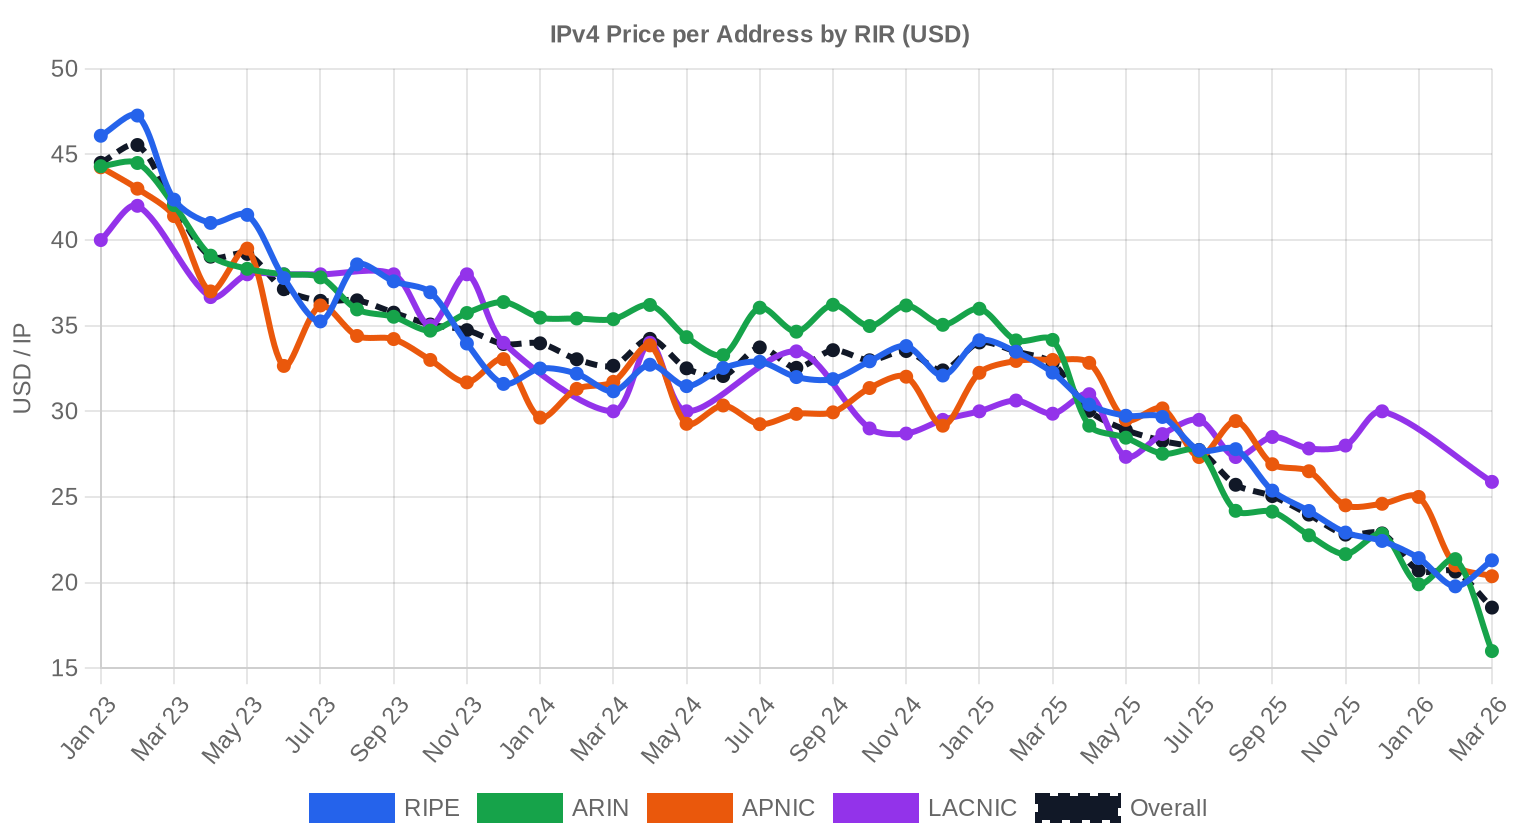
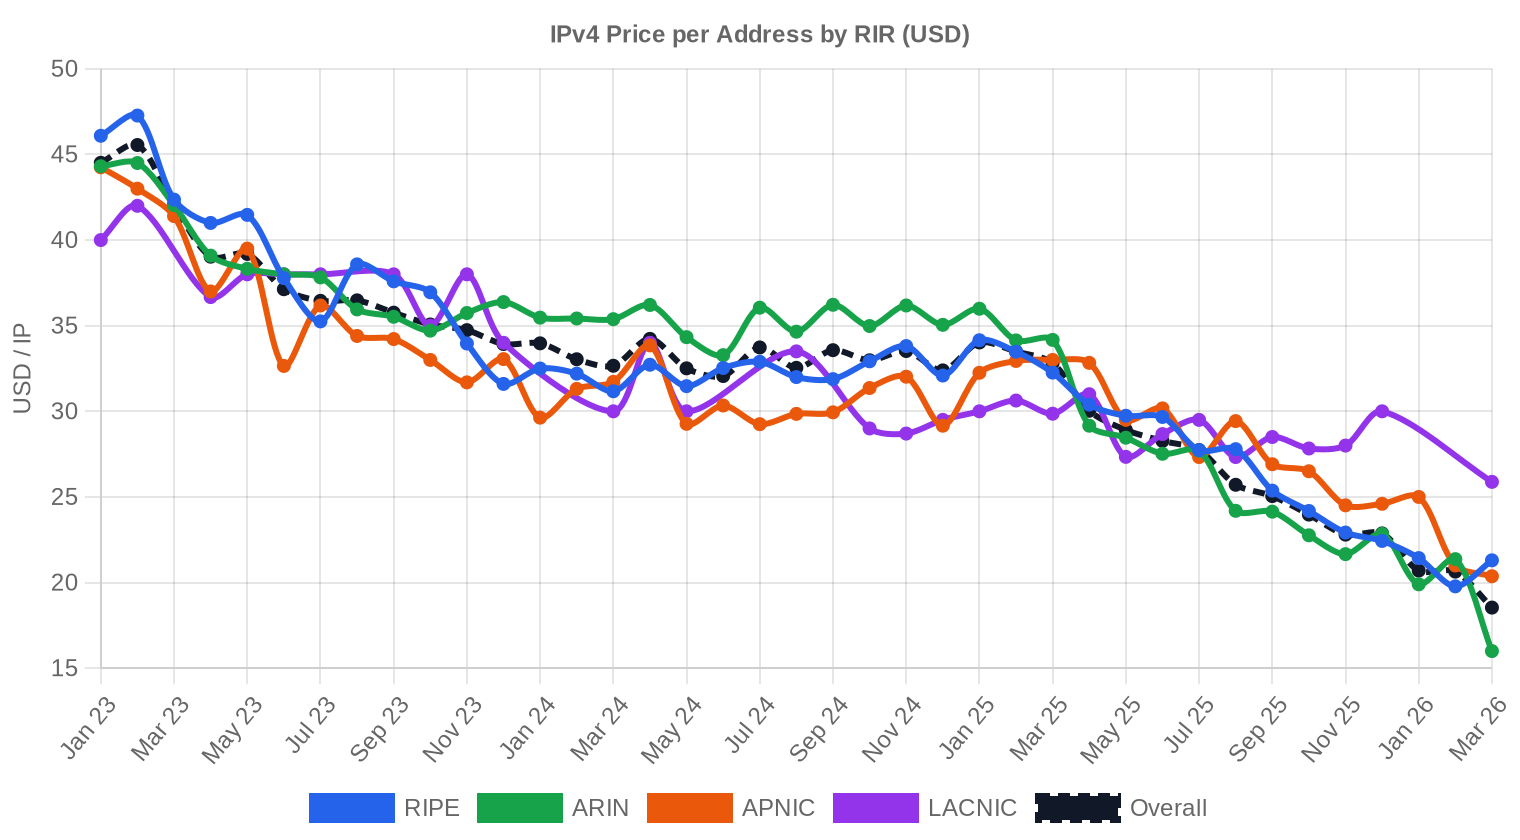
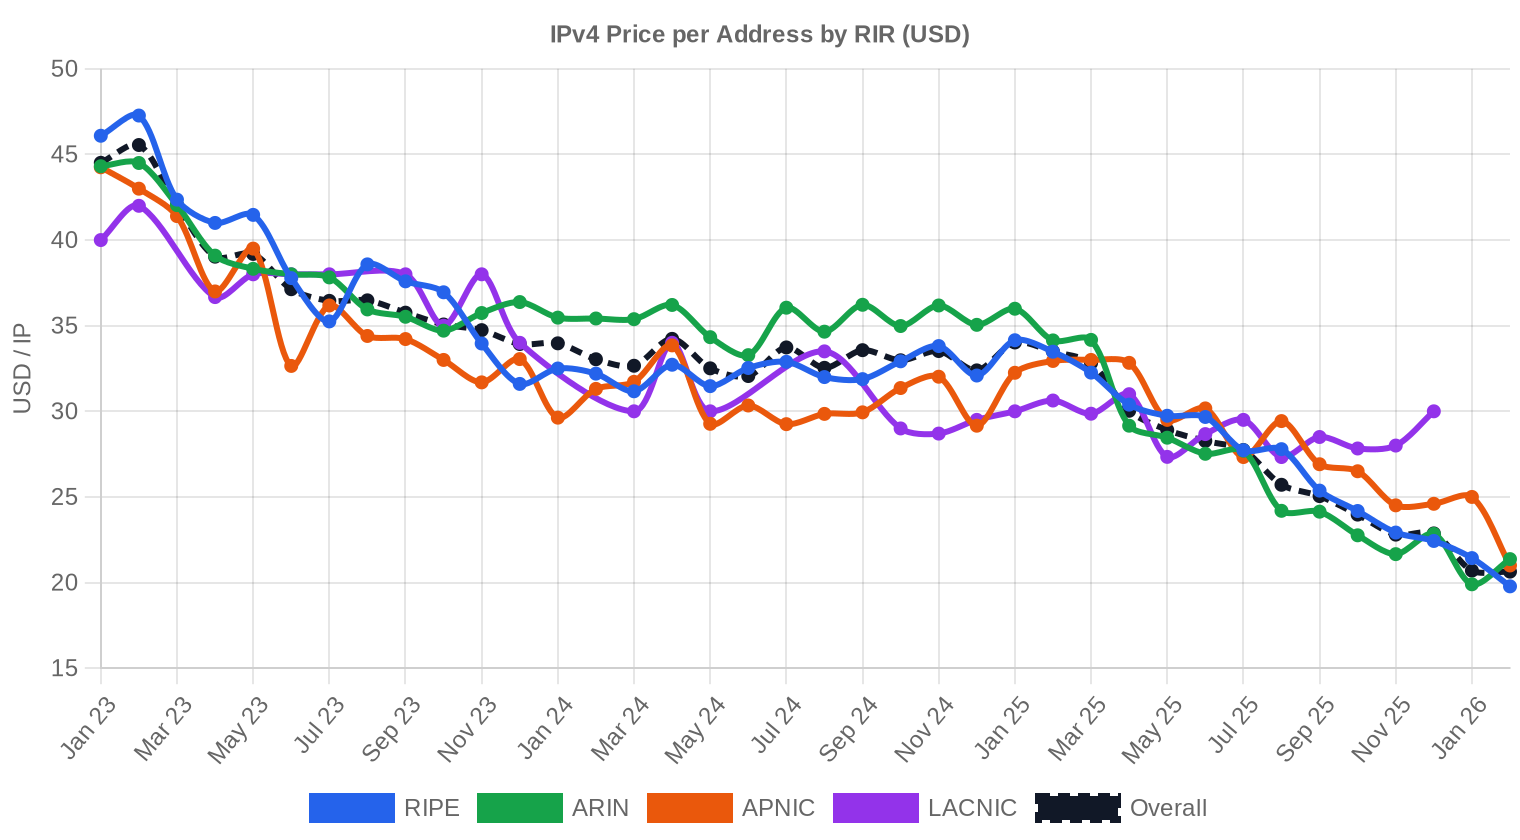
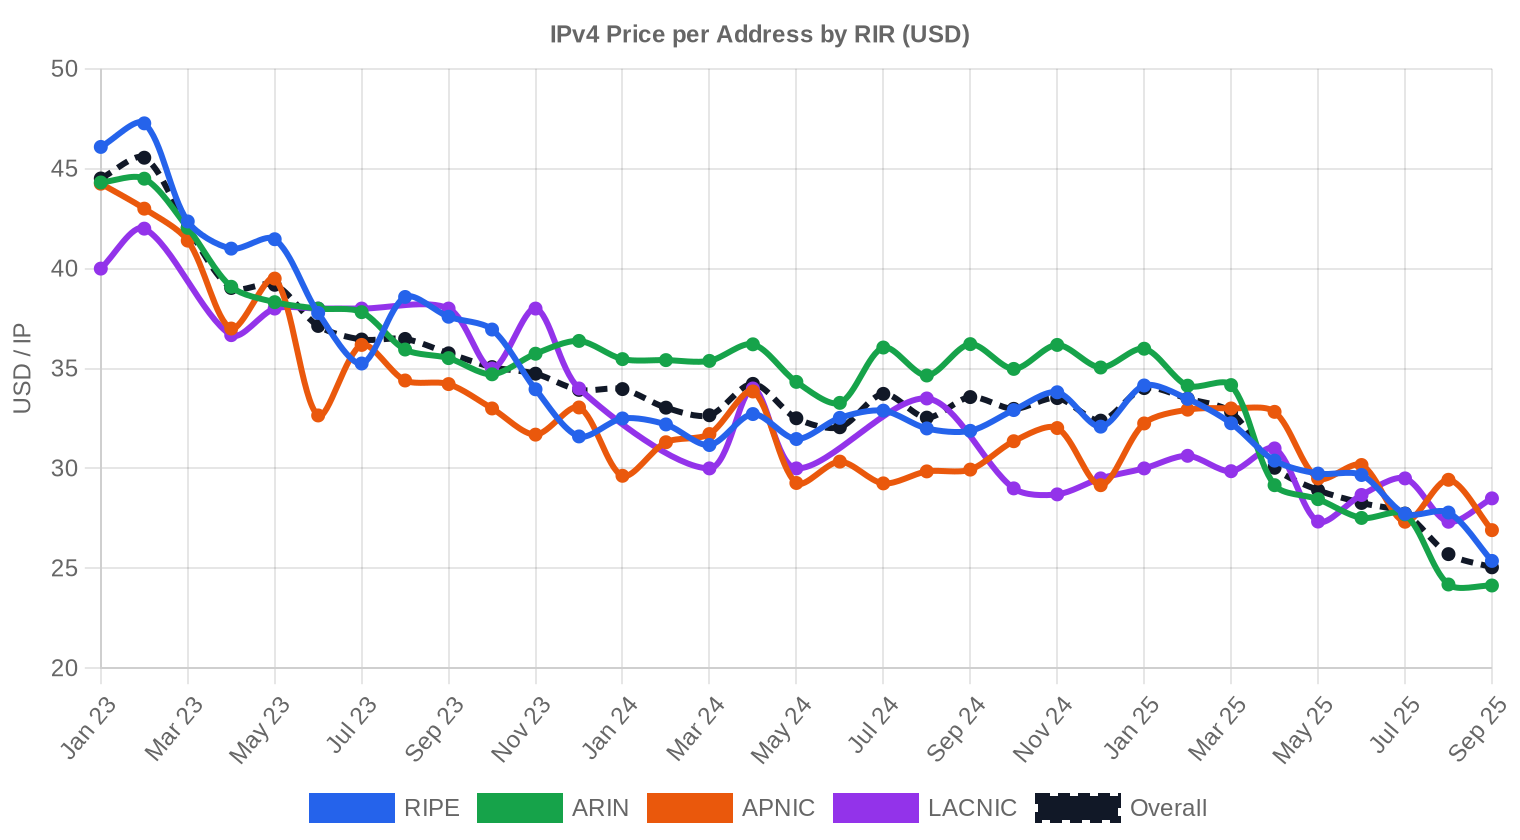
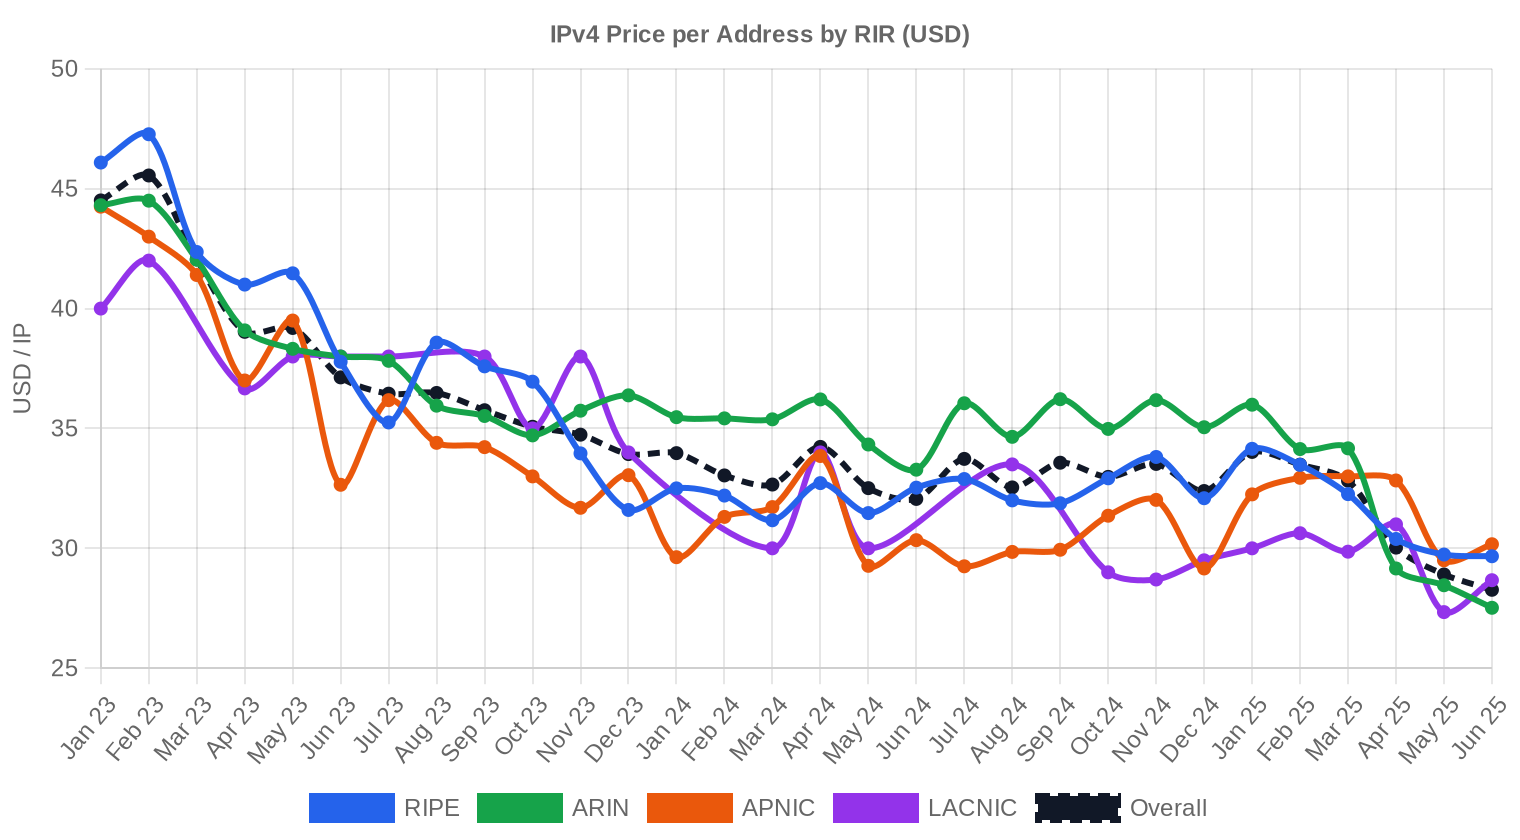
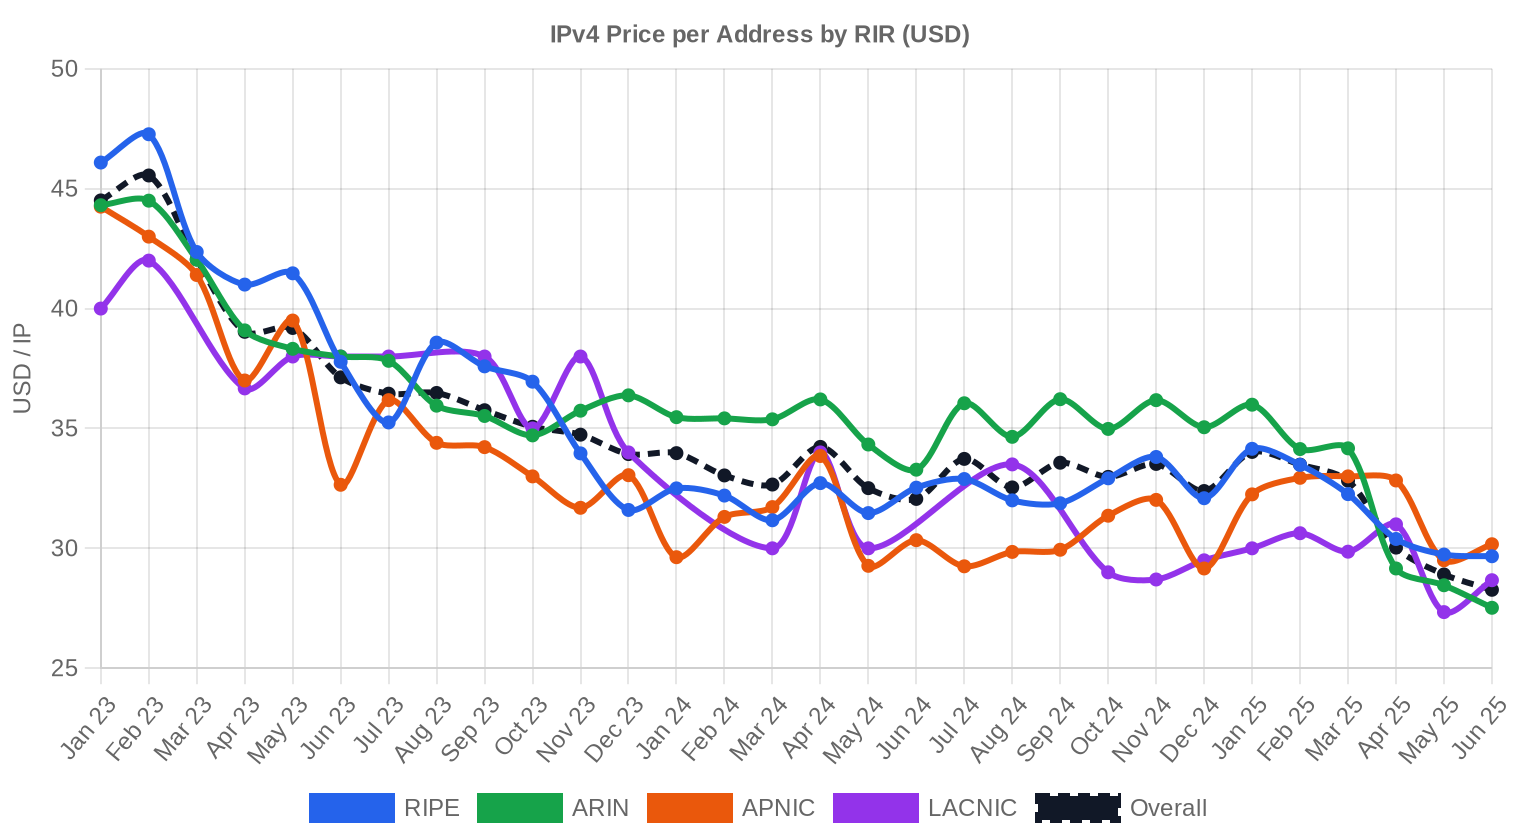
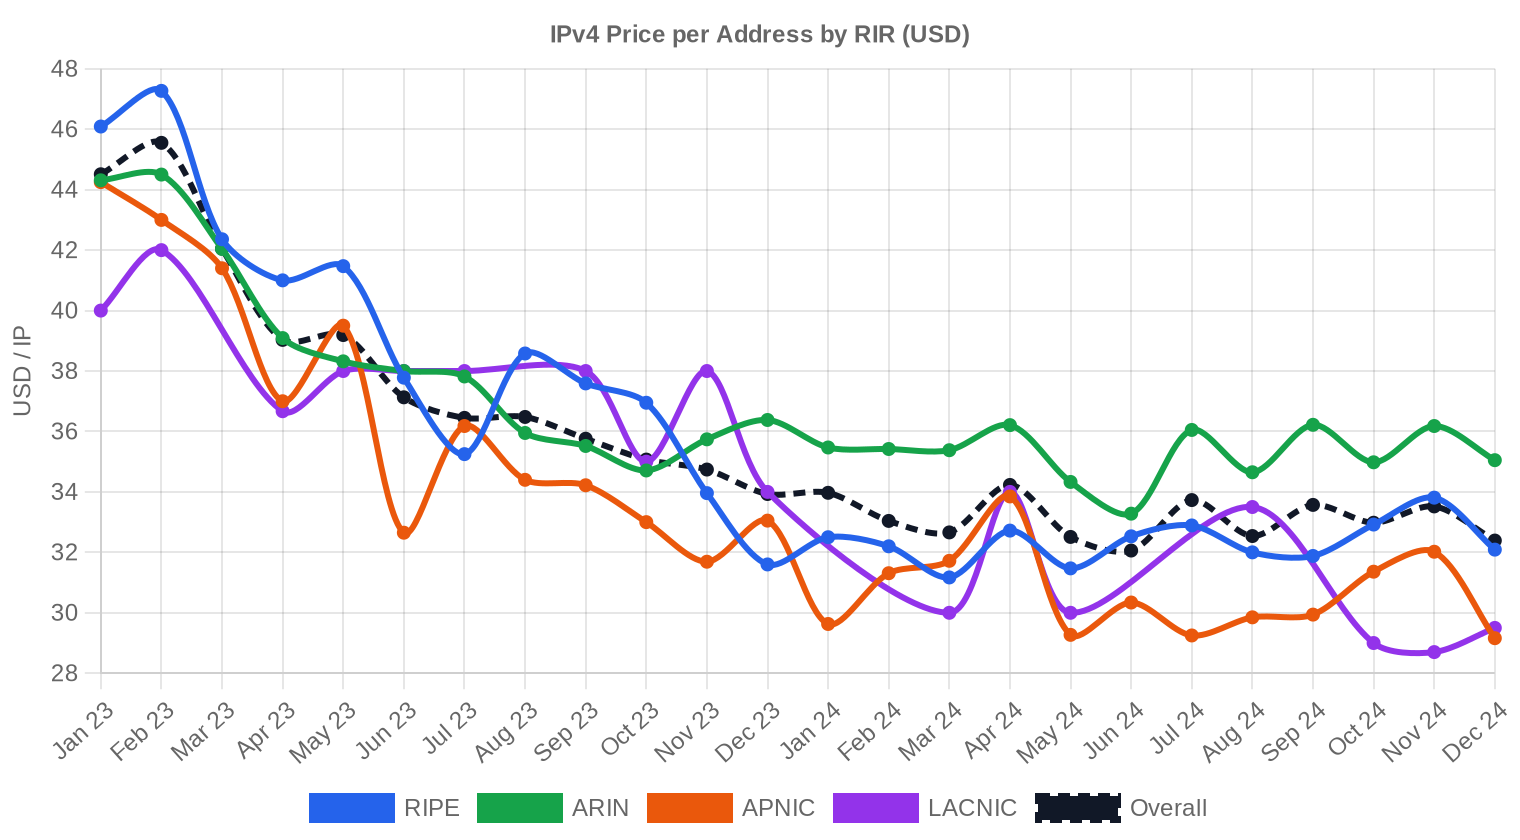
Prices ranged from $24 to $50 per IP in Q1, a $26 spread that reflects the persistent premium attached to clean, small ARIN blocks versus bulk LACNIC inventory. The $33 median sat close to the $33.48 average, indicating a reasonably symmetric distribution without major outlier distortion. The 1.9% quarter-over-quarter increase extends a modest upward drift that has characterized the market since mid-2024, when the initial shock from AWS's public IPv4 charging policy worked through the system. Year-over-year, the average is up just $0.20 — effectively flat — which tells us the market has found a trading range rather than a directional trend. The min-max spread widened slightly versus Q4, driven primarily by a handful of premium /24 transactions at the top end.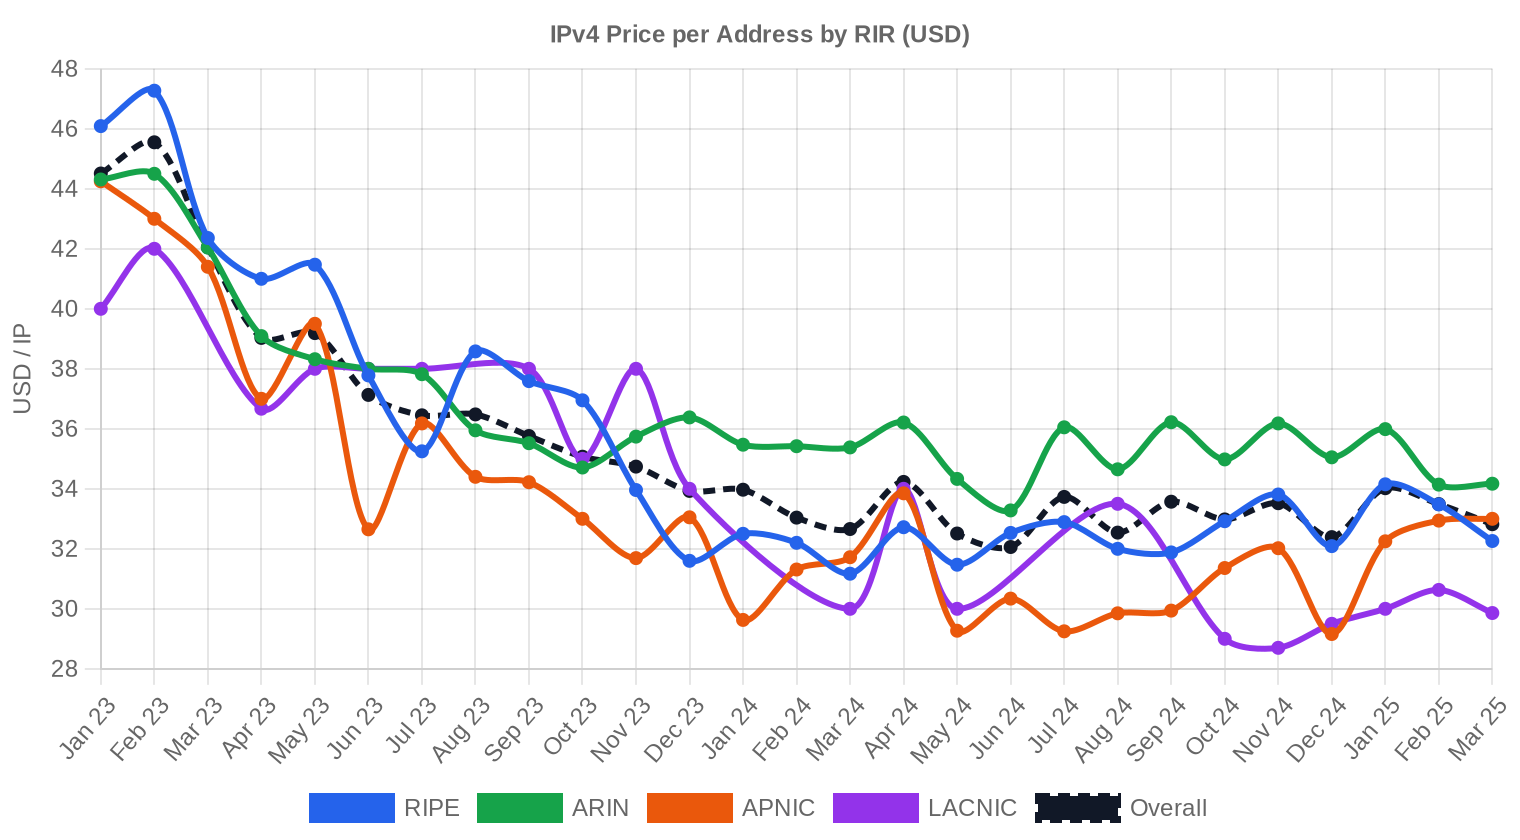
Pricing by RIR
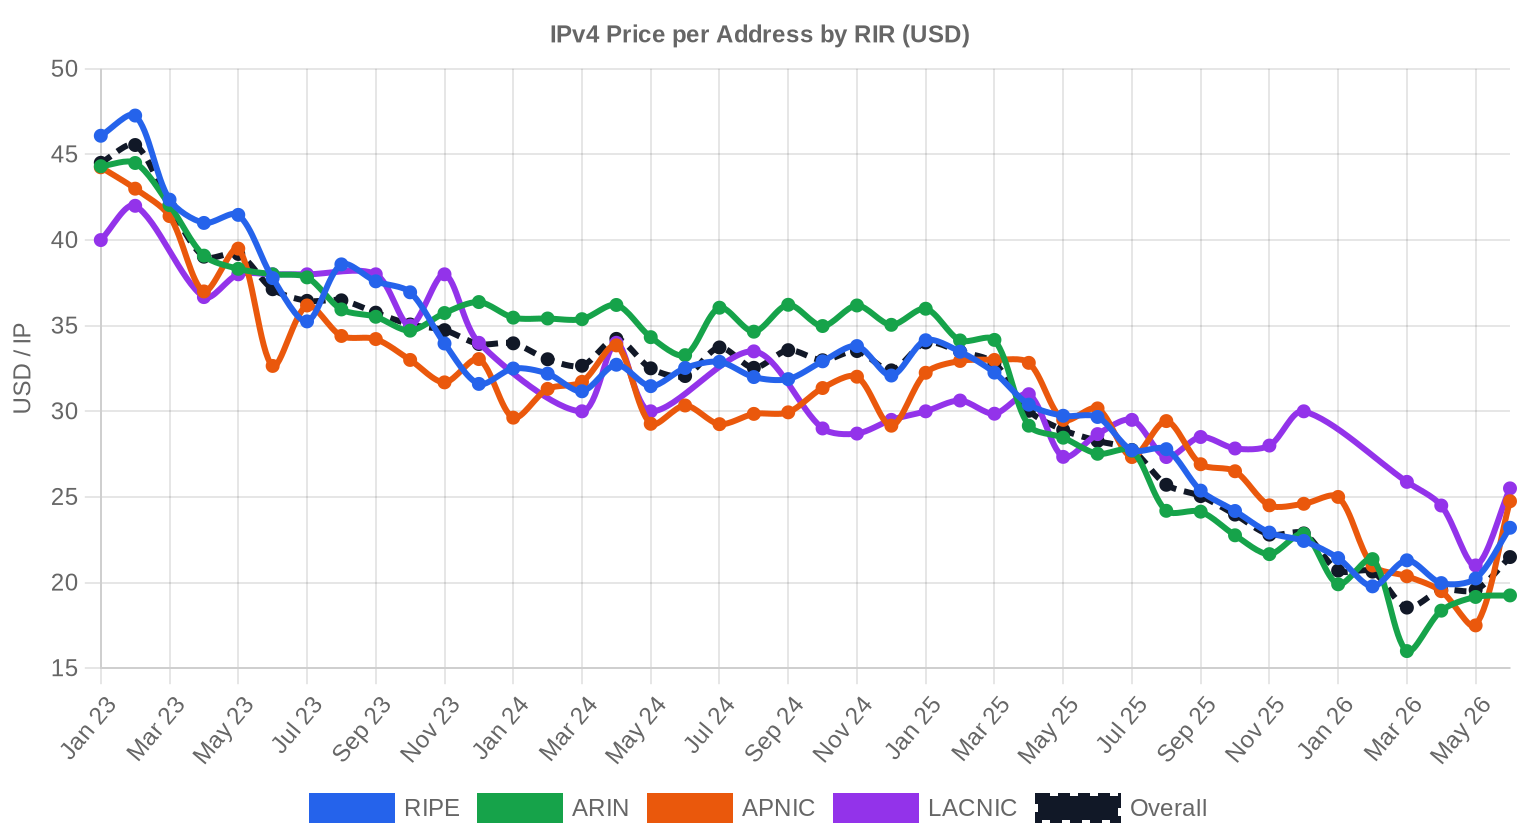
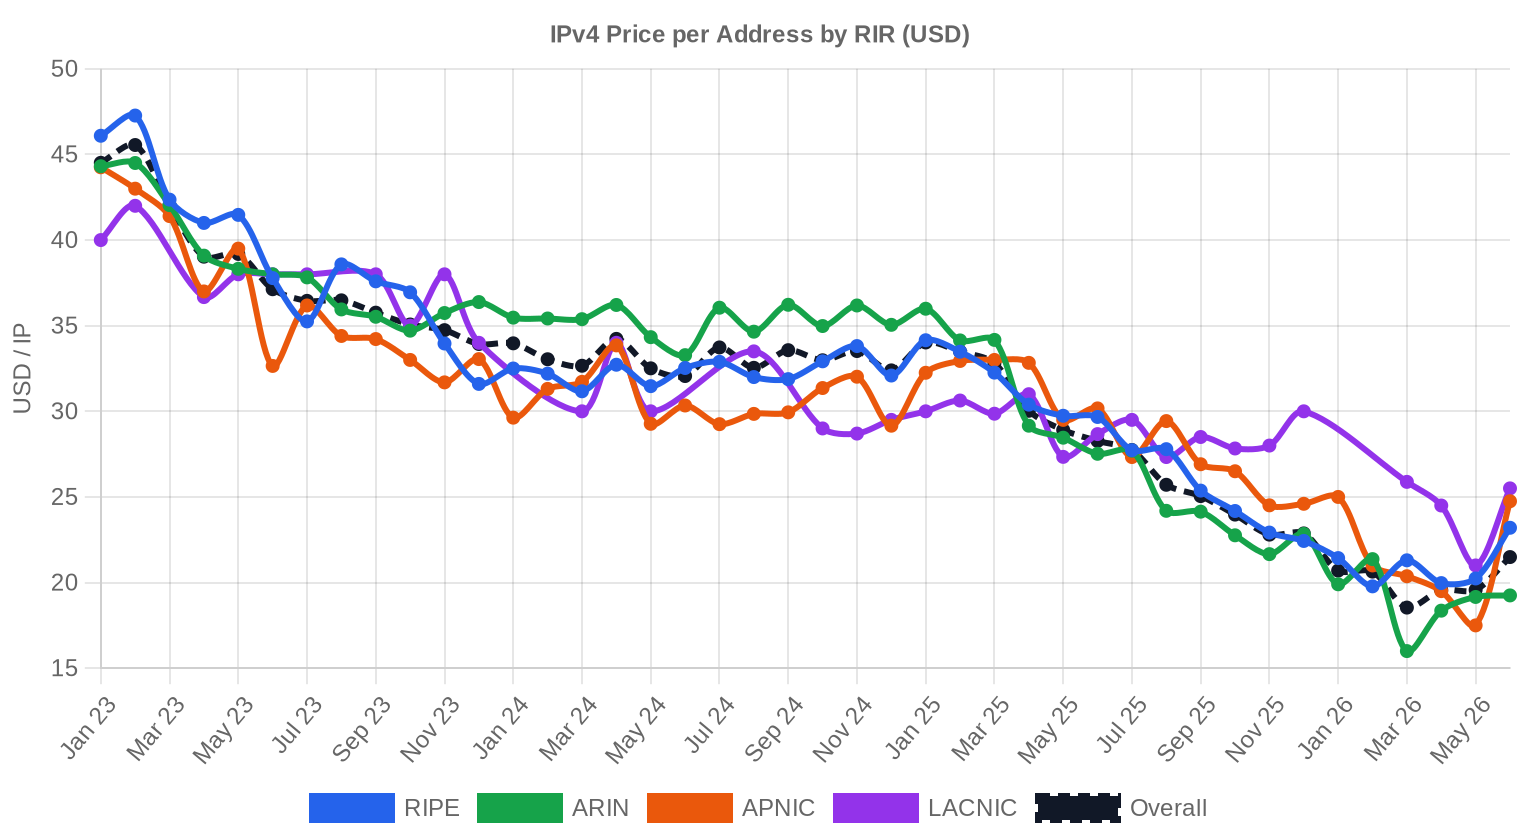
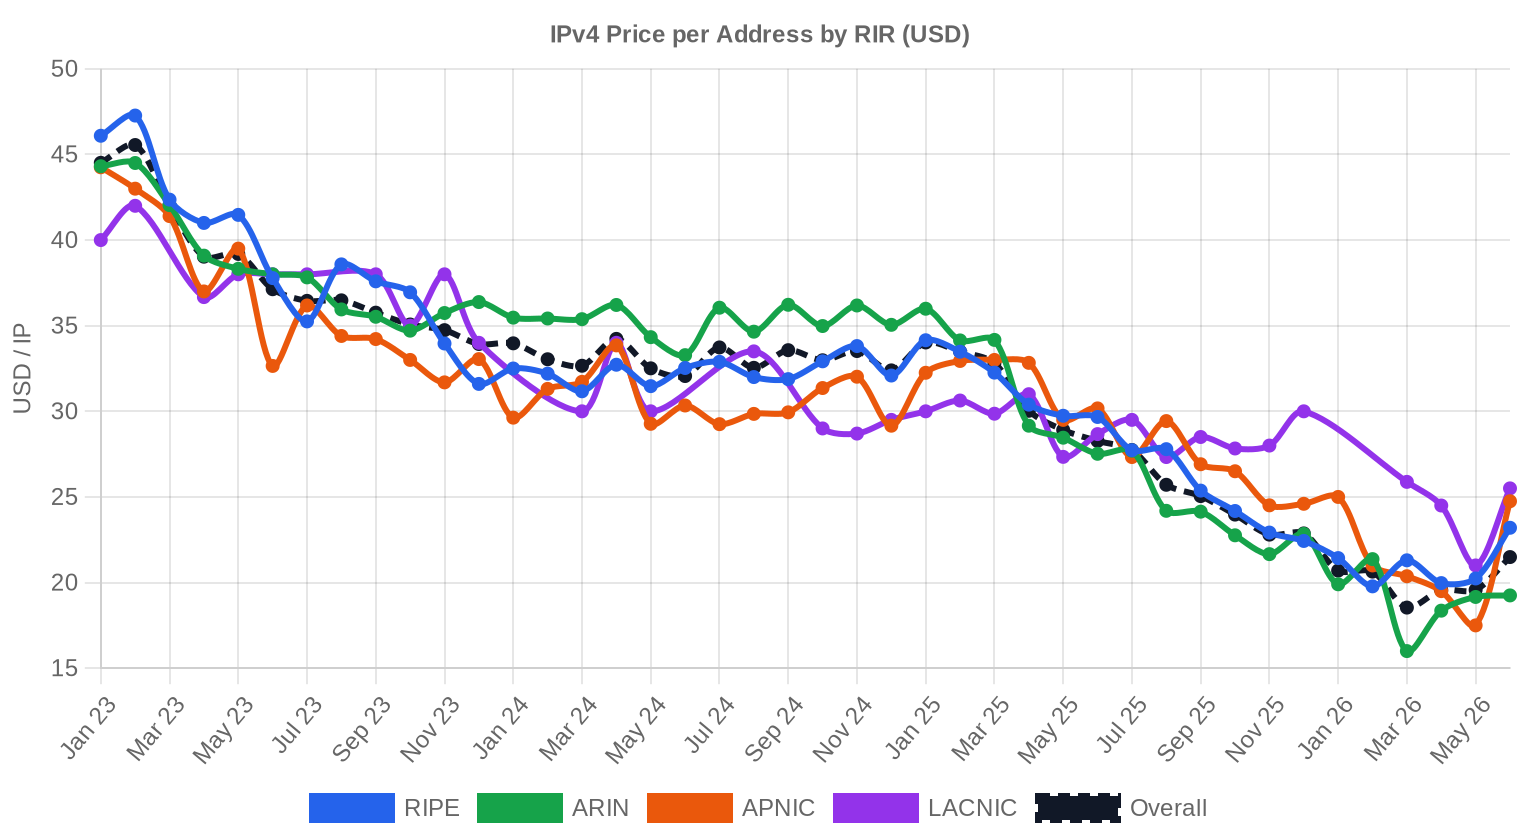
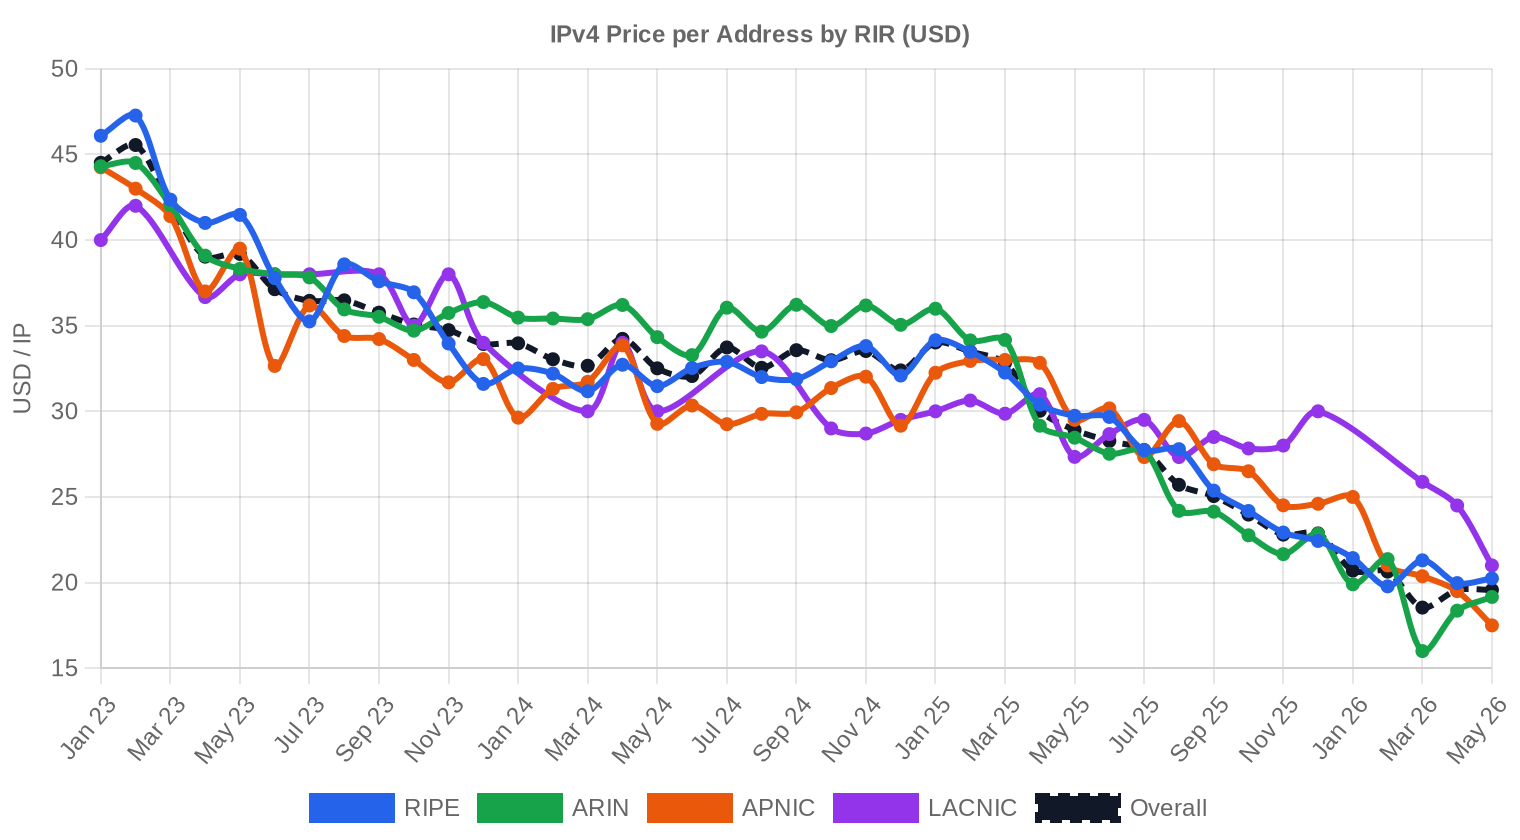
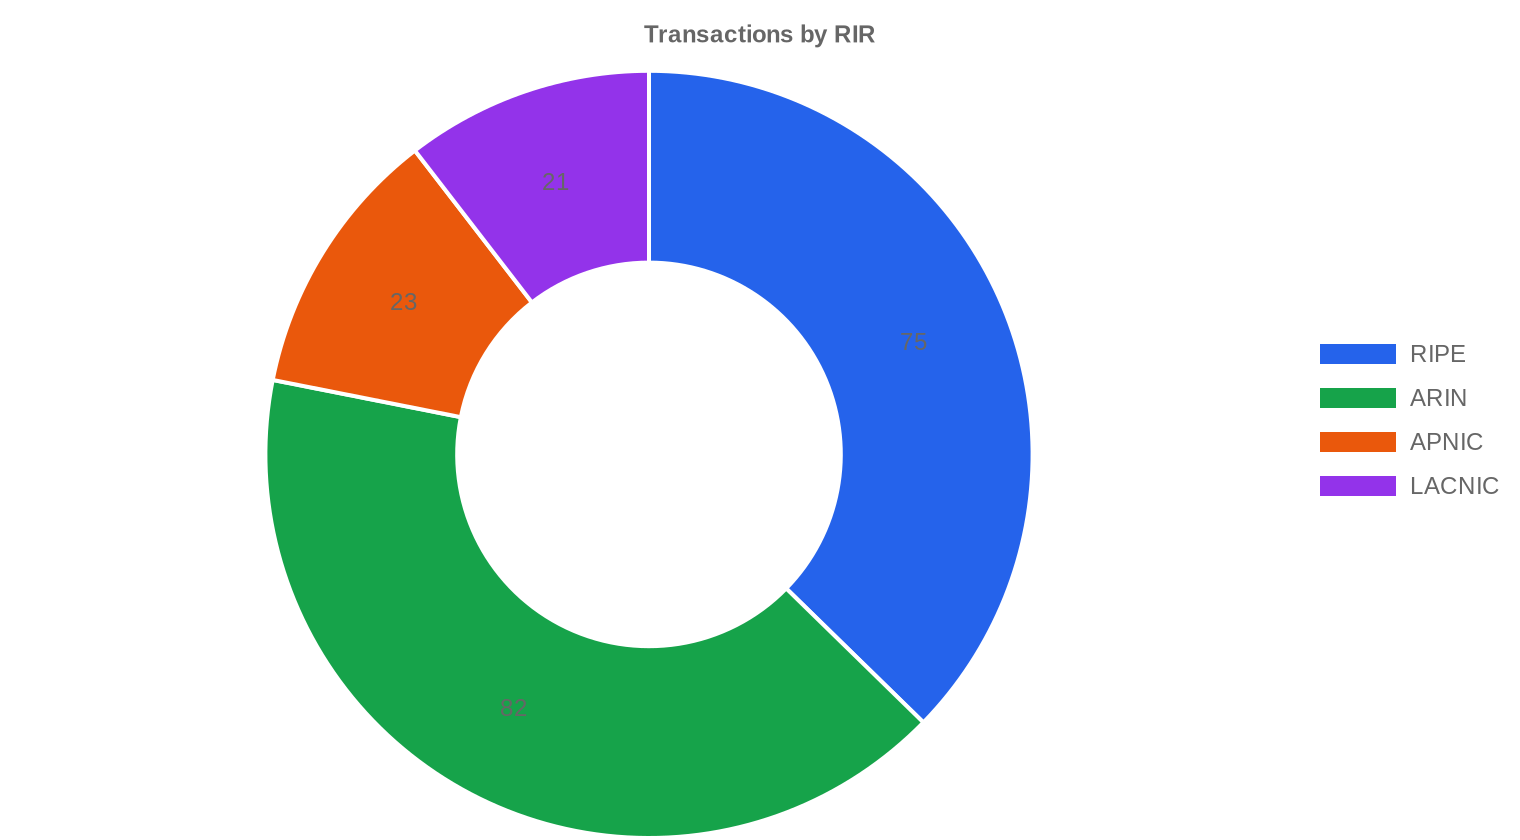
ARIN commands the highest pricing at $34.81 per IP and the largest transaction share, a pattern that has held for several consecutive quarters now. RIPE blocks traded at $33.25, a gap of just $1.56 versus ARIN — the narrowest inter-registry spread we've tracked in recent memory. APNIC came in at $32.59 across a thin 23-deal sample, while LACNIC was the discount registry at $30.07, consistent with its limited buyer pool and transfer complexity. AFRINIC recorded zero transactions for the quarter, extending its effective freeze.ARIN: $34.81/IP across 82 transactions (59.5% of total IP volume)
RIPE: $33.25/IP across 75 transactions (28.2% of total IP volume)
APNIC: $32.59/IP across 23 transactions (4.0% of total IP volume)
LACNIC: $30.07/IP across 21 transactions (8.3% of total IP volume)
AFRINIC: No recorded transactions
| RIR | Transactions | Avg $/IP | Median $/IP | IPs Traded | RIR Transfers | Next Month (proj.) | Year-End (proj.) |
|---|---|---|---|---|---|---|---|
| RIPE | 75 | $33.25 | $33.00 | 206,848 | 1,065 | $33.00 | $34.00 |
| ARIN | 82 | $34.81 | $34.53 | 436,736 | 2,446 | $35.00 | $35.50 |
| APNIC | 23 | $32.59 | $31.50 | 29,696 | 0 | $33.00 | $34.50 |
| LACNIC | 21 | $30.07 | $30.00 | 61,184 | 0 | $30.00 | $30.50 |
Transaction Volume
Supply & Block Sizes
/24 blocks dominated the market with 71 transactions — roughly 35% of all deals — confirming that small-lot demand from enterprises and SMB hosting providers continues to drive the bulk of deal flow. The average deal size rose to 114,064 IPs from 108,165 in Q4, pulled higher by six transactions exceeding $1 million that collectively accounted for $14.3 million — 62% of total market value. This bifurcation between high-frequency /24 trades and sporadic large-block institutional deals defines the current supply picture.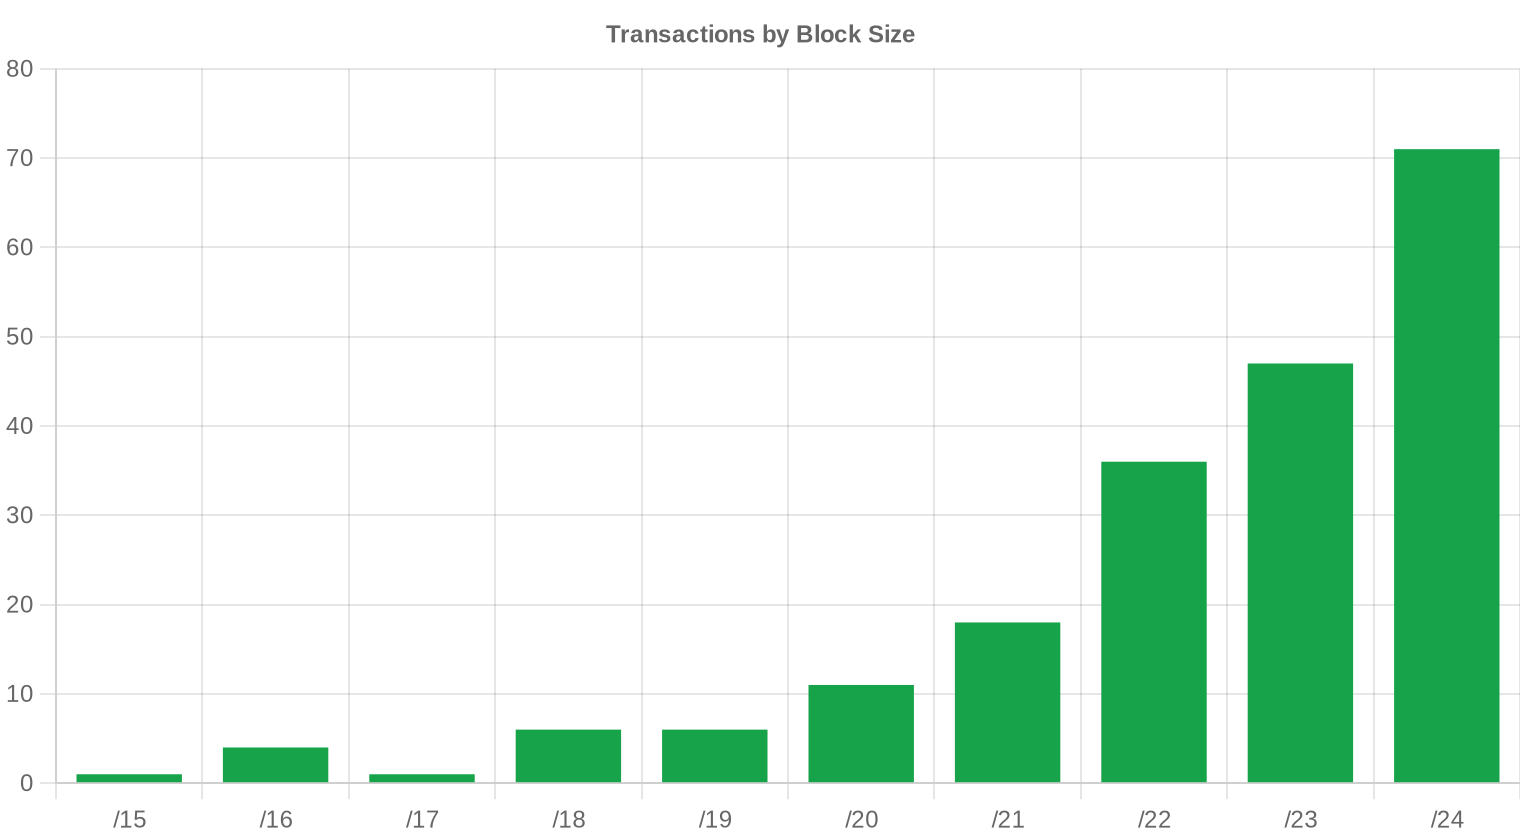
Geographic Activity
Country-level distribution data was not available for Q1 2025. Based on RIR share — ARIN at 40.8% and RIPE at 37.3% of transactions — the U.S. and Western Europe remain the primary trading theaters, consistent with prior quarters.Registry Transfer Activity
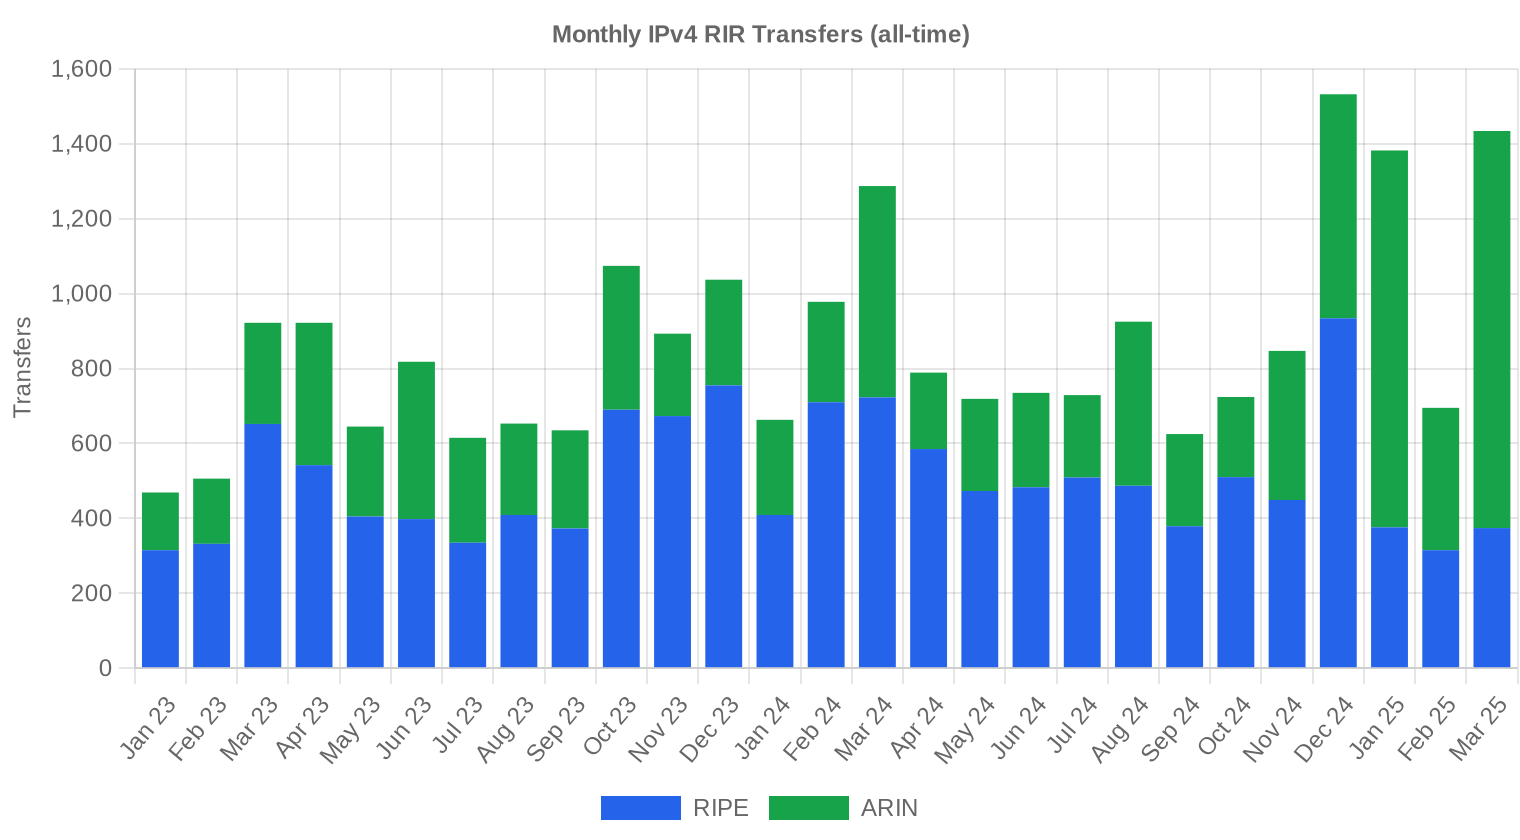
Official RIR transfer records totaled 3,511 in Q1 2025, with ARIN accounting for 2,446 transfers (69.7%) and RIPE recording 1,065 (30.3%). The ARIN-heavy skew reflects both its larger address pool and the relative ease of its transfer process compared to other registries. Neither APNIC nor LACNIC reported transfer data for the quarter.Long-Run Transfer Trends
Over the trailing 27 months, 23,253 total transfers have been recorded across all registries — a dataset large enough to identify structural patterns. The peak month was December 2024, consistent with the year-end tax and budget cycle that reliably drives Q4 activity spikes. RIPE holds 58.5% of the cumulative 27-month transfer share versus ARIN's 41.5%, though ARIN has been gaining ground in recent quarters as its transfer pipeline has cleared pandemic-era backlogs.| RIR | RIR Transfers |
|---|---|
| RIPE | 13,595 |
| ARIN | 9,658 |
| RIR Transfers | 23,253 |
Outlook & Forecast
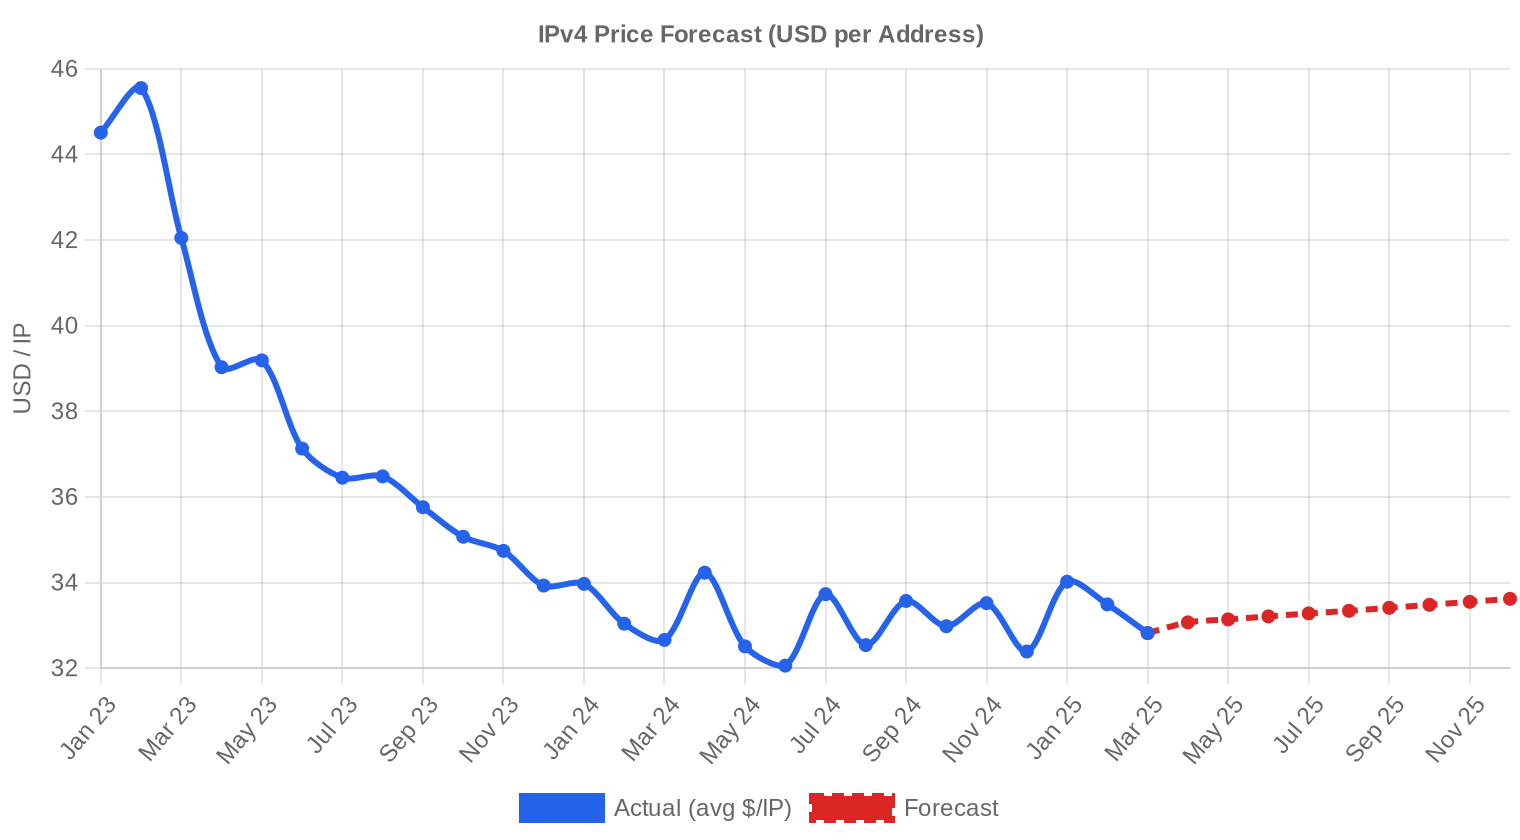
Forecasting each block-size band and RIR separately with our AI model:
The overall average price per IP is projected to reach $33.62 by December 2025, with a next-month estimate of $32.75 per IP.
- RIPE: projected at $33.00 per IP next month, trending toward $34.00 by December 2025.
- ARIN: projected at $35.00 per IP next month, trending toward $35.50 by December 2025.
- APNIC: projected at $33.00 per IP next month, trending toward $34.50 by December 2025.
- LACNIC: projected at $30.00 per IP next month, trending toward $30.50 by December 2025.
- AFRINIC: insufficient data for a reliable forecast.
Forecast by Block Size
| Block | Current $/IP | Next Month | Year-End | Confidence |
|---|---|---|---|---|
| /24 | $33.50 | $34.00 (+1.5%) | $35.00 (+4.5%) | medium |
| /23 | $33.00 | $33.00 (0.0%) | $34.00 (+3.0%) | medium |
| /22 | $31.00 | $31.50 (+1.6%) | $32.00 (+3.2%) | medium |
| /21 | $30.00 | $31.00 (+3.3%) | $31.50 (+5.0%) | low |
| /20 | $32.00 | $32.50 (+1.6%) | $34.00 (+6.3%) | low |
| /19 | $32.50 | $32.50 (0.0%) | $33.00 (+1.5%) | low |
| /18-/16 | $30.00 | $30.00 (0.0%) | $31.00 (+3.3%) | low |
| /15-up | $34.00 | $33.00 (-2.9%) | $33.00 (-2.9%) | low |
Editor's Take: Buy vs. Lease
The buy-versus-lease math is straightforward this quarter. At $33.48 per IP purchase price and $0.5859 per IP monthly lease cost, the breakeven sits at 57.1 months — just under 4.8 years. That's well inside our 90-month threshold, which means buying remains the preferred strategy for any organization planning to hold addresses for five years or more. At a 21% implied annual yield, the lease market is pricing in either significant capital appreciation risk or a shorter useful life for IPv4 than we think is realistic. For buyers with balance sheet capacity, acquiring blocks at current levels still makes economic sense. For cash-constrained operators who need addresses for two to three years, leasing avoids tying up capital in a flat-to-slowly-appreciating asset.| /24 Purchase price | $8,571 |
| /24 Lease price | $150 / mo |
| Payback period | 57.1 mo (4.8 yr) |
| Gross annual yield | 21.0% |

What This Means for You
Buyers: Prices are stable and the market is liquid enough to source blocks across all active RIRs. If you need ARIN space, expect to pay the $34-35 range; LACNIC offers $4-5/IP savings if your routing topology supports it. There's no urgency premium right now — take time to negotiate.Sellers: The 21.2% drop in transaction count signals that buyers aren't chasing inventory. If you're sitting on clean ARIN blocks, you can still extract full market pricing, but listing-to-close timelines may stretch. Pricing your block at the median ($33-34) will move faster than reaching for the top of the range.
Leasers: At $0.59/IP/month for RIPE space, leasing remains viable for short-duration needs. The 57-month breakeven means anything under four years favors leasing; longer commitments should evaluate a purchase.
Block Holders: A 21% annualized yield on leased-out space is attractive passive income. If you're not using your allocation, the lease market is well-established enough to generate meaningful returns without surrendering ownership.
Browse verified IPv4 blocksSell IPv4 →
List your blocks with managed transferLease IPv4 →
Flexible short-term capacityLease Out IPv4 →
Turn idle blocks into recurring revenue
IPv4 Pricing by Block Size
The /24 premium remains the defining feature of IPv4 pricing. Single /24 blocks routinely trade at $35-42 per IP in the ARIN and RIPE regions, while /16 and larger blocks clear at $28-32 — a discount that reflects both the capital commitment required and the narrower buyer universe for large allocations. Six deals above $1 million accounted for $14.3 million of the quarter's $22.9 million total value, underscoring how much dollar volume concentrates in a handful of institutional-scale trades.| Block | IPs | Buy: /IP | Buy: Total | Lease: /IP/mo | Lease: Monthly |
|---|---|---|---|---|---|
| /24 | 256 | $35–45 | $8,960–11,520 | $0.38–0.50 | $97–128 |
| /22 | 1,024 | $28–38 | $28,672–38,912 | $0.33–0.45 | $338–461 |
| /20 | 4,096 | $22–32 | $90,112–131,072 | $0.30–0.40 | $1,229–1,638 |
| /18 | 16,384 | $20–30 | $327,680–491,520 | $0.30–0.38 | $4,915–6,226 |
| /16 | 65,536 | $18–28 | $1,179,648–1,835,008 | $0.30–0.35 | $19,661–22,938 |
IPv4 Price History: 2011–2026
IPv4 pricing has traveled a long arc since IANA exhaustion in 2011, when the first arms-length transfers priced around $5-7 per IP. The market peaked near $55-60 per IP in early 2023 before AWS's decision to charge $0.005/hour for public IPv4 addresses triggered a repricing. That shock pushed averages down into the low-to-mid $30s, where they've stabilized for roughly four quarters now. The current $33.48 average represents a market that has absorbed the AWS-era adjustment and is trading on its own fundamentals — supply scarcity versus the slow grind of IPv6 migration.| Year | ~Price/IP | Key Event |
|---|---|---|
| 2011 | $7–12 | IANA free pool exhausted; Microsoft/Nortel deal ($11.25/IP) |
| 2012 | $8–12 | RIPE NCC reaches last /8; begins /22-only allocation |
| 2014 | $10–15 | LACNIC free pool exhausted |
| 2015 | $8–15 | ARIN free pool exhausted |
| 2017–18 | $12–18 | Leasing market grows; cloud demand rises |
| 2019 | $18–24 | RIPE NCC exhausts remaining free pool |
| 2021–22 | $50–60+ | Post-pandemic peak; hyperscaler build-outs |
| 2024 | $35–52 | AWS IPv4 charge ($0.005/IP/hr); large block correction |
| 2025–26 | $18–45 | Market bifurcation; /16s below $20 for first time since 2019 |
Market Structure: Who Is Buying & Selling
The buy side is dominated by mid-tier cloud providers, regional ISPs expanding broadband footprints, and enterprise IT departments with hybrid infrastructure needs. AI-focused data center operators have emerged as a visible buyer cohort over the past two quarters. On the sell side, legacy corporate holders continue to monetize unused allocations, joined by bankruptcy estates and private equity portfolio companies optimizing asset rosters.IPv4 vs. Other Asset Classes
At a 21% implied annual yield on leased IPv4 space, the asset class outperforms most conventional alternatives on a current-income basis. U.S. 10-year Treasuries yield roughly 4.2%, investment-grade corporate bonds 5-6%, and Class A commercial real estate cap rates sit around 6-7%. The catch is liquidity — IPv4 blocks take weeks to transfer and the market lacks centralized price discovery — but for patient holders, the risk-adjusted return profile is difficult to replicate in traditional fixed-income portfolios.| Asset Class | Typical Yield | Liquidity | Primary Risk |
|---|---|---|---|
| IPv4 | 21.0% | Moderate | IPv6 adoption, block quality |
| Commercial Real Estate | 5–8% | Low | Vacancy, rate cycle |
| Investment-Grade Bonds | 4–5% | High | Duration, credit risk |
| S&P 500 | ~1,3% | High | Market volatility |
| Money Market / T-Bills | ~4–5% | High | Rate cycle changes |
IPv6 Adoption & Why IPv4 Remains Essential
IPv6 adoption continues its glacial advance. Google's public data shows roughly 45% of users reaching its services over IPv6, but the long tail of enterprise applications, legacy devices, and content delivery systems still requires IPv4 connectivity. Dual-stack will remain the operational reality for at least another decade, and as long as that's the case, IPv4 retains functional — and therefore monetary — value.AI & Cloud Infrastructure Demand
The buildout of AI training clusters and inference infrastructure is generating incremental IPv4 demand that didn't exist 18 months ago. GPU-dense data centers need routable address space for API endpoints, model serving, and internal orchestration that isn't easily NATed. Several Q1 transactions in the /20 to /18 range appear linked to AI-focused hosting operators, though direct attribution remains difficult given the opacity of buyer identities.What Determines IPv4 Block Value
Not all IPv4 space trades equally. Clean blocks with no blacklist history, a long allocation provenance, and an ARIN or RIPE registry home command the top of the range — $38-50 per IP for /24s in Q1. Blocks with spam or abuse history, recent registry changes, or LACNIC/AFRINIC registrations trade at meaningful discounts. Transferability — how quickly and cleanly a block can move between parties — is the single biggest pricing variable after size.Sell vs. Lease: A Decision Framework
In a flat pricing environment like Q1 2025, the sell-versus-lease calculus tilts toward leasing for holders who don't need immediate liquidity. At $7.03 per IP annually, a holder recoups the full market value of a block in under five years while retaining the asset. Selling makes sense when a holder expects prices to decline, needs a lump-sum capital event, or can't manage the operational overhead of tenant provisioning and abuse monitoring.| /24 Purchase price | $8,571 |
| /24 Lease price | $150 / mo |
| Payback period | 57.1 mo (4.8 yr) |
| Gross annual yield | 21.0% |
RIPE NCC 24-Month Transfer Restriction
RIPE's 24-month holding period before a block can be transferred continues to act as a supply governor. Any block acquired through RIPE's transfer market today won't be re-sellable until Q1 2027 at the earliest, which constrains short-term speculative flipping and reduces secondary market velocity. The rule also creates a planning premium — buyers factor in the illiquidity period, which paradoxically supports prices by keeping flipped inventory off the market.Deal Size Distribution
The market's deal-size distribution is heavily skewed toward small transactions: 154 of 201 deals (76.6%) fell below $50,000, totaling just $2.6 million. At the other end, six deals over $1 million accounted for $14.3 million — 62.2% of the quarter's total value. The middle tiers (29 deals between $50K-$250K and 12 between $250K-$1M) contributed $7.7 million combined. Average deal size rose to 114,064 IPs from 58,021 a year ago, nearly doubling — driven entirely by the outsized impact of a few large-block institutional trades.Top Trading Countries
Granular country-level data was unavailable for Q1 2025. The RIR distribution — ARIN at 40.8%, RIPE at 37.3% of deals — points to the United States, Canada, and the EU-15 as the dominant geographies, consistent with historical patterns. APNIC's 23 transactions likely concentrate in Australia, India, and Southeast Asia based on prior-quarter trends.BEAD Broadband Program Impact
The $42.45 billion BEAD broadband program is entering its disbursement phase, and the downstream effect on IPv4 supply is beginning to materialize. Regional ISPs and fixed wireless operators receiving BEAD grants need routable address space for subscriber networks — typically /20 to /18 blocks — and many lack existing allocations. As build-out timelines compress through 2025 and 2026, expect BEAD-funded demand to compete directly with enterprise buyers in the mid-size block market.Hyperscaler IPv4 Holdings
Amazon, Microsoft, and Google collectively hold millions of IPv4 addresses, much of it acquired through corporate acquisitions and early allocations rather than open-market purchases. Amazon's 2023 decision to charge for public IPv4 addresses effectively put a floor under market pricing by making previously free addresses carry a visible cost. None of the hyperscalers are net sellers — their strategy is to hold and optimize utilization — which removes a potential supply overhang that could otherwise depress prices.Macroeconomic Conditions & Market Impact
Interest rates remain elevated relative to the 2020-2022 period, which raises the hurdle rate for IPv4 as a capital investment. That said, enterprise IT budgets for 2025 are broadly stable to slightly up, and infrastructure spending — particularly on cloud and connectivity — continues to be prioritized over discretionary software purchases. The macro backdrop is neutral for IPv4 demand: no tailwind, no headwind.Model Update & Calibration
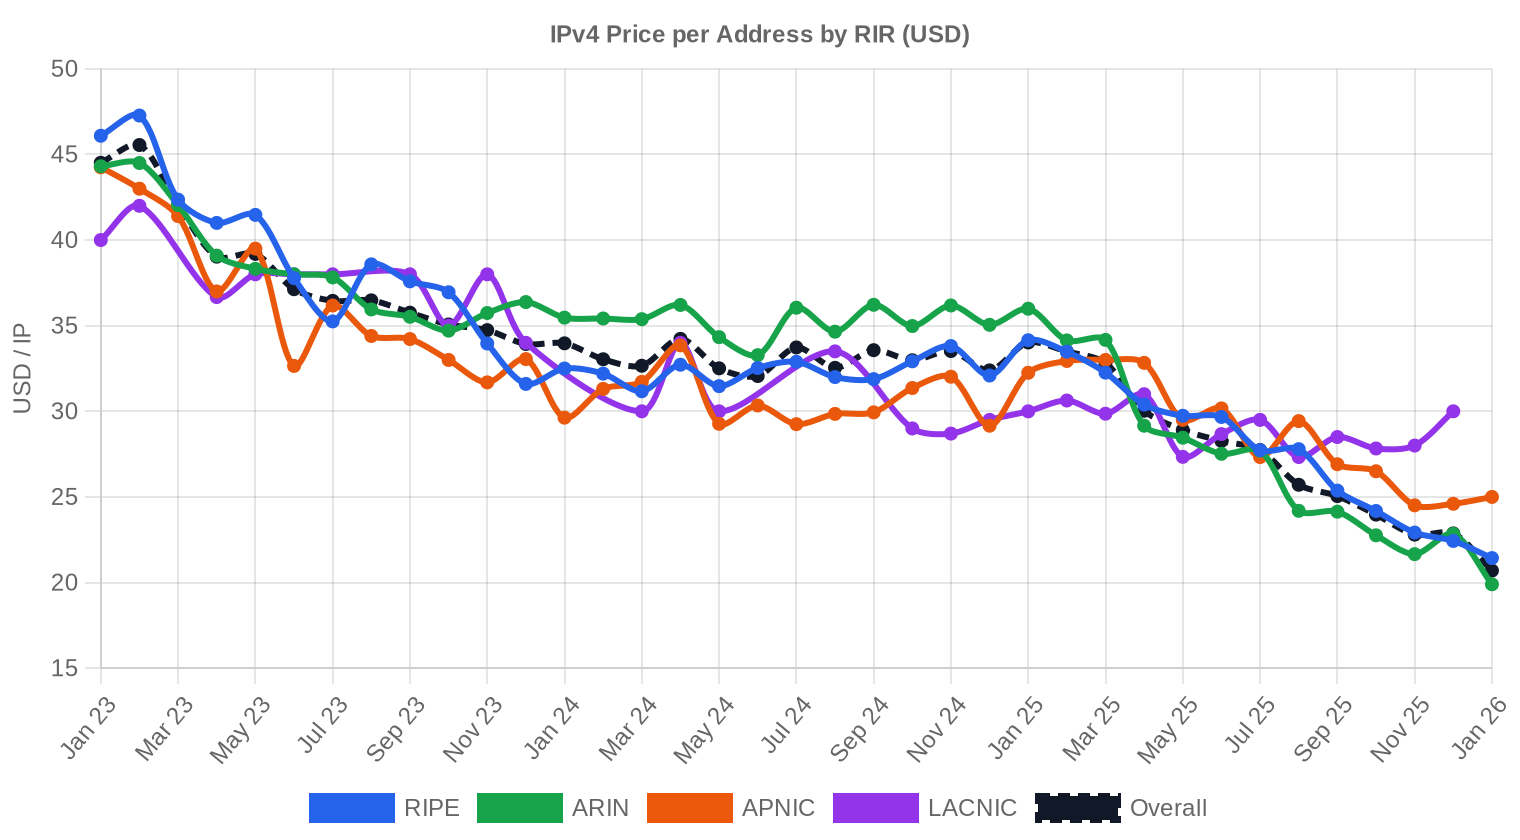
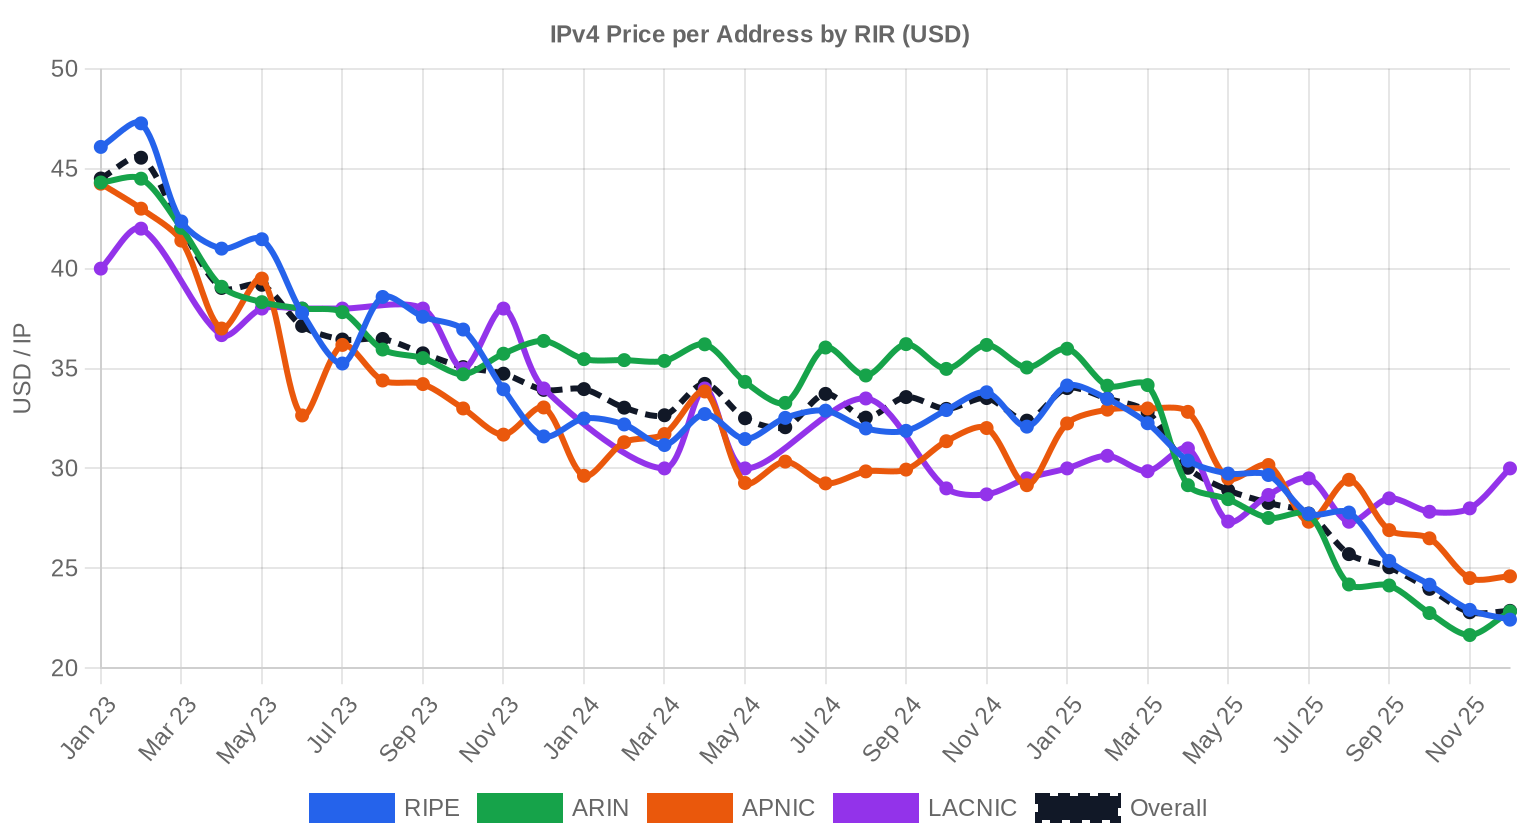
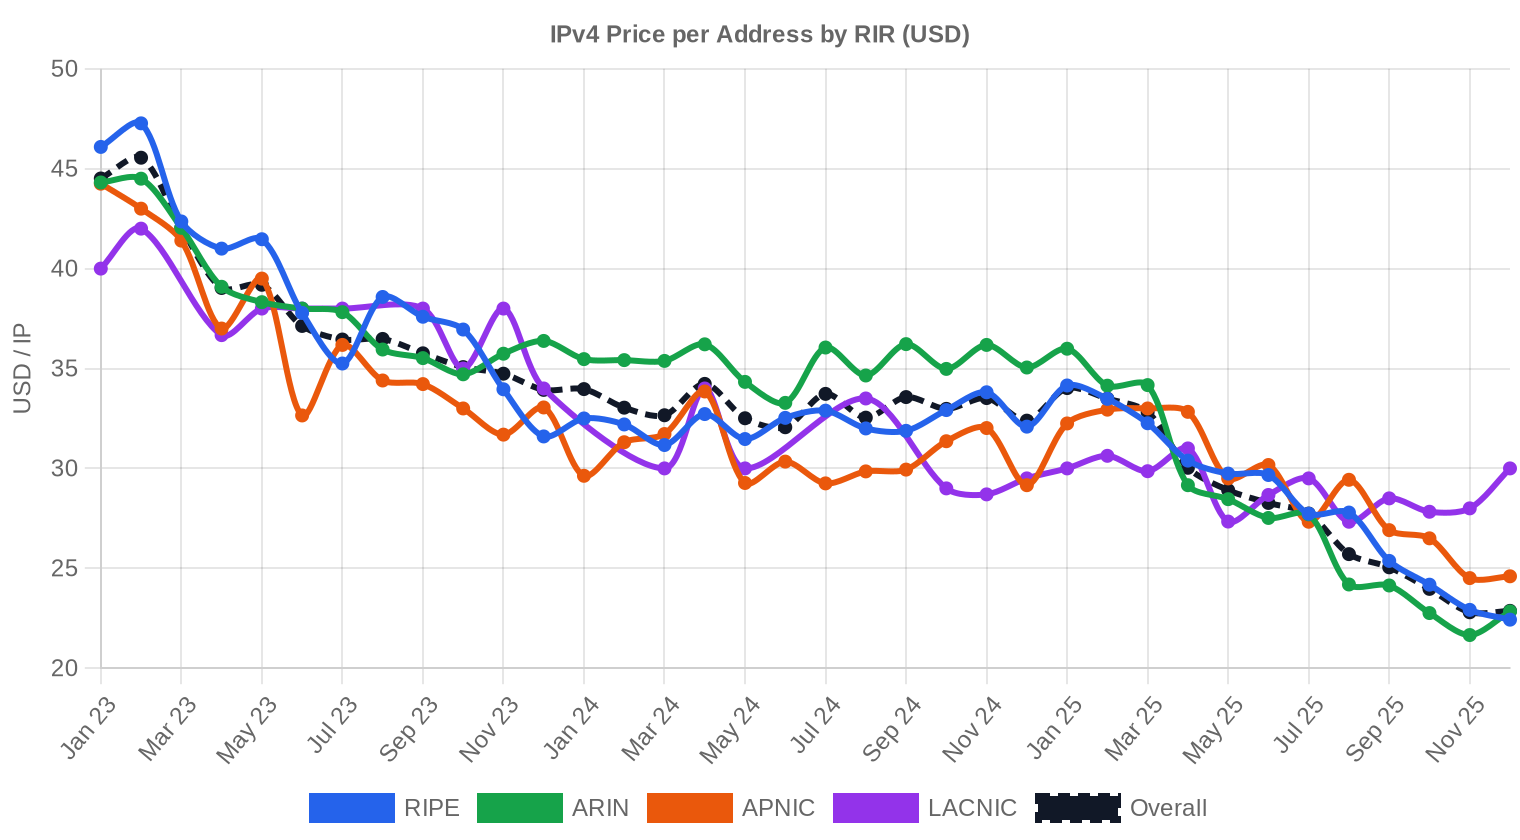
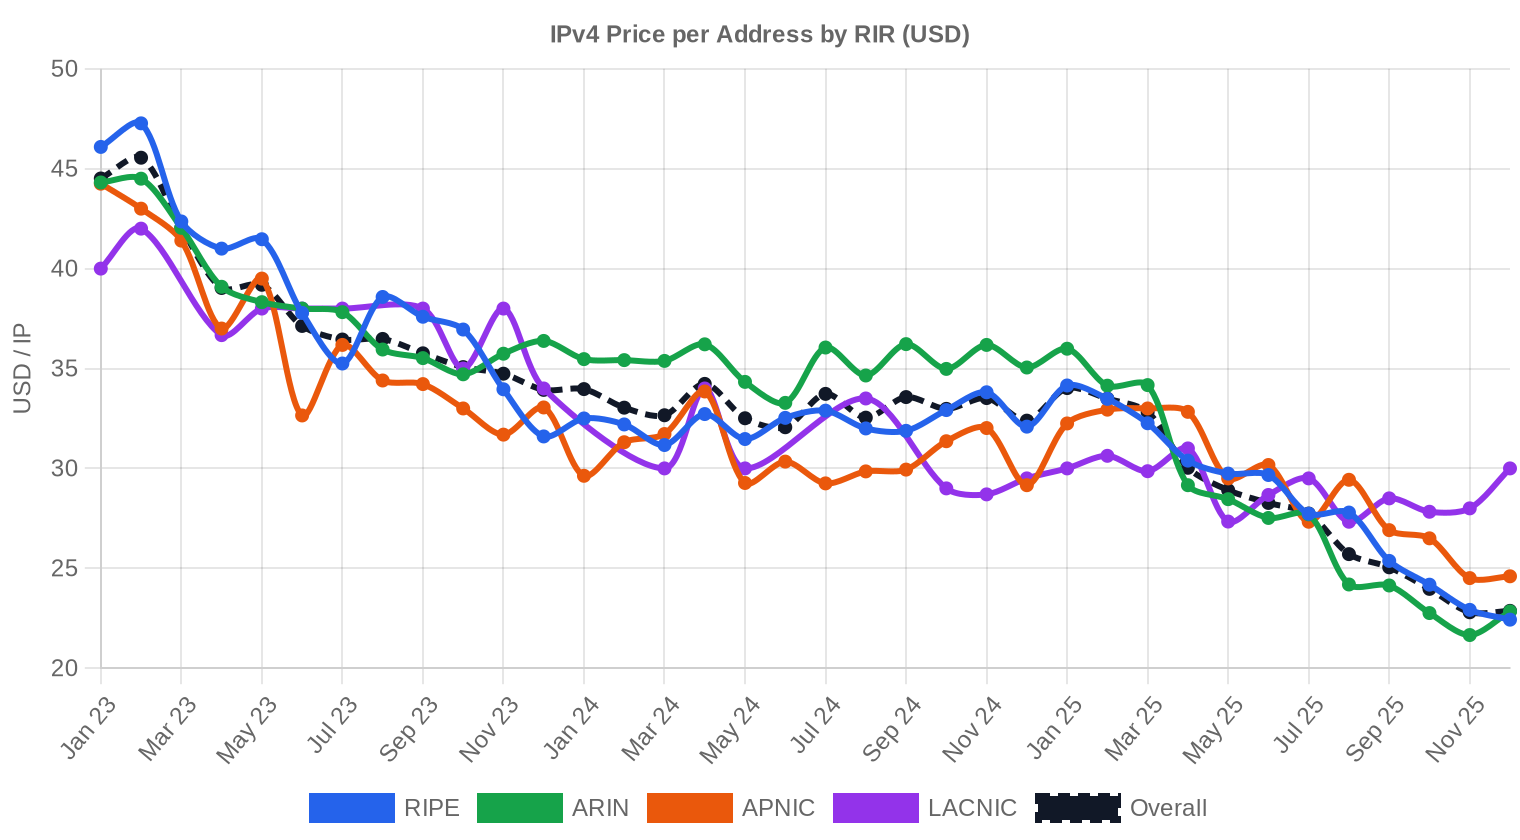
As part of our continuous improvement process, we backtested previous forecasts against realised prices and fine-tuned the model accordingly. Recent months now carry more influence than older data, and the confidence bands have been widened or narrowed based on how well they captured actual outcomes in the past. You can see the full backtest results in the table and chart below.
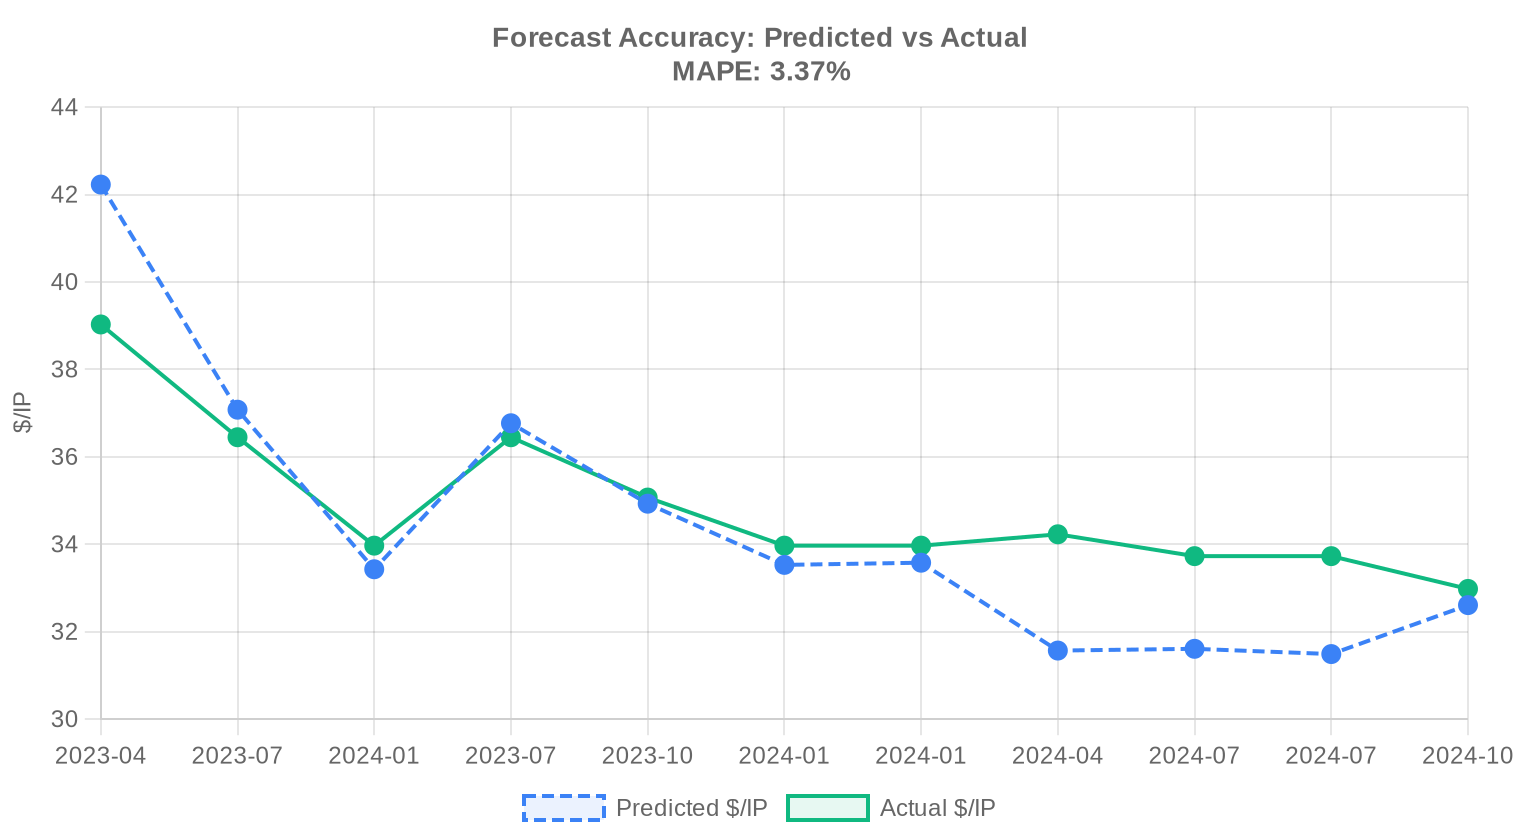
| Report Period | Target Month | Predicted | Actual | Deviation |
|---|---|---|---|---|
| 2023-H2 | 2024-01 | $34 | $34 | -1% |
| 2023-Q4 | 2024-01 | $34 | $34 | -1% |
| 2024-Q1 | 2024-04 | $32 | $34 | -8% |
| 2024-H1 | 2024-07 | $32 | $34 | -6% |
| 2024-Q2 | 2024-07 | $31 | $34 | -7% |
| 2024-Q3 | 2024-10 | $33 | $33 | -1% |
Methodology
Figures are based on completed IPv4Center marketplace transactions and RIR transfer statistics. Prices are in US dollars per IP address. Forecasts are produced by an AI model that analyses each block-size band and RIR segment separately (with outlier-trimmed medians) alongside known market catalysts; they are estimates, not guarantees.
Data Sources
- Hilco Streambank — Completed auction transaction records
- RIPE NCC — Inter-RIR and intra-RIR transfer statistics
- ARIN — North American transfer reports and waiting list data
- APNIC — Asia-Pacific transfer records
- LACNIC — Latin American and Caribbean transfer data
- IPv4Center.com — Proprietary marketplace transaction and lease pricing data
This report is generated automatically for informational purposes only and does not constitute financial advice.
Frequently Asked Questions
What was the average price per IPv4 address in Q1 2025?
The global weighted average landed at .48 per address, with the median at . Prices ranged from a floor of on distressed or small-lot ARIN blocks to a ceiling of on premium inventory.
How many IPv4 transfer transactions were recorded in Q1 2025?
We tracked 201 priced transactions covering 734,464 addresses, generating roughly .9 million in aggregate deal value. The broader market recorded 3,511 total inter-org transfers across all RIRs, the majority unpriced or private.
Which RIR commanded the highest per-IP prices in Q1 2025, and why?
ARIN, at .81 average per address — a 4% premium to the global mean. North American blocks benefit from perceived routing cleanliness, deeper buyer pools, and straightforward transfer policy. RIPE followed closely at .25; APNIC at .59; LACNIC trailed at .07.
Why did ARIN blocks trade at a premium to RIPE blocks this quarter?
ARIN's .81 average vs. RIPE's .25 reflects persistent demand from North American cloud, hosting, and enterprise buyers who prefer region-local resources. ARIN also accounted for 40.8% of all priced transactions by volume, the largest share of any registry.
Are LACNIC blocks really that much cheaper, and what's the catch?
At .07 average — roughly .74 below ARIN — LACNIC inventory is the market's discount shelf. The catch: transfer policy requires buyer membership and regional justification, the secondary market is thin (only 21 transactions), and some upstream transit providers apply routing penalties to Latin American prefixes outside their home region.
What was the most common block size traded in Q1 2025?
The /24 (256 addresses) dominated, accounting for 71 of 201 transactions — about 35% of deal count. This is consistent with smaller operators and startups buying the minimum routable unit. The average deal size across all transactions, however, was ~114,064 addresses, skewed by a handful of large portfolio trades.
Six deals exceeded million. What drove those large-block transactions?
Those six transactions totaled .3 million — 62% of the quarter's entire deal value from just 3% of transactions. Large-block trades at this scale typically involve cloud providers, CDNs, or private-equity-backed hosting roll-ups assembling contiguous address space for operational efficiency and routing simplicity.
Is the IPv4 market trending up or down heading into Q2 2025?
Up, marginally. Prices rose approximately 0.21% over the quarter. Our model projects a near-term dip to around .75 next month — likely seasonal softness — before recovering to .62 by year-end 2025. The trajectory is gradual appreciation, not a spike.
How reliable is the year-end .62 forecast?
Reasonably so. The forecast is flagged as statistically reliable, underpinned by 201 transactions and stable price dispersion. The median-to-mean spread of just .48 suggests a normally distributed market without extreme outlier distortion. That said, regulatory surprises or a major block dump could invalidate any model.
Should I buy IPv4 addresses or lease them at current rates?
At .48 per IP (buy) vs. .59/month per IP (lease), the breakeven is 57 months — roughly 4.8 years. If your planning horizon exceeds five years, buying is the clear winner. The implied annual yield for a lessor is 21%, which tells you leasing is expensive capital for the tenant.
What does the 21% implied annual yield on IPv4 leasing mean for investors?
It means a block purchased at .48 per IP and leased at .59/month per IP generates a gross annual return of roughly 21% — before brokerage, maintenance, and abuse-desk costs. That's an eye-catching yield in any asset class, which is precisely why institutional capital continues to flow into IPv4 portfolios.
How much does it cost to lease a single /24 block?
Based on 44 sampled lease transactions, the going rate is approximately 0 per month for a /24 (256 IPs), or about ,800 annually. Buying the same block outright would run roughly ,571 at Q1 2025 averages.
What mistakes should buyers avoid in the current market?
Three common errors: (1) overpaying for small lots when the median is — anything above on a standard /24 demands justification; (2) ignoring RIR-specific transfer timelines, which can stretch 30–90 days and kill deal economics if you're leasing in the interim; (3) skipping reputation checks on the block's abuse and blacklist history, which can render addresses operationally worthless.
What are the risks of buying APNIC-region blocks at the current .59 average?
APNIC saw only 23 transactions this quarter — a thin market that makes price discovery unreliable. Max prices hit , suggesting high variance. Additionally, APNIC's transfer policies require demonstrated need, and some blocks carry legacy routing baggage that can limit reachability outside Asia-Pacific.
Is it a mistake to assume IPv6 adoption will crash IPv4 prices soon?
Yes. That thesis has been circulating since 2012. IPv6 adoption is progressing, but the installed base of IPv4-only infrastructure — particularly in enterprise, IoT, and emerging markets — ensures sustained demand for years. Our Q1 data shows prices still grinding higher, not collapsing.
What risks does accelerating IPv6 deployment pose to IPv4 valuations long-term?
The real risk isn't sudden obsolescence; it's gradual demand erosion. If major cloud providers and mobile carriers complete their IPv6 transitions, the buyer pool for large blocks shrinks. We don't see this inflecting before 2028 at the earliest, but any IPv4 investment with a 10-year horizon should discount for it.
Why were there zero AFRINIC transactions in Q1 2025?
AFRINIC has been effectively frozen for secondary-market transfers since its governance crisis in 2022–2023. Ongoing legal disputes and policy uncertainty have made buyers and brokers unwilling to transact through the registry. Until governance stabilizes, AFRINIC blocks are essentially illiquid.
How does the ARIN vs. RIPE transfer volume compare this quarter?
ARIN recorded 2,446 total inter-org transfers versus RIPE's 1,065 — ARIN at 41.5% of global transfer volume, RIPE at 58.5% when measured over the trailing 27-month window. By priced deal count, ARIN edged RIPE 82 to 75. Both registries remain the market's twin liquidity engines.
What does the deal-size distribution tell us about market structure?
It's a classic power-law: 154 transactions (77%) were under K, representing just .6M in value. Meanwhile, 6 mega-deals (3%) accounted for .3M — 62% of total value. The market is bifurcated: a retail tier of small operators buying /24s and /23s, and an institutional tier moving six- and seven-figure blocks.
How long does a typical IPv4 transfer take to complete?
Timeline varies by RIR. ARIN transfers typically close in 30–45 days after both parties satisfy the Specified Transfer policy. RIPE tends to be faster at 2–4 weeks. APNIC and LACNIC can be unpredictable, sometimes stretching to 60–90 days. Escrow adds 3–5 business days on top.
What's the price floor, and who's selling at per IP?
The Q1 floor was , observed on ARIN blocks. Sub- deals typically involve legacy blocks with reputation issues, fragmented prefixes that are hard to route, or motivated sellers liquidating assets under time pressure — bankruptcy estates, M&A divestitures, and the like.
Who is paying – per IP, and is that rational?
The ceiling hit in ARIN; in APNIC. Buyers at these levels are typically acquiring small, clean, contiguous blocks with pristine reputation scores — often /24s needed for specific anti-spam or deliverability requirements. For email infrastructure or ad-tech, a clean /24 at can pay for itself in weeks.
What should a first-time buyer budget for a /24 block in Q1 2025?
At the global median of per IP, a /24 (256 addresses) runs about ,448. Add 5–8% for broker commissions and escrow fees, and you're looking at roughly ,900–,100 all-in. ARIN blocks will skew higher; LACNIC blocks lower.
Did transfer volumes peak recently, and are they declining?
The trailing 27-month dataset shows a peak month in December 2024, with 23,253 cumulative transfers over that window. Q1 2025 recorded 3,511 transfers — a healthy clip. We see no evidence of a structural decline; if anything, the market is maturing and becoming more liquid.
What are the risks of sitting on the sidelines and waiting for prices to drop?
The trend line is up 0.21% this quarter, and our year-end target is .62. Waiting has cost buyers roughly –8 per IP over the past three years. Supply is finite and shrinking — there are no new IPv4 addresses being minted. Procrastination is a strategy, just not a profitable one.