16 min read
This report analyzes the IPv4 transfer market for Q1 2026, based on completed IPv4Center marketplace transactions and official RIR transfer records.
Executive Summary
The IPv4 transfer market moved 3,355,136 addresses across 284 transactions in Q1 2026, generating $36.7 million in total value at an average price of $19.90 per IP. That average is down 14.1% from Q4 2025 and a stark 40.6% below Q1 2025 levels — the steepest annual decline we've tracked in this market's history. Transaction volume actually rose 20.9% quarter-over-quarter, meaning more deals closed at sharply lower prices. The median of $20.58 sitting above the mean suggests a cluster of small-block trades at modest premiums while larger blocks pulled the weighted average down. The trend line is unambiguously pointing lower.Market Overview
| Transactions | 284 |
| IP Addresses Traded | 3,355,136 |
| Estimated Market Value | $36,713,634 |
| Average Price / IP | $19.90 |
| Median Price / IP | $20.58 |
| RIR Transfers | 2,309 |
Year-over-Year Comparison
| Metric | This period | A year earlier (Q1 2025) | Change |
|---|---|---|---|
| Transactions | 284 | 201 | +41.3% |
| IP Addresses Traded | 3,355,136 | 734,464 | +356.8% |
| Estimated Market Value | $36,713,634 | $22,926,883 | +60.1% |
| Average Price / IP | $19.90 | $33.48 | -40.6% |
| RIR Transfers | 2,309 | 3,511 | -34.2% |
Price Dynamics
The price range in Q1 widened to $8.50–$41.00 per IP, a $32.50 spread that reflects the growing bifurcation between small clean blocks and bulk inventory. The floor at $8.50 — an ARIN transaction — is the lowest we've seen since early 2021 and signals that some sellers are willing to liquidate at fire-sale levels rather than hold depreciating inventory. The regression trend shows a quarter-on-quarter decline of 1.36%, which is actually modest compared to the 14.1% drop in average pricing; this tells us the steepest discounting happened in large-block trades rather than uniformly across all sizes. Buyers with patience and willingness to take /16 or larger blocks are extracting serious concessions. The $41 ceiling, recorded on an ARIN block, likely reflects a clean, small-prefix allocation with no blacklist history — premiums for quality haven't disappeared, they've just become the exception.
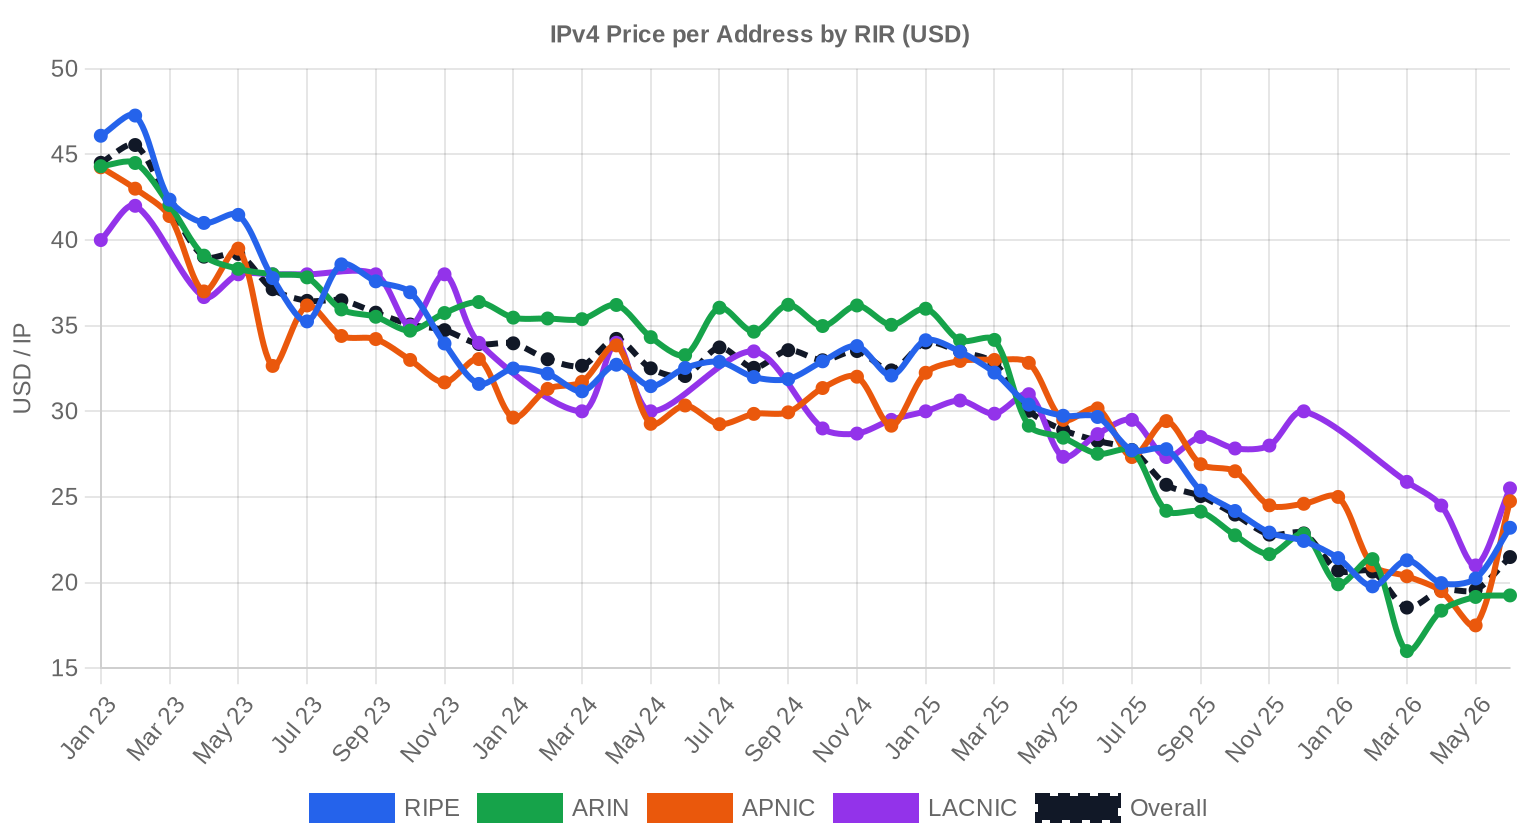
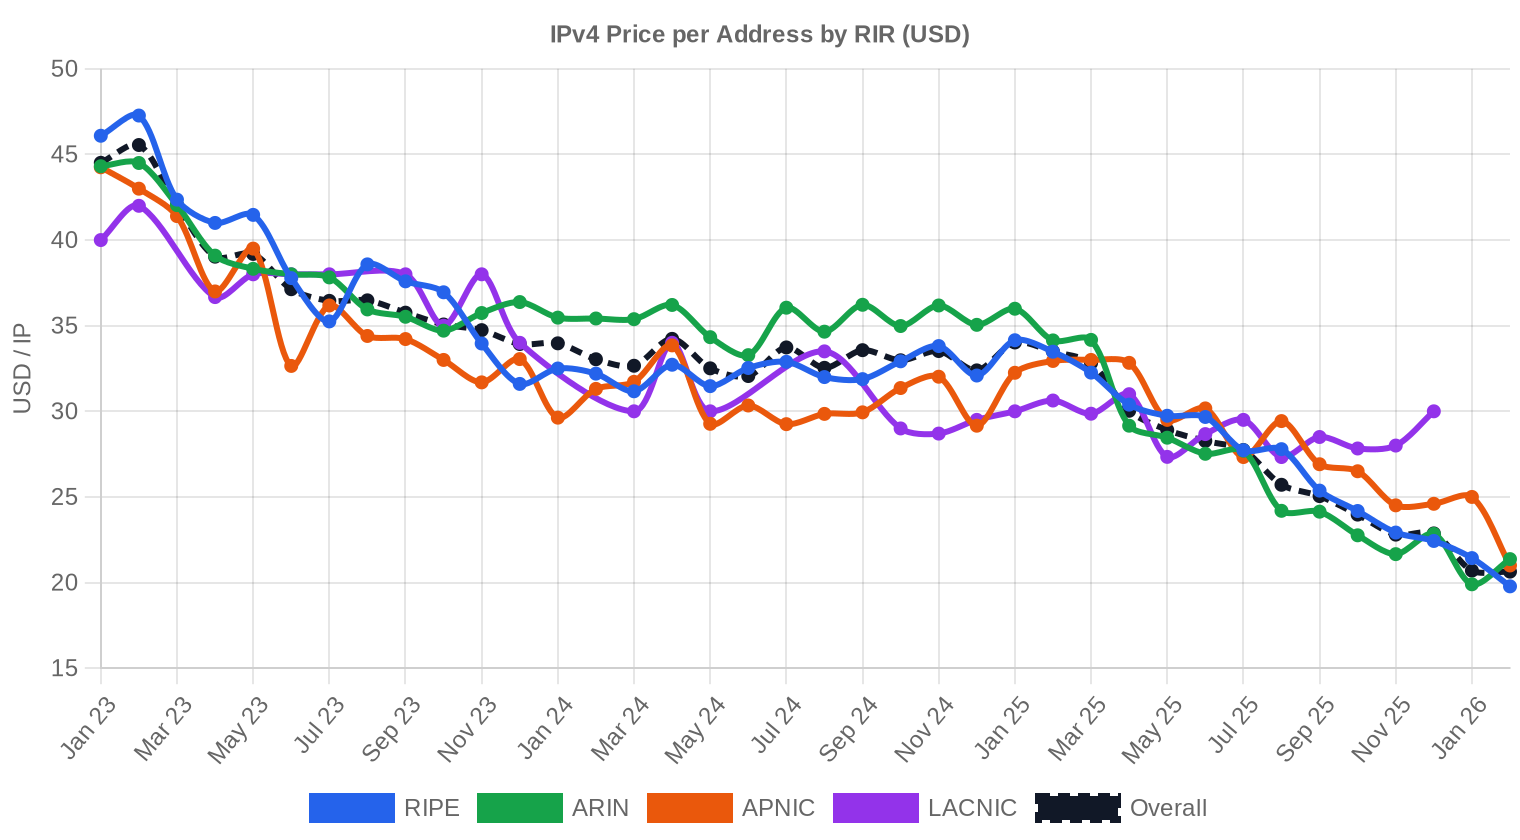
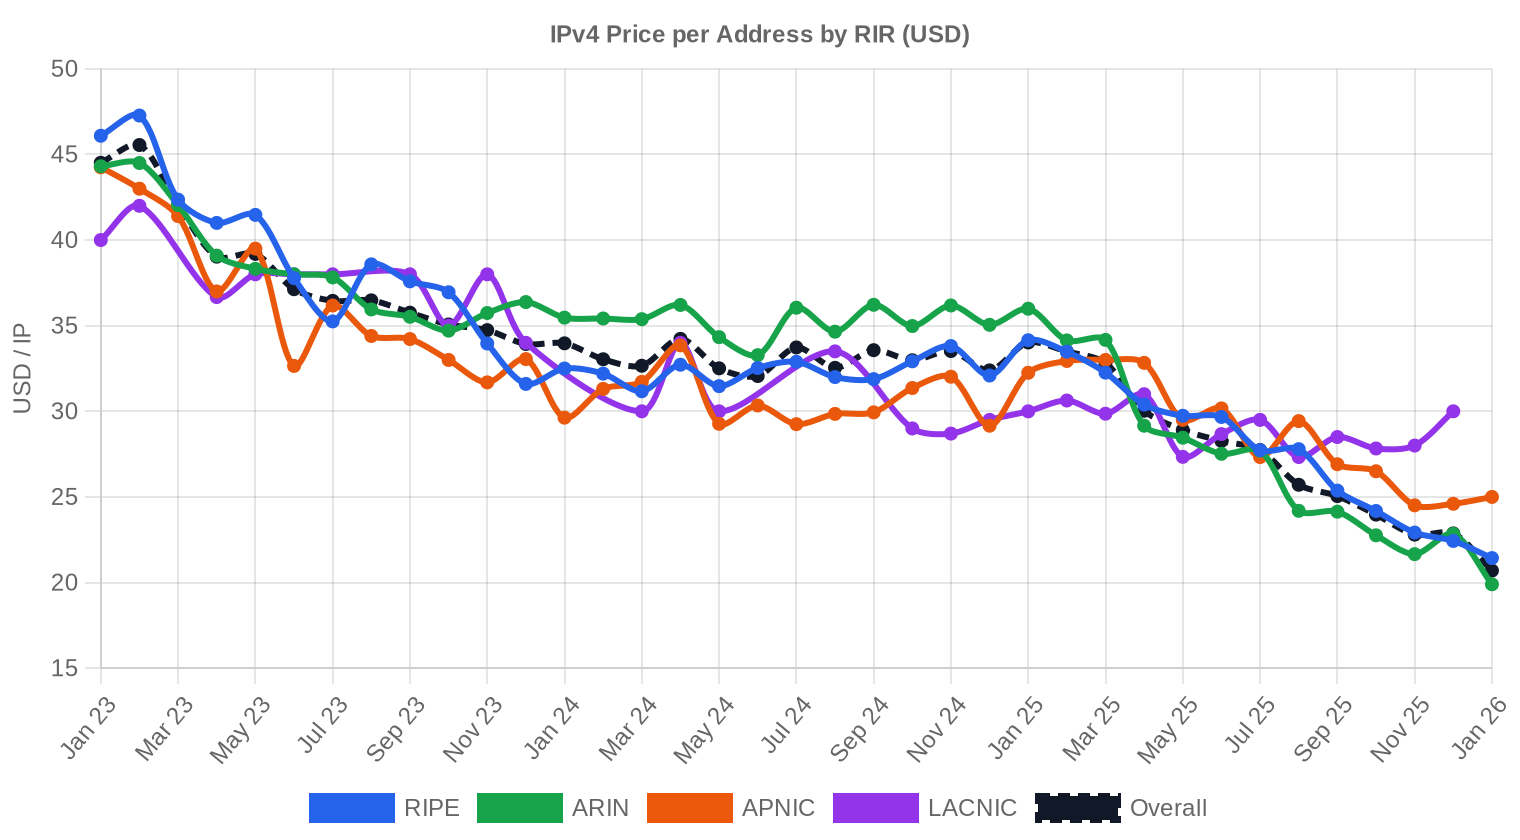
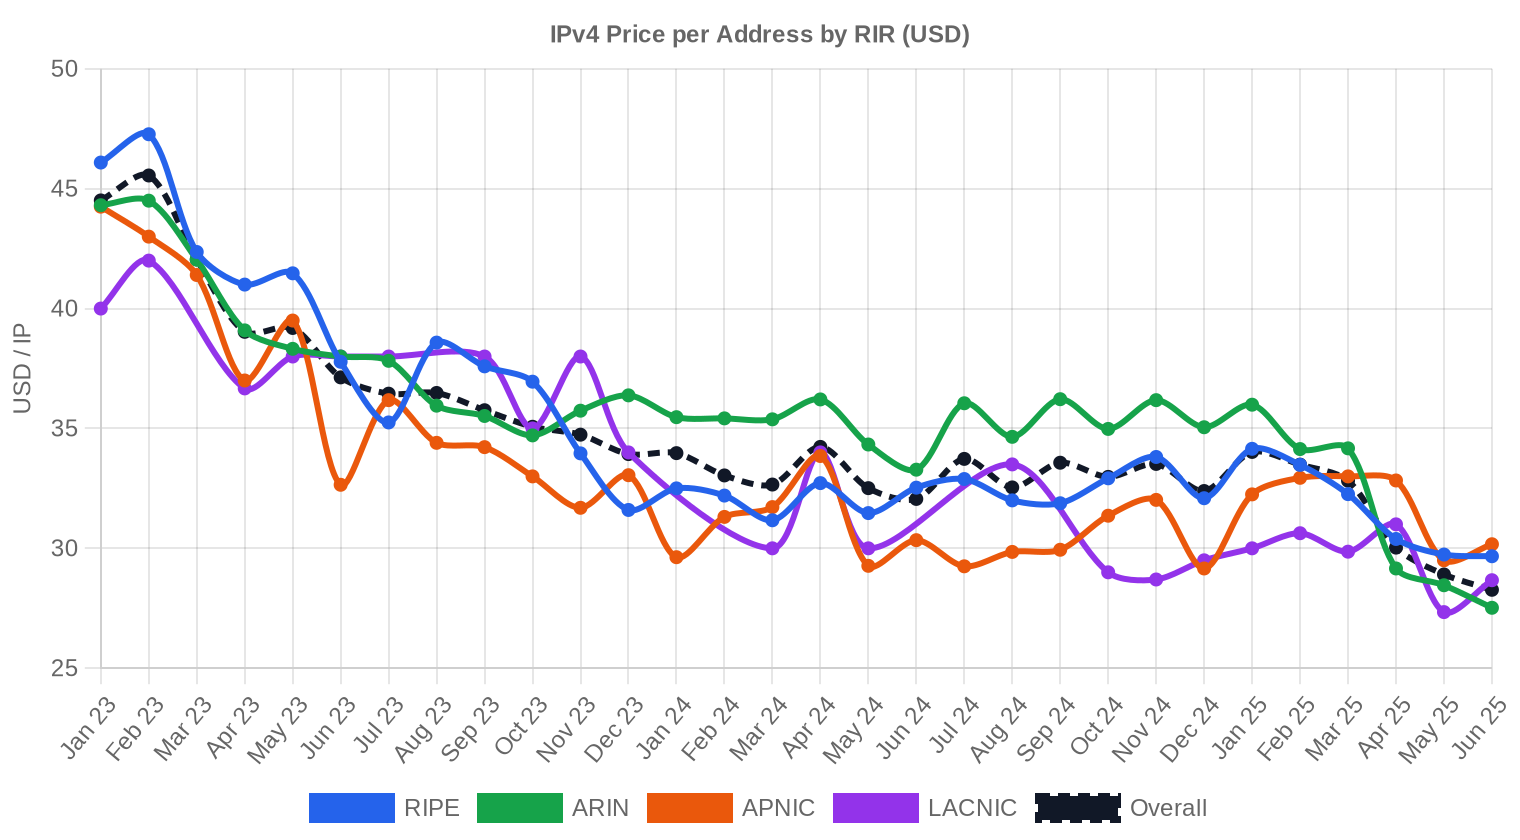
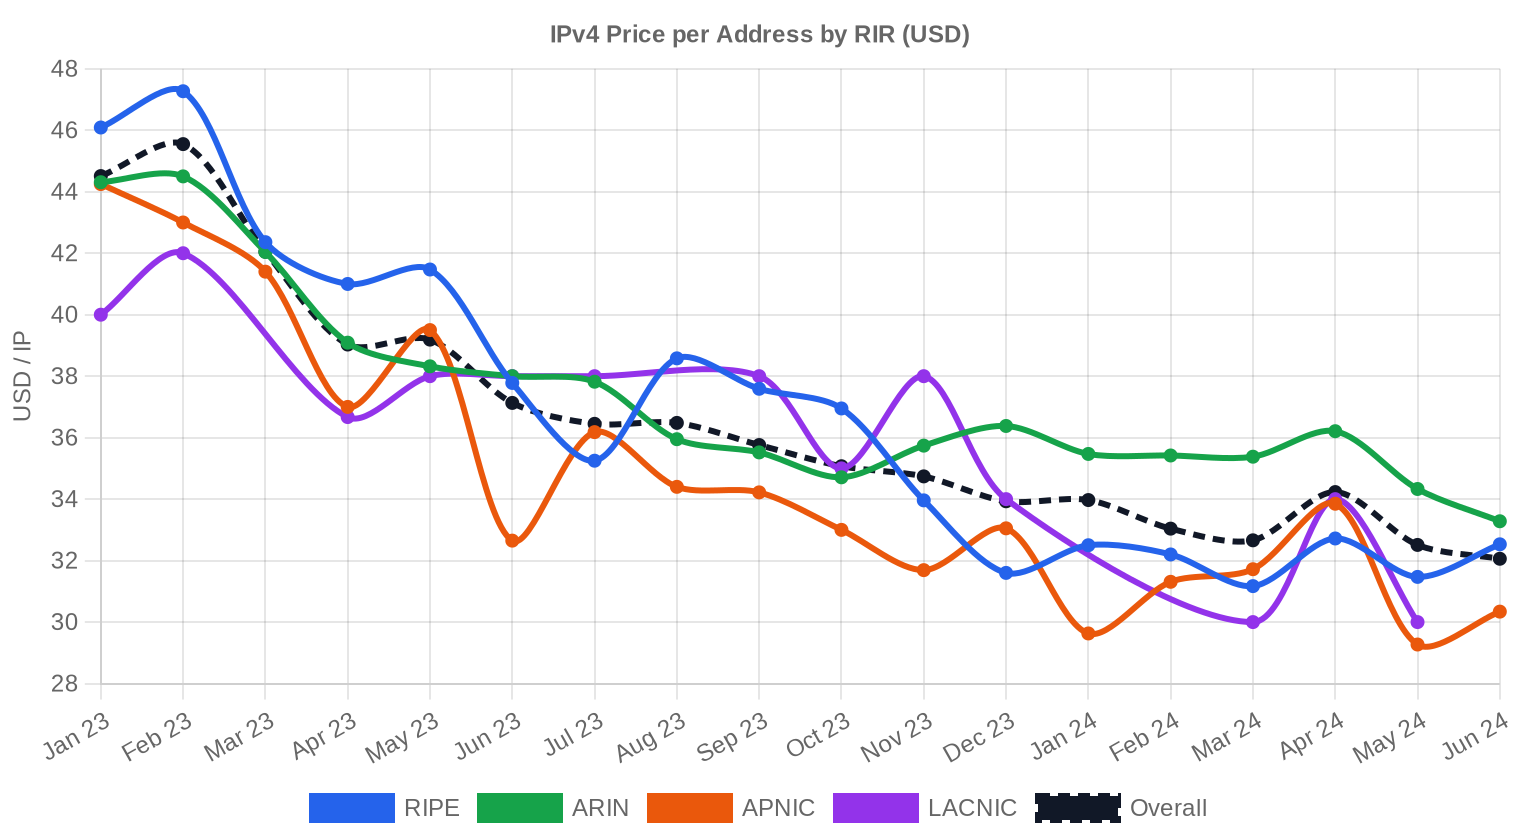
Pricing by RIR
ARIN dominated Q1 flow with 53.9% of total volume across 153 transactions and 2.18 million IPs, averaging $18.95/IP — the cheapest of any major registry this quarter. RIPE came in at $20.80/IP across 121 deals, a $1.85 premium over ARIN that has been narrowing for three consecutive quarters. The real outlier is LACNIC at $25.88/IP — a 30.1% premium to the market average — though this is based on just 4 transactions totaling 5,632 IPs, so the sample is thin. APNIC registered 6 deals at $22.02/IP, consistent with the scarcity premium that Asia-Pacific blocks have carried since APNIC's free pool ran dry years ago. AFRINIC recorded zero transactions for the second straight quarter, effectively frozen as a market.ARIN: $18.95/IP across 153 transactions (65.1% of IP volume).
RIPE: $20.80/IP across 121 transactions (34.3% of IP volume).
APNIC: $22.02/IP across 6 transactions (0.4% of IP volume).
LACNIC: $25.88/IP across 4 transactions (0.2% of IP volume).
AFRINIC: No recorded transactions.
| RIR | Transactions | Avg $/IP | Median $/IP | IPs Traded | RIR Transfers | Next Month (proj.) | Year-End (proj.) |
|---|---|---|---|---|---|---|---|
| RIPE | 121 | $20.80 | $21.25 | 1,152,256 | 1,393 | $21.00 | $18.50 |
| ARIN | 153 | $18.95 | $19.50 | 2,182,912 | 916 | $17.00 | $13.50 |
| APNIC | 6 | $22.02 | $23.00 | 14,336 | 0 | $19.50 | $16.50 |
| LACNIC | 4 | $25.88 | $26.25 | 5,632 | 0 | $26.00 | $24.00 |
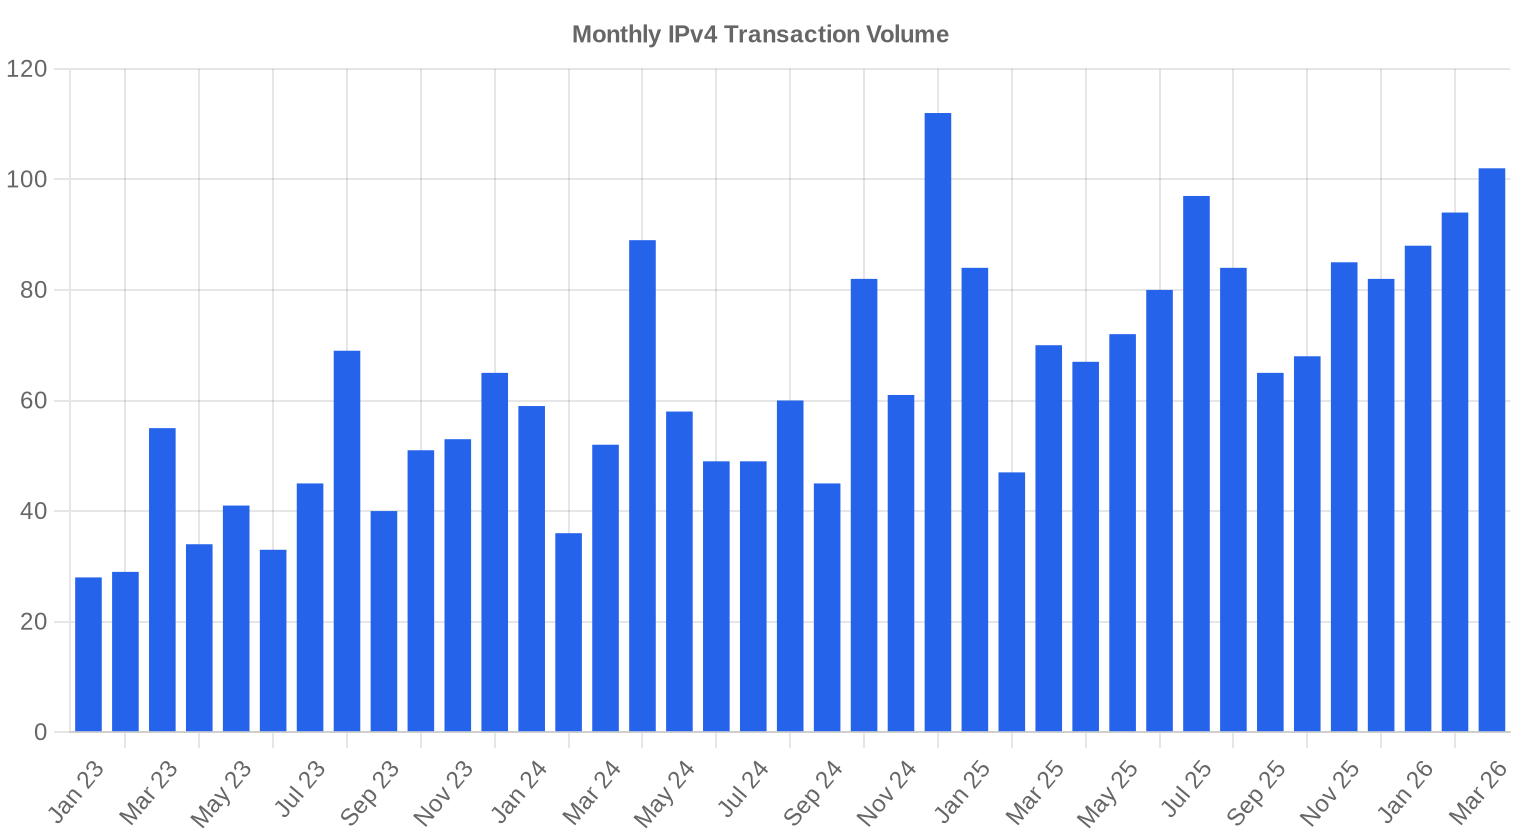
Transaction Volume

Supply & Block Sizes
/24 blocks accounted for 92 of 284 transactions — roughly a third of all deals — confirming that the single-subnet block remains the workhorse of this market. Buyers at the /24 level are typically small ISPs, hosting companies, and enterprises that need just enough space for a specific deployment. Larger blocks drove the bulk of IP volume: average deal size climbed to 129,273 IPs from 104,392 in Q4 2025, a 23.8% increase that points to several large portfolio trades clearing the market.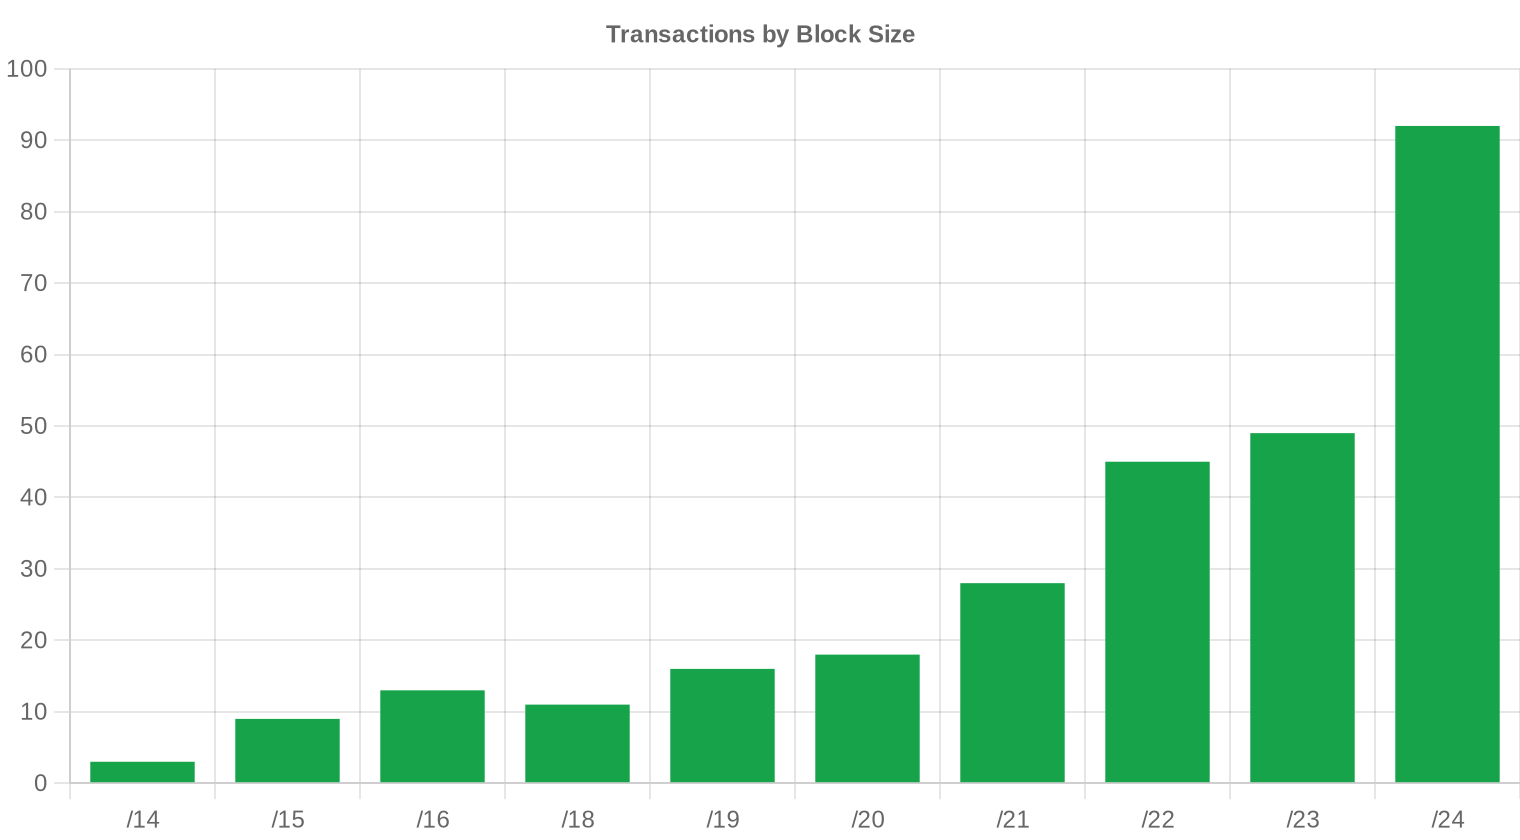
Geographic Activity
The United States led with 121 transactions, accounting for 42.6% of all deals — no surprise given ARIN's dominance and the depth of the American buyer pool. The United Kingdom placed second with 46 transactions, punching well above its weight relative to population and reflecting London's role as a European hosting and cloud hub. Canada (15 deals), the Netherlands (15), and Ireland (7) rounded out the top five, with the Dutch and Irish activity driven by data center operators concentrated in Amsterdam and Dublin.Registry Transfer Activity
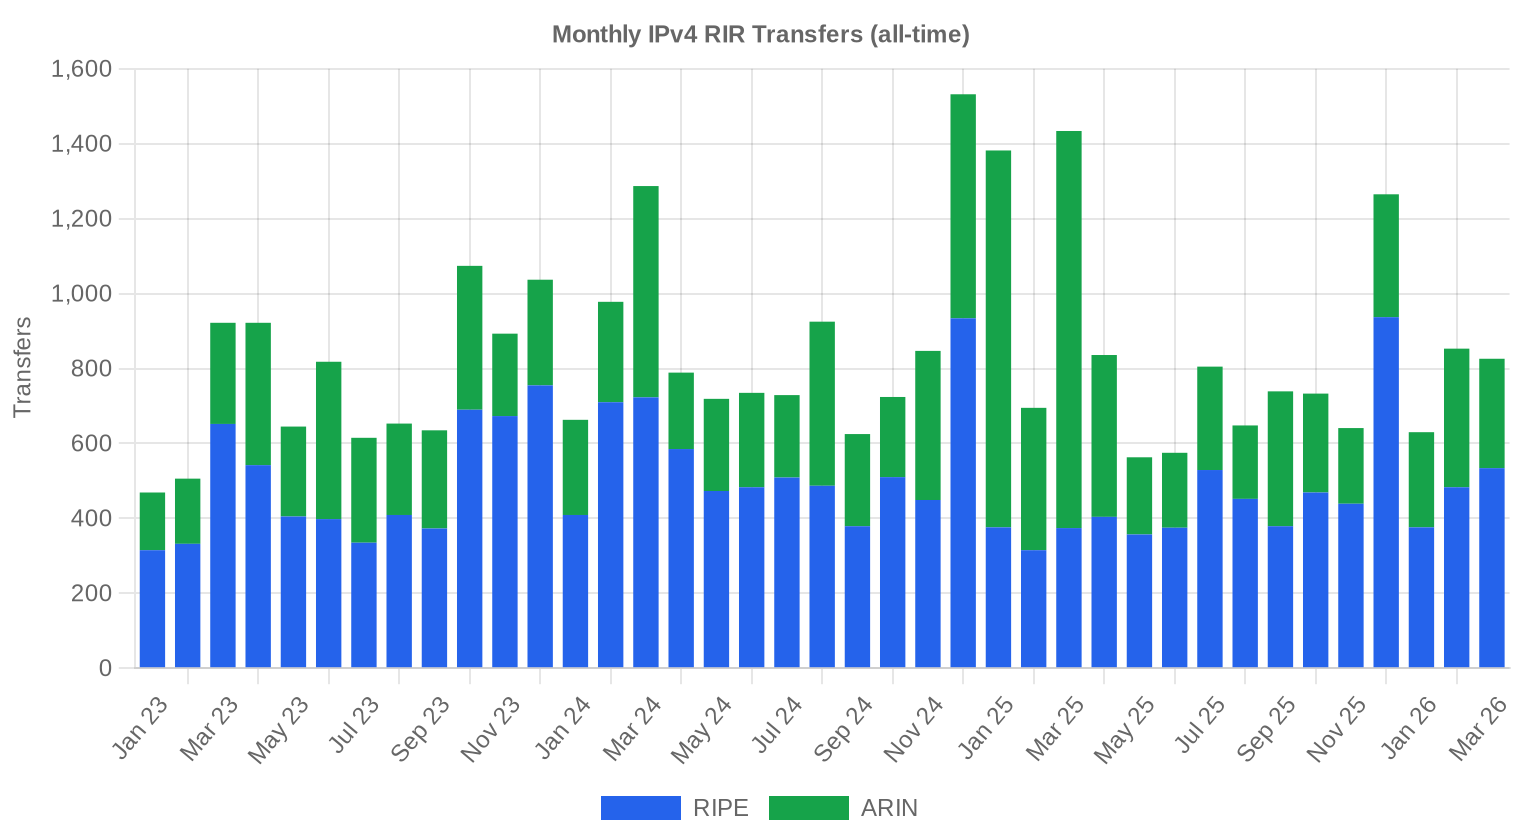
Total RIR-recorded transfers hit 2,309 in Q1 2026, with RIPE leading at 1,393 transfers — 60.3% of the global total. ARIN registered 916 transfers. The gap between RIPE's transfer count and its transaction count (121 priced deals vs. 1,393 transfers) reflects the high volume of intra-organization and policy-driven transfers within the RIPE region that carry no market price.Long-Run Transfer Trends
Over the 39 months we've tracked, cumulative transfers stand at 32,367. The peak month was December 2024, which aligns with the end-of-year portfolio cleanup pattern we see every Q4 as holders restructure ahead of audit season. RIPE has accounted for 59.7% of all transfers over this window versus ARIN's 40.3%, a split that has been remarkably stable despite the pricing convergence between the two registries.| RIR | RIR Transfers |
|---|---|
| RIPE | 19,329 |
| ARIN | 13,038 |
| RIR Transfers | 32,367 |
Outlook & Forecast
Forecasting each block-size band and RIR separately with our AI model:
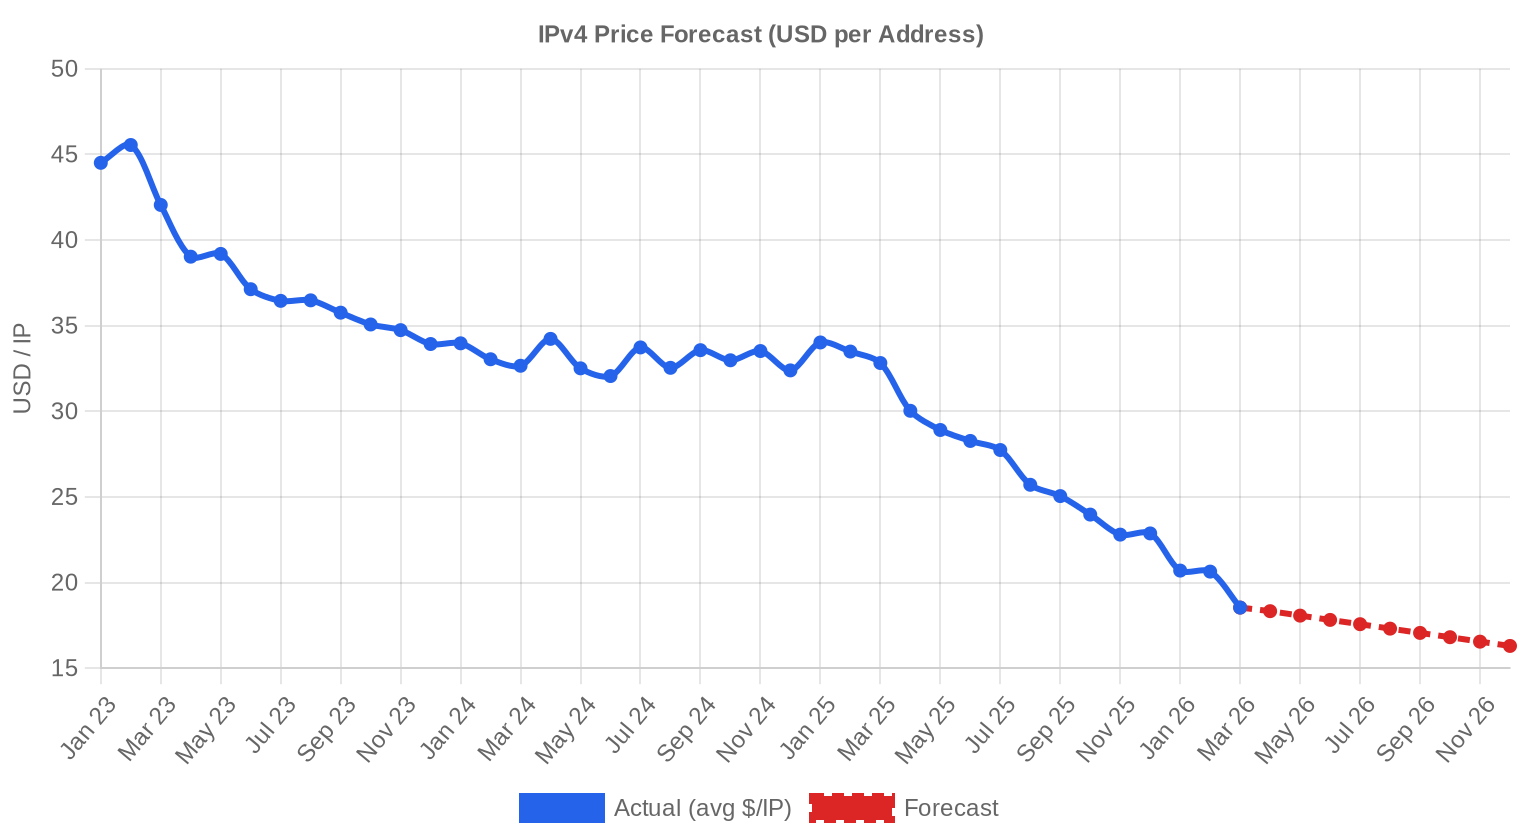
The overall average price per IP is projected to reach $16.30 by December 2026, with a next-month estimate of $18.69 per IP.
- RIPE: projected at $21.00 per IP next month, trending toward $18.50 by December 2026.
- ARIN: projected at $17.00 per IP next month, trending toward $13.50 by December 2026.
- APNIC: projected at $19.50 per IP next month, trending toward $16.50 by December 2026.
- LACNIC: projected at $26.00 per IP next month, trending toward $24.00 by December 2026.
- AFRINIC: insufficient data for a reliable forecast.
Forecast by Block Size
| Block | Current $/IP | Next Month | Year-End | Confidence |
|---|---|---|---|---|
| /24 | $25.00 | $24.00 (-4.0%) | $21.00 (-16.0%) | medium |
| /23 | $19.00 | $18.50 (-2.6%) | $16.00 (-15.8%) | medium |
| /22 | $18.48 | $18.00 (-2.6%) | $15.50 (-16.1%) | medium |
| /21 | $16.25 | $15.50 (-4.6%) | $13.50 (-16.9%) | low |
| /20 | $15.75 | $15.00 (-4.8%) | $13.50 (-14.3%) | low |
| /19 | $14.00 | $13.50 (-3.6%) | $12.00 (-14.3%) | low |
| /18-/16 | $10.80 | $10.50 (-2.8%) | $9.00 (-16.7%) | low |
| /15-up | $9.00 | $9.00 (0.0%) | $8.00 (-11.1%) | low |
Editor's Take: Buy vs. Lease
The buy-versus-lease calculus has shifted decisively toward buying. At current pricing of $19.90/IP and a RIPE lease rate of $0.5859/IP per month, the breakeven payback on a purchase is just 34 months — under three years. That translates to an implied annual yield of 35.3% for anyone currently leasing who could instead purchase outright. For a /24 block, you're looking at a purchase price of roughly $5,094 versus $150/month in lease costs. If you need the addresses for more than three years — and most operators do — buying is the clear move. The one caveat: if prices continue to decline toward $16.30 by year-end as our model suggests, buyers who wait may save another 18%, though they'll also accumulate six more months of lease payments in the interim. On balance, buy now if you have the capital.| /24 Purchase price | $5,094 |
| /24 Lease price | $150 / mo |
| Payback period | 34.0 mo (2.8 yr) |
| Gross annual yield | 35.3% |

What This Means for You
Buyers: You are in the strongest negotiating position in years. Average prices have dropped 40.6% year-over-year and the trend is still lower. Push for sub-$19 on ARIN blocks and sub-$20 on RIPE. If you need addresses within the next 12 months, locking in now at current levels while negotiating aggressively beats waiting for the absolute bottom.Sellers: The window for realizing $25+ per IP on standard blocks has closed outside of LACNIC and APNIC, where scarcity premiums still hold. If you're sitting on ARIN or RIPE inventory you don't need, every quarter of delay is costing you roughly 10–15% in realized value. Price to move, not to maximize.
Leasers: At $0.5859/IP per month, the lease market hasn't adjusted as fast as the sales market. That's creating an arbitrage: buy at $19.90 and lease out at current rates for a 35.3% annualized return. If you're currently leasing, the breakeven to purchase is under three years — run the math for your specific deployment.
Block Holders: Clean blocks with no blacklist history and established allocation dates still command premiums — the $41 ceiling in Q1 proves that. Invest in maintaining your block's reputation. A clean /24 is worth 2–3x a dirty one in this market.
Browse verified IPv4 blocksSell IPv4 →
List your blocks with managed transferLease IPv4 →
Flexible short-term capacityLease Out IPv4 →
Turn idle blocks into recurring revenue
IPv4 Pricing by Block Size
/24 blocks continue to trade at a meaningful per-IP premium. With 92 transactions at the /24 level, buyers are paying somewhere in the $26–$34 range for clean single-subnet blocks — well above the $19.90 market average, which is dragged down by bulk trades. At the /16 end, per-IP pricing drops to the mid-teens or below, and the $8.50 floor this quarter almost certainly came from a /16 or larger block. The per-IP discount on a /16 versus a /24 now runs 40–50%, rewarding buyers who can deploy larger address space.| Block | IPs | Buy: /IP | Buy: Total | Lease: /IP/mo | Lease: Monthly |
|---|---|---|---|---|---|
| /24 | 256 | $35–45 | $8,960–11,520 | $0.38–0.50 | $97–128 |
| /22 | 1,024 | $28–38 | $28,672–38,912 | $0.33–0.45 | $338–461 |
| /20 | 4,096 | $22–32 | $90,112–131,072 | $0.30–0.40 | $1,229–1,638 |
| /18 | 16,384 | $20–30 | $327,680–491,520 | $0.30–0.38 | $4,915–6,226 |
| /16 | 65,536 | $18–28 | $1,179,648–1,835,008 | $0.30–0.35 | $19,661–22,938 |
IPv4 Price History: 2011–2026
IPv4 addresses were effectively free until IANA exhaustion in 2011. Prices climbed steadily from $5–$7/IP in 2014 to a peak near $55–$60/IP in mid-2023, driven by cloud growth and a genuinely finite supply. AWS's introduction of public IPv4 charges in February 2024 at $0.005/hour per address triggered the first sustained selloff, as enterprises and cloud tenants began releasing unused allocations back into the market. We've now seen prices cut by roughly two-thirds from that peak, and the current $19.90 average represents a reversion to roughly 2019 levels.| Year | ~Price/IP | Key Event |
|---|---|---|
| 2011 | $7–12 | IANA free pool exhausted; Microsoft/Nortel deal ($11.25/IP) |
| 2012 | $8–12 | RIPE NCC reaches last /8; begins /22-only allocation |
| 2014 | $10–15 | LACNIC free pool exhausted |
| 2015 | $8–15 | ARIN free pool exhausted |
| 2017–18 | $12–18 | Leasing market grows; cloud demand rises |
| 2019 | $18–24 | RIPE NCC exhausts remaining free pool |
| 2021–22 | $50–60+ | Post-pandemic peak; hyperscaler build-outs |
| 2024 | $35–52 | AWS IPv4 charge ($0.005/IP/hr); large block correction |
| 2025–26 | $18–45 | Market bifurcation; /16s below $20 for first time since 2019 |
Market Structure: Who Is Buying & Selling
The buy side is increasingly dominated by mid-tier ISPs, regional hosting companies, and enterprises deploying edge infrastructure — the hyperscalers have largely secured their positions. On the sell side, legacy holders who received allocations in the pre-RIR era continue to monetize, joined by a growing number of companies offloading blocks freed up by IPv6 migration or cloud consolidation. Bankruptcy-related liquidations have ticked up as some smaller hosting firms fail to compete at current margins.IPv4 vs. Other Asset Classes
At a 35.3% implied annual yield (based on the buy-versus-lease spread), IPv4 addresses outperform virtually every traditional asset class on a cash-flow basis. US 10-year Treasuries are yielding around 4.2%, investment-grade corporate bonds roughly 5.5%, and even high-yield REITs top out near 8–10%. The catch is liquidity risk and the depreciating asset base: if per-IP prices decline to $16.30 by year-end as forecast, capital losses would offset a significant chunk of that lease income. Think of it less like a bond and more like a high-yield equipment lease with residual value risk.| Asset Class | Typical Yield | Liquidity | Primary Risk |
|---|---|---|---|
| IPv4 | 35.3% | Moderate | IPv6 adoption, block quality |
| Commercial Real Estate | 5–8% | Low | Vacancy, rate cycle |
| Investment-Grade Bonds | 4–5% | High | Duration, credit risk |
| S&P 500 | ~1,3% | High | Market volatility |
| Money Market / T-Bills | ~4–5% | High | Rate cycle changes |
IPv6 Adoption & Why IPv4 Remains Essential
IPv6 adoption continues its slow, uneven march — Google's IPv6 traffic share sits around 45%, but enterprise internal networks and much of the developing world remain overwhelmingly IPv4. The dual-stack reality will persist for at least another decade. Every new IoT deployment, every regional ISP expansion, and every enterprise VPN still needs IPv4 space to function in a world where the protocol transition is measured in decades, not quarters.AI & Cloud Infrastructure Demand
AI infrastructure buildout is a genuine demand driver, though its impact is more nuanced than the headlines suggest. Training clusters and inference farms need public IPv4 space primarily for API endpoints, model-serving infrastructure, and management planes — not for the GPU nodes themselves, which typically sit behind NAT or on private networks. The net effect is incremental demand at the /24 and /23 level from AI startups and GPU cloud providers, adding a floor under small-block pricing even as large-block prices continue to erode.What Determines IPv4 Block Value
Block valuation depends on five primary factors: blacklist cleanliness, allocation age, originating RIR, prefix size, and transferability. A /24 with a clean Spamhaus record, allocated before 2010, and registered under RIPE or ARIN will command $28–$34/IP. The same prefix size with blacklist hits or recent allocation might trade at $18–$22. LACNIC and APNIC blocks carry scarcity premiums of 20–30% but face thinner buyer pools and longer closing timelines.Sell vs. Lease: A Decision Framework
In a declining price environment, the sell-now argument is straightforward: every month you hold, the asset is worth less. Sellers who can realize $19–$20/IP today would need lease income of at least $0.59/IP per month for 34 months just to break even against selling — and that assumes no further price depreciation. Leasing makes sense only if you believe prices will stabilize or recover within your holding period, or if you have tax or corporate reasons to prefer recurring income over a lump-sum gain.| /24 Purchase price | $5,094 |
| /24 Lease price | $150 / mo |
| Payback period | 34.0 mo (2.8 yr) |
| Gross annual yield | 35.3% |
RIPE NCC 24-Month Transfer Restriction
RIPE's 24-month holding requirement before a block can be transferred continues to act as a supply brake in the European market. Blocks acquired in early 2024 — near the market peak — won't become transferable until early 2026, and many of those holders are now sitting on unrealized losses. This creates a perverse incentive: holders who bought at $50/IP can't sell until the block has likely depreciated to $18–$20, which may delay their decision to sell further, tightening near-term RIPE supply relative to ARIN.Deal Size Distribution
Average deal size rose to 129,273 IPs from 104,392 IPs in Q4 2025 — a 23.8% increase driven by a handful of large portfolio transactions. The market is bimodal: 214 of 284 deals (75.4%) fell under $50,000 in value, accounting for just $3.0 million. Meanwhile, 25 deals exceeding $1 million represented $56.1 million — which, combined with the mid-tier bands, implies that the bulk of dollar volume is concentrated in fewer than 10% of transactions. Small-block retail remains healthy by count; the big money moves in blocks of a million addresses or more.Top Trading Countries
The US, UK, and unattributed (ZZ) jurisdictions accounted for the top three positions with 121, 46, and 18 transactions respectively. American dominance reflects both the depth of the ARIN market and US-based demand from hosting, cloud, and enterprise buyers. The Netherlands (15 deals) and Canada (15) tied for fourth, both driven by data center concentration — Amsterdam as Europe's peering hub and Canadian telcos expanding rural broadband.BEAD Broadband Program Impact
The $42.45 billion BEAD program is now entering its deployment phase, with state-level grants beginning to flow to ISPs building last-mile broadband in underserved areas. These ISPs need /22 to /20 blocks to address new subscriber bases, and many lack existing IPv4 inventory. We expect BEAD-driven demand to provide a modest floor under mid-size block pricing through 2027, though the total addressable demand — perhaps 2–5 million IPs across all grantees — is unlikely to reverse the broader downtrend on its own.Hyperscaler IPv4 Holdings
Amazon, Microsoft, and Google collectively hold an estimated 100+ million IPv4 addresses — enough to supply the entire transfer market for years if they chose to sell. They won't, of course; these addresses are operationally embedded across global infrastructure. But the sheer size of hyperscaler holdings means they act as a psychological ceiling on prices: buyers know that if prices ever recovered to $40+, the incentive for large holders to monetize surplus space would cap any rally. Amazon's public IPv4 charge continues to push enterprises to release unused allocations, adding a steady trickle of supply to the market.Macroeconomic Conditions & Market Impact
Enterprise IT budgets remain cautious in Q1 2026, with most CIOs prioritizing AI and cloud migration spend over infrastructure buildout. Higher-for-longer interest rates continue to raise the cost of capital for speculative IPv4 purchases, dampening the buy-and-hold trade that supported prices in 2021–2023. The one bright spot is telecom capital expenditure in emerging markets, where ISP expansion still requires IPv4 in quantity — but those buyers are extremely price-sensitive and won't pay above $18/IP for bulk.Model Update & Calibration
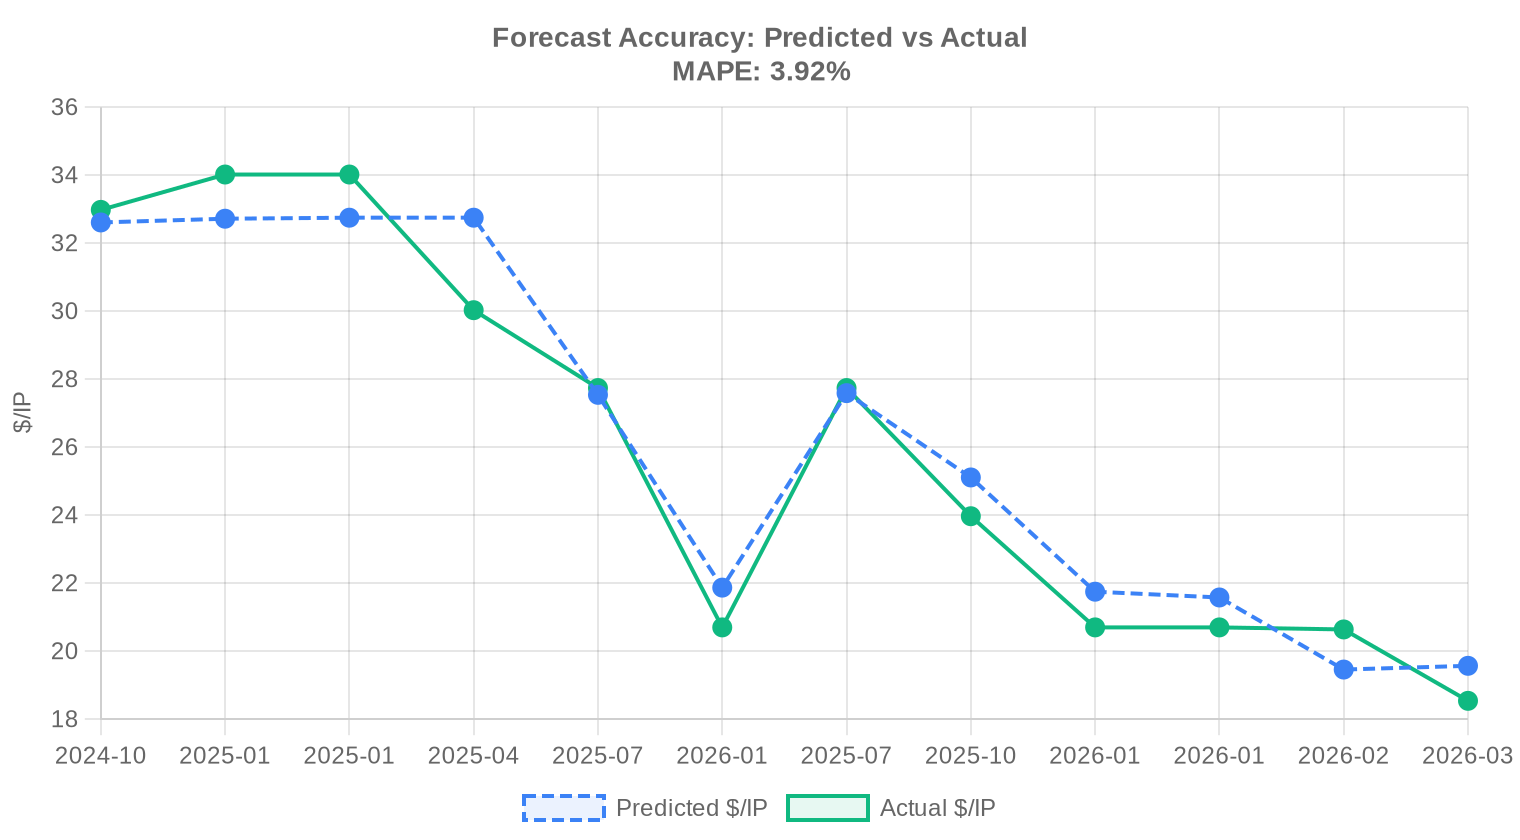
As part of our continuous improvement process, we backtested previous forecasts against realised prices and fine-tuned the model accordingly. Recent months now carry more influence than older data, and the confidence bands have been widened or narrowed based on how well they captured actual outcomes in the past. You can see the full backtest results in the table and chart below.
| Report Period | Target Month | Predicted | Actual | Deviation |
|---|---|---|---|---|
| 2025-Q2 | 2025-07 | $28 | $28 | -1% |
| 2025-Q3 | 2025-10 | $25 | $24 | +5% |
| 2025-H2 | 2026-01 | $22 | $21 | +5% |
| 2025-Q4 | 2026-01 | $22 | $21 | +4% |
| 2026-01 | 2026-02 | $19 | $21 | -6% |
| 2026-02 | 2026-03 | $20 | $19 | +6% |
Methodology
Figures are based on completed IPv4Center marketplace transactions and RIR transfer statistics. Prices are in US dollars per IP address. Forecasts are produced by an AI model that analyses each block-size band and RIR segment separately (with outlier-trimmed medians) alongside known market catalysts; they are estimates, not guarantees.
Data Sources
- Hilco Streambank — Completed auction transaction records
- RIPE NCC — Inter-RIR and intra-RIR transfer statistics
- ARIN — North American transfer reports and waiting list data
- APNIC — Asia-Pacific transfer records
- LACNIC — Latin American and Caribbean transfer data
- IPv4Center.com — Proprietary marketplace transaction and lease pricing data
This report is generated automatically for informational purposes only and does not constitute financial advice.
Frequently Asked Questions
What was the average price per IPv4 address in Q1 2026?
The market-wide weighted average landed at .90 per IP, with a median of .58. That spread suggests a modest skew toward larger, discount-priced blocks pulling the mean below the median — a pattern consistent with institutional buyers negotiating volume concessions.
How many transactions closed in Q1 2026, and what was the total dollar volume?
We recorded 284 priced transactions covering approximately 3.36 million addresses, for an aggregate market value of .7 million. The average deal size was roughly 129,273 IPs — a figure heavily influenced by a handful of very large ARIN block trades.
Why is the market trend flagged as 'down' for this quarter?
Prices declined approximately 1.36% over the quarter. Our model projects a continuation to roughly .69 next month and .30 by year-end 2026. Persistent IPv6 deployment gains, combined with steady supply from corporate divestitures, are applying gradual downward pressure on per-IP valuations.
Which RIR region had the highest transaction volume in Q1 2026?
ARIN dominated with 153 priced transactions — 53.9% of the total — covering 2.18 million addresses and .9 million in value. North American inventory continues to clear faster than any other region, driven by US enterprise and cloud demand.
Why are LACNIC blocks the priciest at .88 per IP when only four transactions closed?
Scarcity premium. LACNIC's free pool has been exhausted for years and the region's transfer framework is relatively young, so available blocks are rare. Four deals is a thin sample, but median pricing at .25 — roughly 35% above ARIN's median of .50 — reflects genuine supply constraint in Latin America.
How did RIPE NCC pricing compare to ARIN pricing this quarter?
RIPE averaged .80 per IP (median .25) versus ARIN's .95 (median .50). The ~10% RIPE premium persists, attributable to tighter European regulatory requirements and comparatively lower block availability at large prefix sizes. RIPE also led in total transfer activity at 1,393 recorded transfers.
What was the most commonly traded prefix size in Q1 2026?
The /24 block — 256 addresses — was the most frequently transacted prefix, appearing in 92 deals. This remains the smallest independently routable block on most networks, making it the default entry point for smaller operators and the bread-and-butter of the retail market.
What does the deal-size distribution look like this quarter?
The market is sharply bimodal. Sub-K transactions accounted for 214 of 284 deals (75%) but only .0 million in value. Meanwhile, 25 transactions above million represented just 9% of deal count yet commanded .1 million — more than the total reported value of all other bands combined. Institutional blocks continue to dominate dollar-weighted activity.
Is it cheaper to buy or lease IPv4 addresses at current rates?
Buy. At the current lease rate of .5859 per IP per month (.03 annually) and a purchase price of .90, the buy-vs-lease breakeven is approximately 34 months — under three years. If you expect to hold addresses beyond that horizon, acquisition is the more efficient capital deployment. The implied annual yield for a lessor is 35.3%, which tells you how much margin you're surrendering by renting.
How much does it cost to lease a /24 block right now?
Approximately 0 per month, or about ,800 annually, based on 44 sampled lease transactions — predominantly in the RIPE region. Compared to a purchase price of roughly ,094 for a /24, the payback math favors buying if your need exceeds ~34 months.
Which countries are driving the most buying activity?
The United States leads decisively with 121 transactions, followed by the United Kingdom at 46 and a cluster of anonymized or multi-jurisdiction deals (18 flagged 'ZZ'). Canada and the Netherlands tied at 15 each. The top five geographies account for roughly 76% of all Q1 transactions.
What is the realistic year-end 2026 price forecast?
Our model projects an average price of .30 per IP by December 2026, representing an approximate 18% decline from the current Q1 average of .90. We rate this forecast as reliable given the underlying data density and the consistent downward trend observed across recent quarters.
What mistakes should buyers avoid in the current declining-price environment?
The biggest error is overbuying on the assumption prices will rebound. With a year-end forecast of .30, locking in a large inventory at + exposes you to mark-to-market losses. Buy to need, not to speculate. Also avoid ignoring transfer timelines — ARIN and RIPE approvals can take 4–8 weeks, and rushing a deal often means overpaying for 'ready-to-transfer' blocks.
What are the risks of holding IPv4 assets as a long-term investment right now?
The primary risk is secular depreciation. Prices are trending down at roughly 1.4% per quarter, and our model sees .30 by year-end. IPv6 adoption continues to erode structural demand. If you're holding purely for capital appreciation, the math is working against you. Leasing can partially offset the decline — the 35.3% implied yield is attractive — but only if utilization rates remain high.
Why is there no AFRINIC transaction data for Q1 2026?
Zero priced transactions were recorded in the AFRINIC region. The registry has faced prolonged governance issues and suspended or heavily restricted inter-RIR transfers. Until policy certainty returns, market participants are effectively locked out of the African address space for secondary-market purposes.
What risks come with buying APNIC-region blocks given the thin volume?
Only 6 transactions closed in APNIC this quarter, covering just 14,336 IPs. That illiquidity cuts both ways: you may secure attractive pricing (average .02), but exit options are limited and price discovery is unreliable. Buyers should factor in longer marketing periods if they ever need to resell.
How does the .50-to-.00 price range this quarter get so wide?
The floor reflects deeply discounted bulk trades — typically /14 or larger ARIN blocks sold in volume to hyperscalers or infrastructure funds. The ceiling at .00 (also ARIN) likely represents a small, clean, immediately routable block with pristine reputation and no blacklist history. Provenance, block size, and routing cleanliness remain the key valuation drivers.
Is IPv6 adoption finally killing the IPv4 market?
Not killing, but steadily bleeding it. The 1.36% quarterly price decline and our .30 year-end target are both symptoms of growing IPv6 deployment reducing marginal IPv4 demand. That said, 284 transactions and .7 million in Q1 volume confirm the market is far from dead. Think slow deflation, not a cliff.
How long does a typical ARIN or RIPE transfer take to complete?
ARIN transfers typically require 4–8 weeks from executed agreement to registration update, depending on needs-justification review complexity. RIPE transfers tend to be faster — 2–4 weeks — since RIPE NCC does not impose a needs test. Both timelines assume clean resources with no outstanding abuse flags or liens.
What should lessors expect in terms of yield at current market rates?
At .5859 per IP per month against a purchase basis of .90, the gross annualized yield is approximately 35.3%. That's exceptional on paper, but it assumes full utilization and no vacancy. Factoring in brokerage fees, compliance costs, and potential depreciation of the underlying asset toward .30, the net effective yield is meaningfully lower — though still compelling relative to most fixed-income alternatives.
What drove the 2,309 total transfers recorded this quarter versus 284 priced transactions?
Most of the gap is administrative. The 2,309 figure includes intra-company reassignments, mergers, consolidations, and transfers with no arm's-length price. RIPE alone recorded 1,393 such transfers. Only 284 transactions had verifiable pricing — and those are the ones that matter for market valuation.
What mistakes do first-time IPv4 buyers commonly make?
Three recurring errors: (1) failing to verify blacklist and reputation status before signing, which can render a block unusable for email or hosting; (2) underestimating transfer approval timelines, leading to missed deployment windows; and (3) paying retail /24 prices (+) for needs that could be met by leasing at 0/month. Always model your holding period before committing capital.
Are multi-jurisdiction deals becoming more common?
The data hints at it. We see at least 14 transactions tagged with two or more country codes — combinations like GB/SG, CA/US, UA/NA, and CZ/US. These typically involve a seller in one RIR region and a buyer in another, or holding-company structures spanning multiple jurisdictions. Expect this to grow as cross-border arbitrage opportunities widen between ARIN (.95 avg) and RIPE (.80 avg).
How should CFOs think about IPv4 on the balance sheet given the declining price trend?
IPv4 addresses should be treated as a depreciating intangible asset. With a projected decline to .30 by year-end, carrying them at historical cost overstates their value. We recommend quarterly mark-to-market adjustments and, for significant holdings, consider monetizing excess blocks now rather than watching them erode toward the mid-teens. The 35.3% lease yield also argues for sweating idle inventory.
What is the risk of waiting until late 2026 to buy?
If our forecast holds, waiting could save you roughly .60 per IP — a meaningful 18% discount on today's .90 average. The risk is operational: if you need addresses for a Q2 or Q3 deployment, a 4–8 week transfer timeline means waiting until Q4 may not be feasible. Price timing must be weighed against project delivery schedules.