15 min read
This report analyzes the IPv4 transfer market for Q4 2024, based on completed IPv4Center marketplace transactions and official RIR transfer records.
Executive Summary
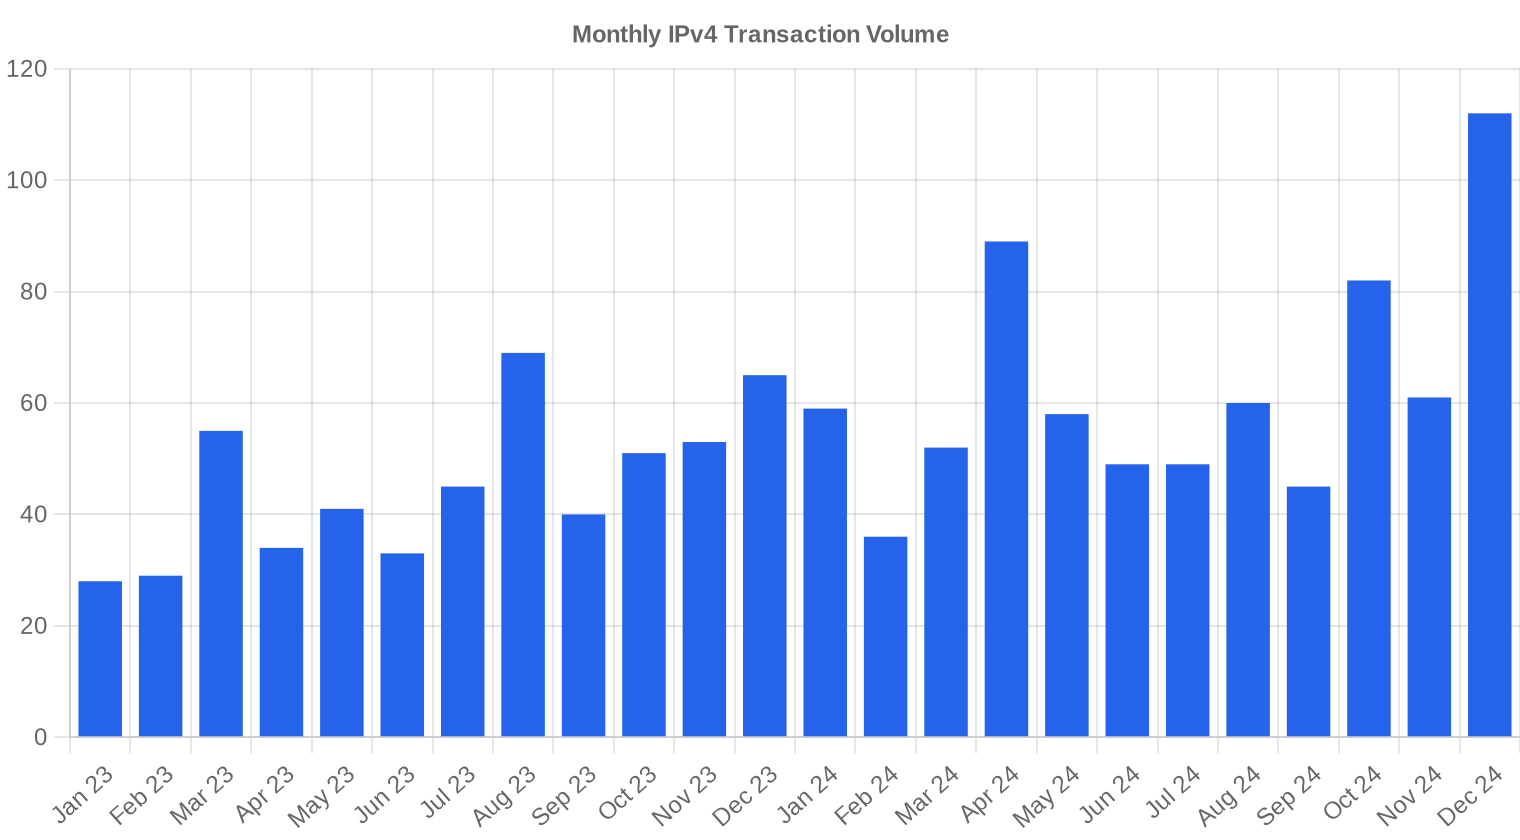
The IPv4 transfer market closed Q4 2024 with 255 priced transactions covering 837,888 addresses at a weighted average of $32.85 per IP — down $1.10 from Q3 2024 and off 4.9% year-over-year versus Q4 2023. Total deal value reached $27.6 million. The headline number this quarter is volume: transaction count jumped 65.6% from Q3, the largest quarter-over-quarter increase we've tracked in recent memory. Prices softened modestly on the surge, with the median holding at $32/IP, suggesting the wave of supply hit the market without triggering a disorderly selloff. The 24-month regression trend remains technically positive at +2.63%, but the direction of travel on a quarterly basis is clearly lower.Market Overview
| Transactions | 255 |
| IP Addresses Traded | 837,888 |
| Estimated Market Value | $27,582,021 |
| Average Price / IP | $32.85 |
| Median Price / IP | $32.00 |
| RIR Transfers | 3,103 |
Year-over-Year Comparison
| Metric | This period | A year earlier (Q4 2023) | Change |
|---|---|---|---|
| Transactions | 255 | 169 | +50.9% |
| IP Addresses Traded | 837,888 | 588,288 | +42.4% |
| Estimated Market Value | $27,582,021 | $22,570,033 | +22.2% |
| Average Price / IP | $32.85 | $34.53 | -4.9% |
| RIR Transfers | 3,103 | 3,004 | +3.3% |
Price Dynamics
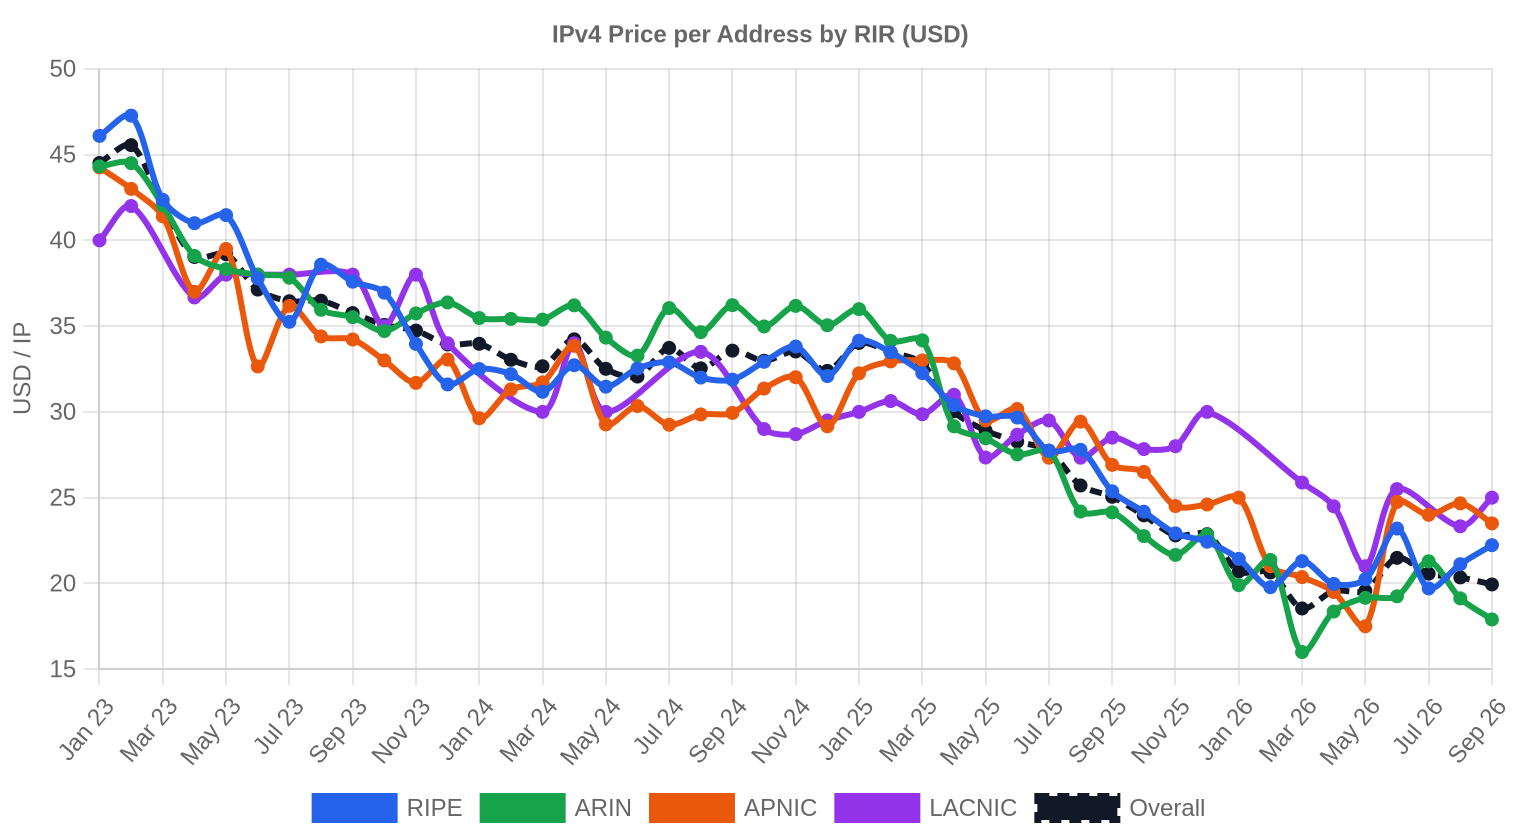
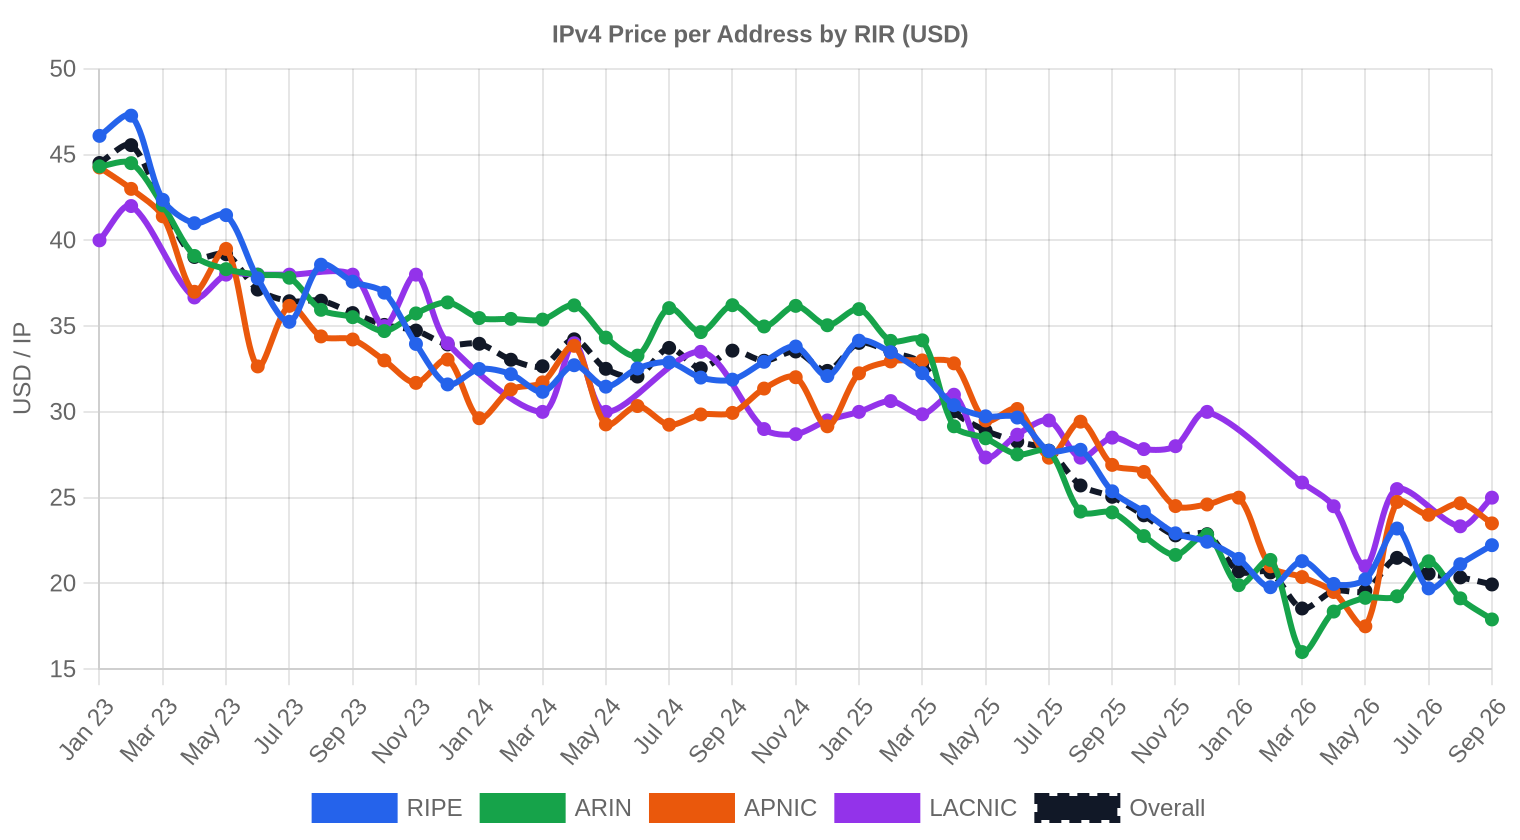
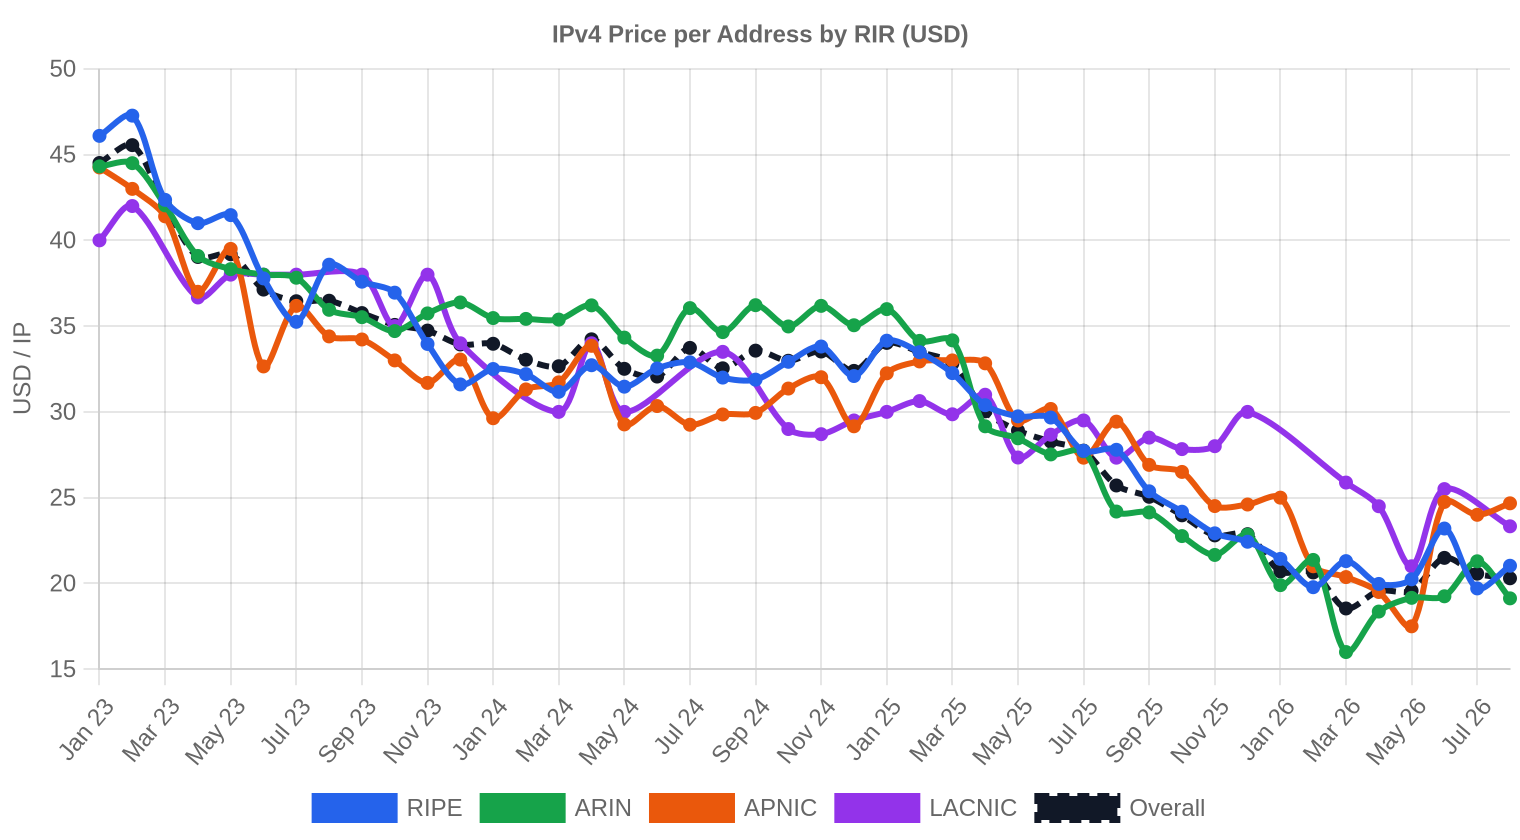
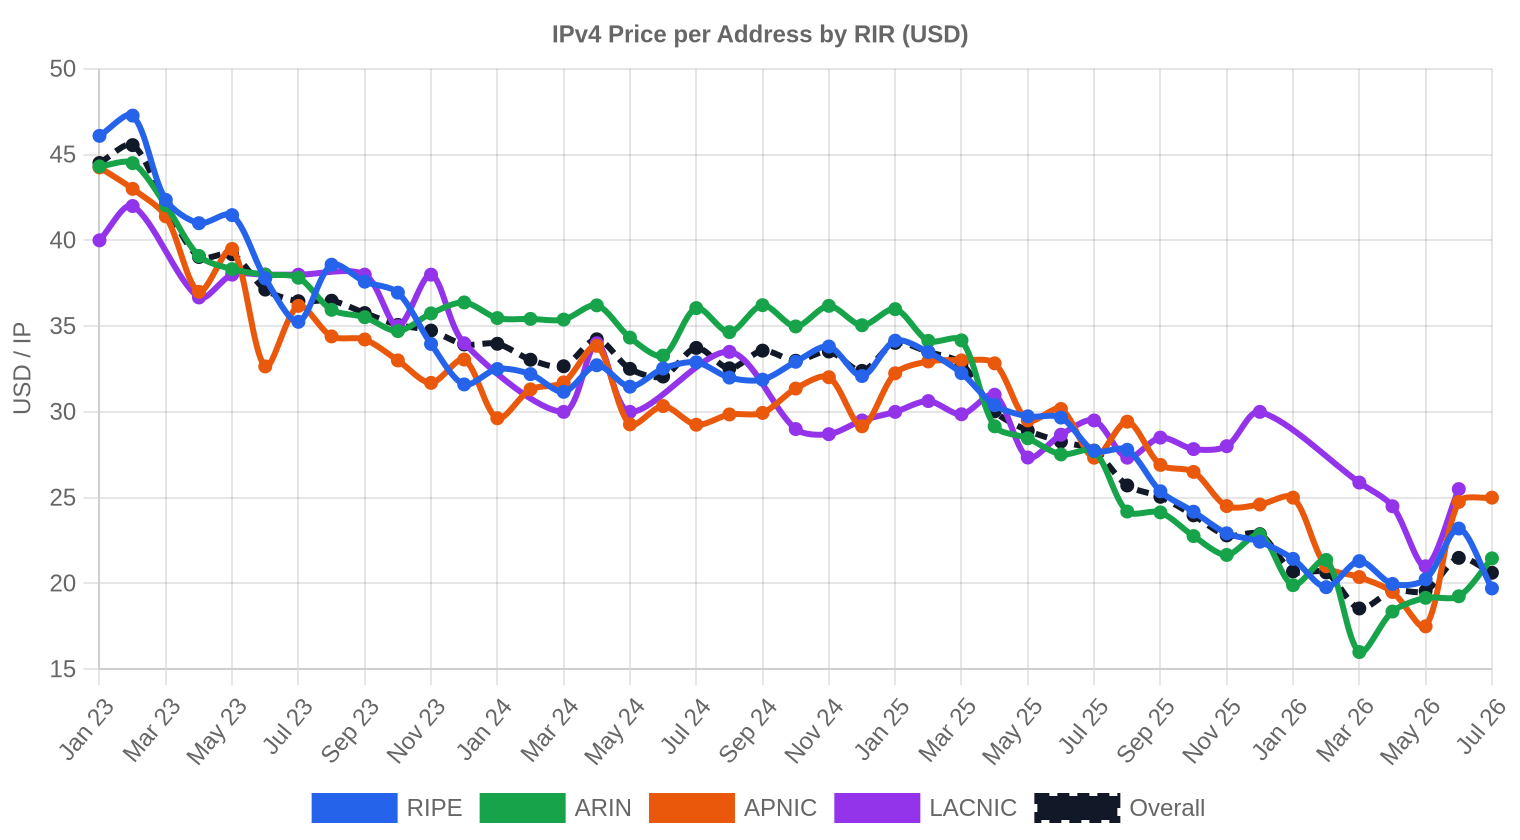
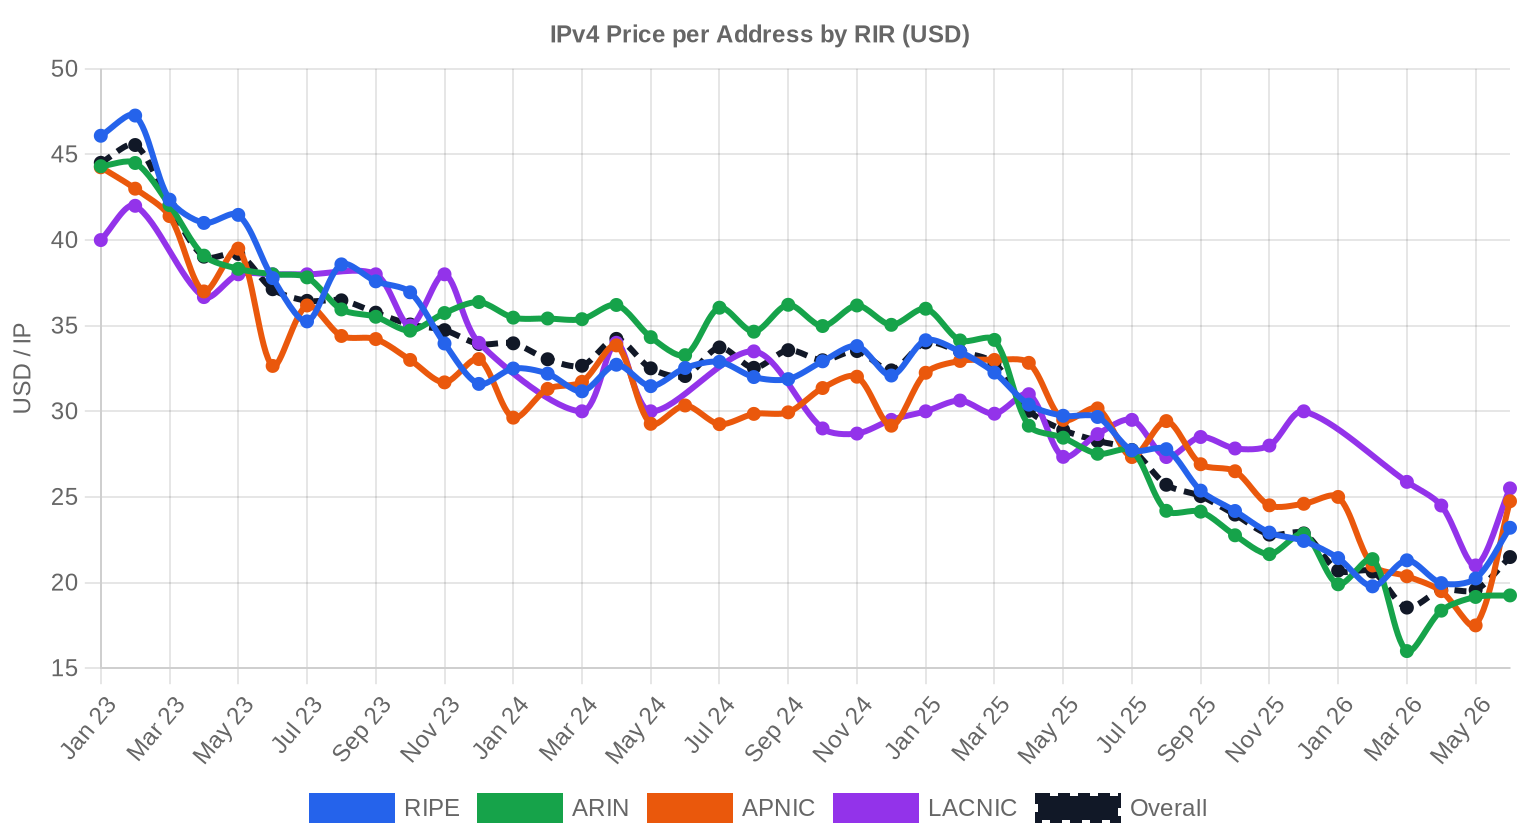
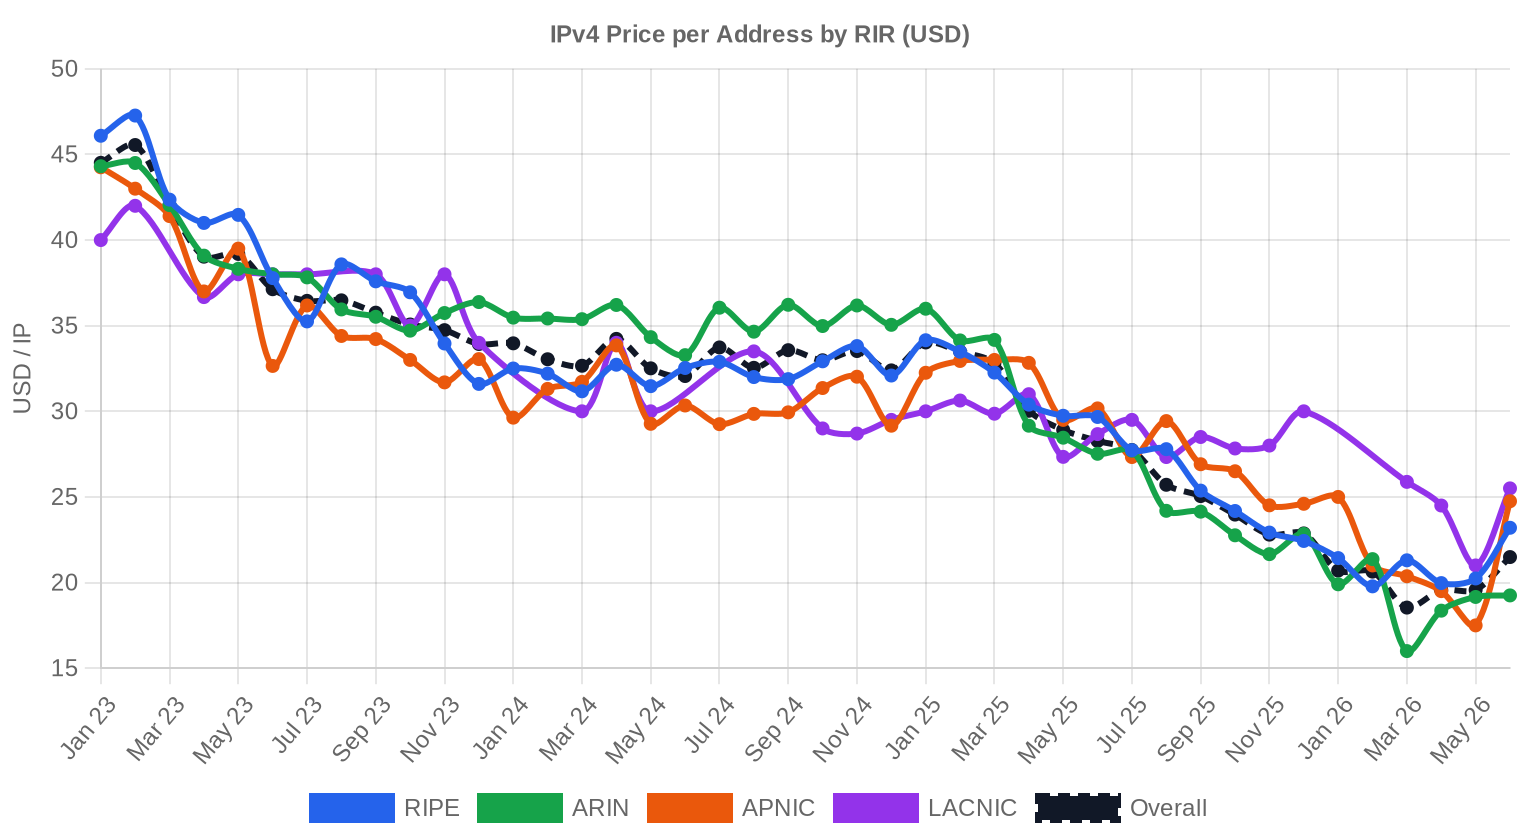
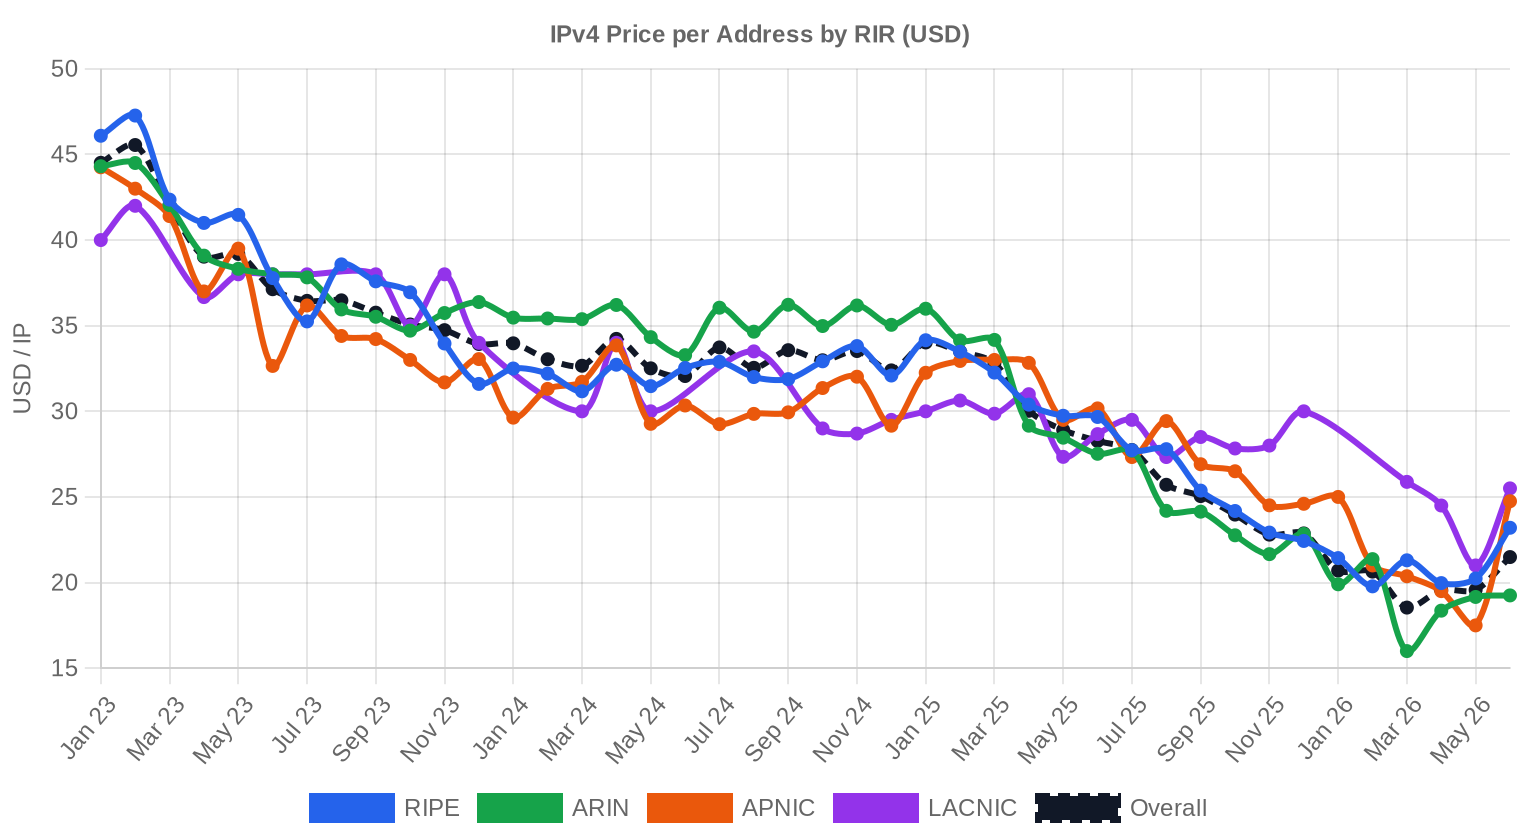
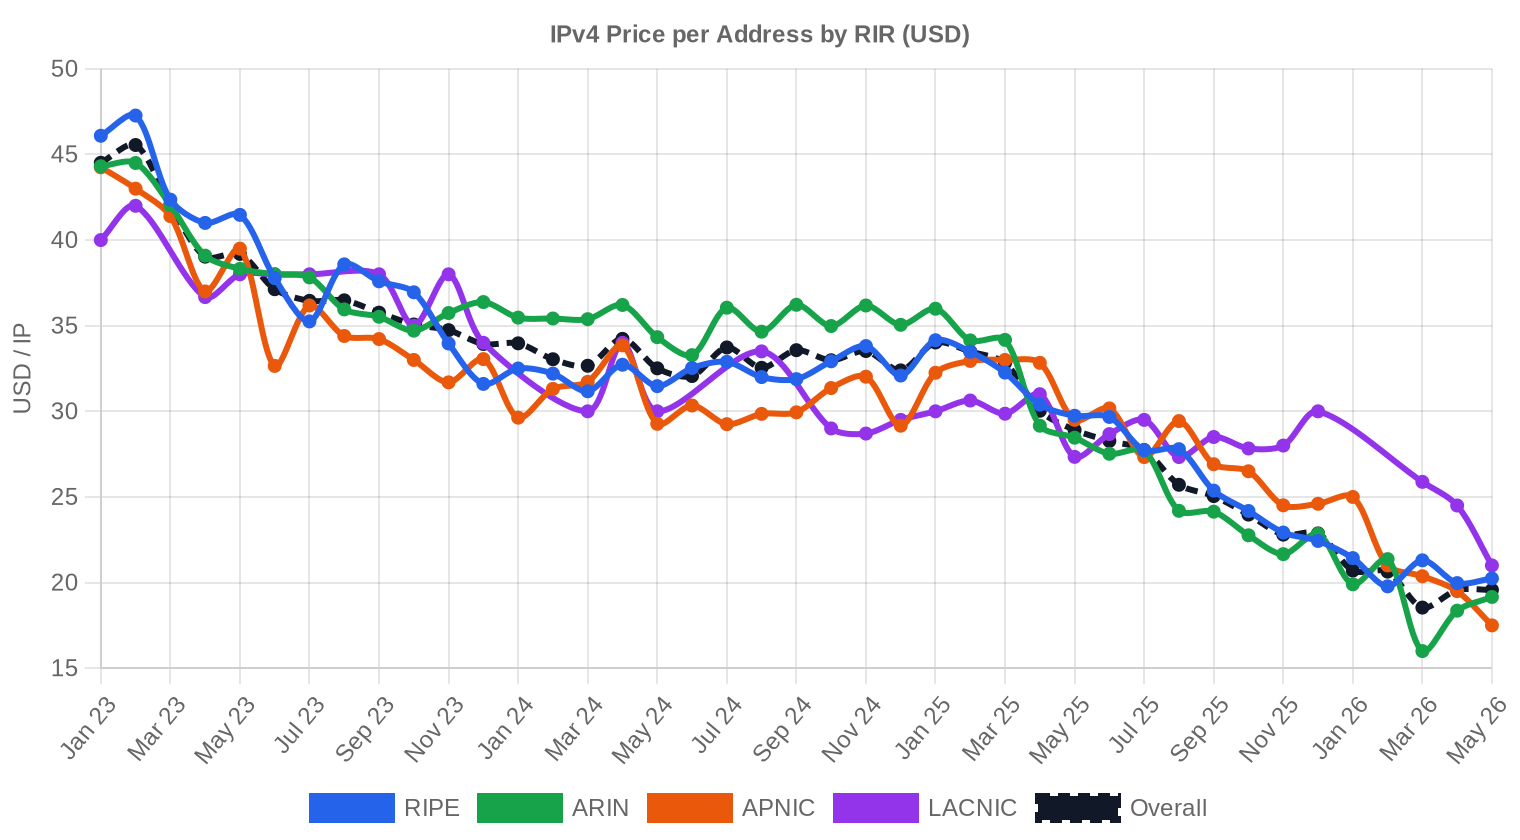
The spread between the cheapest and most expensive transactions widened to $19 this quarter — from $26/IP at the floor to $45/IP at the top. That $45 print came out of ARIN, where small-block premiums persist. The median of $32 versus the mean of $32.85 tells us the distribution is slightly right-skewed but not dramatically so; a few large-ticket ARIN deals pulled the average up. The 1.1% decline from Q3 is modest on its face, but layered on top of the 4.9% annual decline, it confirms that we're in a slow grind lower rather than any kind of floor formation. The regression model still reads a positive trend at +2.63% across the trailing window, which is a lagging artifact of early-2024 firmness that hasn't yet washed out of the dataset.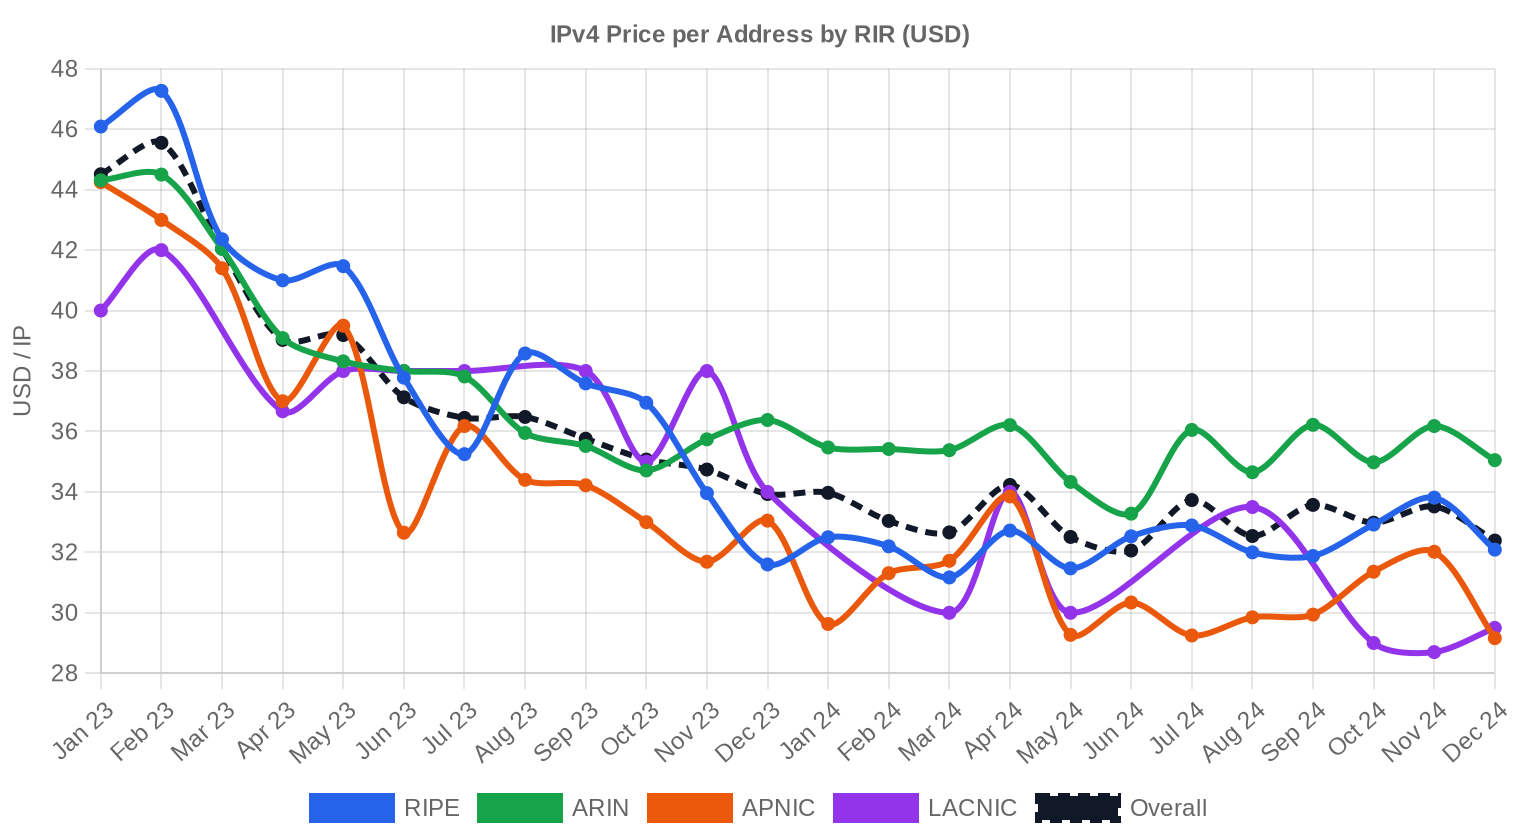
Pricing by RIR
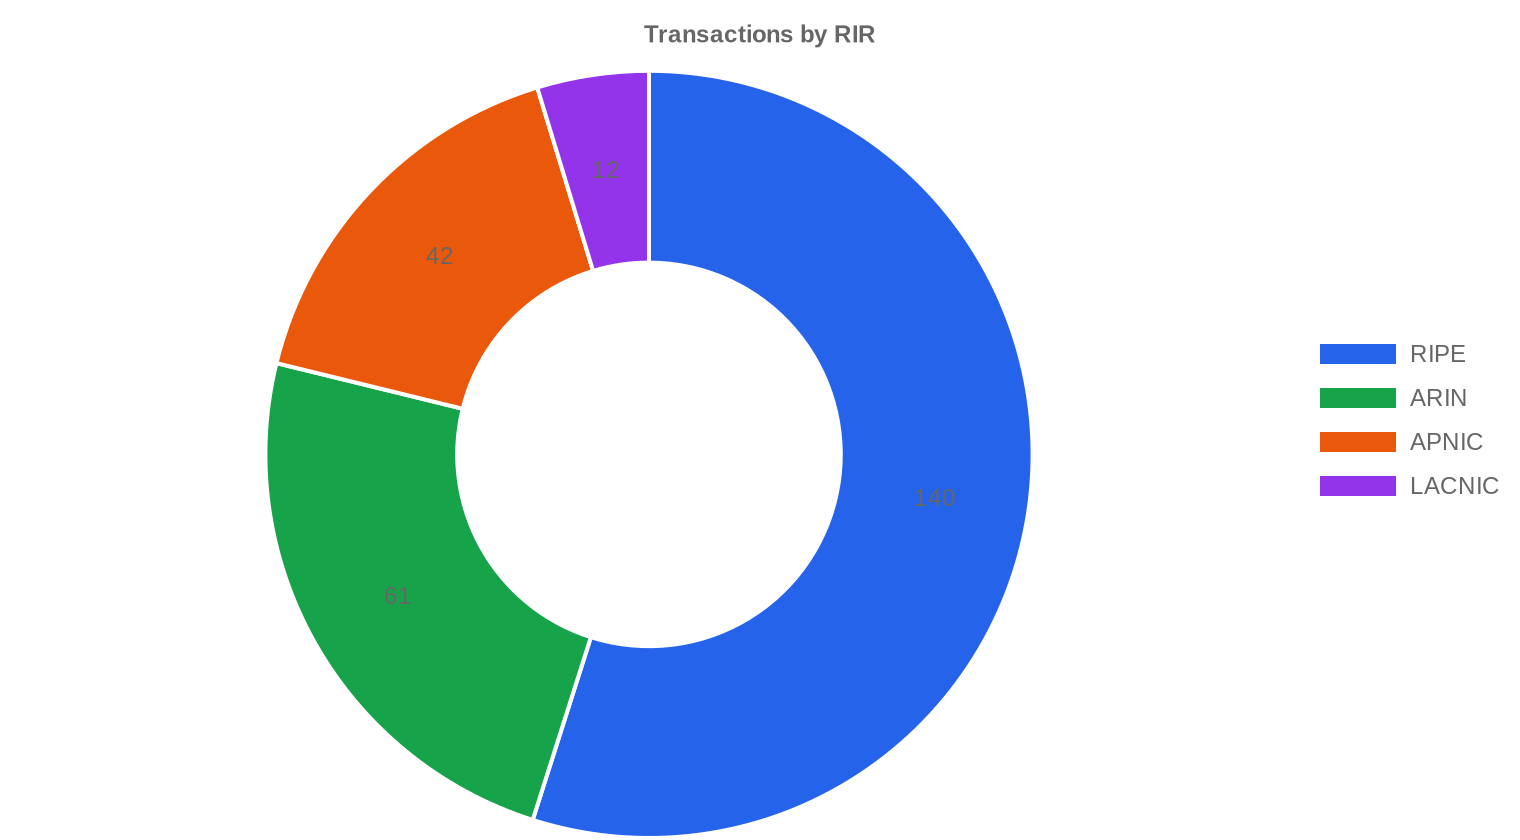
RIPE continues to dominate market activity, but the inter-RIR spread tells a more interesting story this quarter. ARIN blocks command a $2.81/IP premium over RIPE and a $3.90 premium over APNIC — the widest gap we've seen all year.RIPE: $32.52/IP average across 140 transactions (54.9% of volume). Median $32, range $27.75–$40. The workhorse of the market — deep liquidity, consistent pricing, and the tightest spread of any registry.
ARIN: $35.33/IP average across 61 transactions. Median $35, range $26–$45. The premium reflects North American demand and the relative scarcity of clean, transfer-eligible blocks. That $45 ceiling is the highest print across all RIRs this quarter.
APNIC: $31.43/IP average across 42 transactions. Median $32, range $27–$35. Asia-Pacific pricing has converged remarkably close to RIPE, essentially at parity on a median basis.
LACNIC: $28.96/IP average across just 12 transactions. Median $28, range $26.50–$38. The thinnest liquidity of any active registry, and the discount reflects both transfer complexity and limited buyer demand.
AFRINIC: Zero recorded transactions. The governance crisis continues to freeze this market entirely.
| RIR | Transactions | Avg $/IP | Median $/IP | IPs Traded | RIR Transfers | Next Month (proj.) | Year-End (proj.) |
|---|---|---|---|---|---|---|---|
| RIPE | 140 | $32.52 | $32.00 | 508,672 | 1,893 | $32.00 | $32.50 |
| ARIN | 61 | $35.33 | $35.00 | 160,256 | 1,210 | $34.50 | $35.50 |
| APNIC | 42 | $31.43 | $32.00 | 150,784 | 0 | $29.50 | $29.00 |
| LACNIC | 12 | $28.96 | $28.00 | 18,176 | 0 | $29.00 | $28.00 |
Transaction Volume
Supply & Block Sizes
The /24 remained the most traded prefix size at 89 transactions — roughly 35% of all deals. This is consistent with the structural reality that /24s are the minimum routable block on most networks and the entry point for smaller buyers. The 65.6% volume surge suggests sellers are bringing inventory to market at an accelerating clip, possibly motivated by the persistent downward drift in per-IP pricing and a desire to liquidate before further erosion.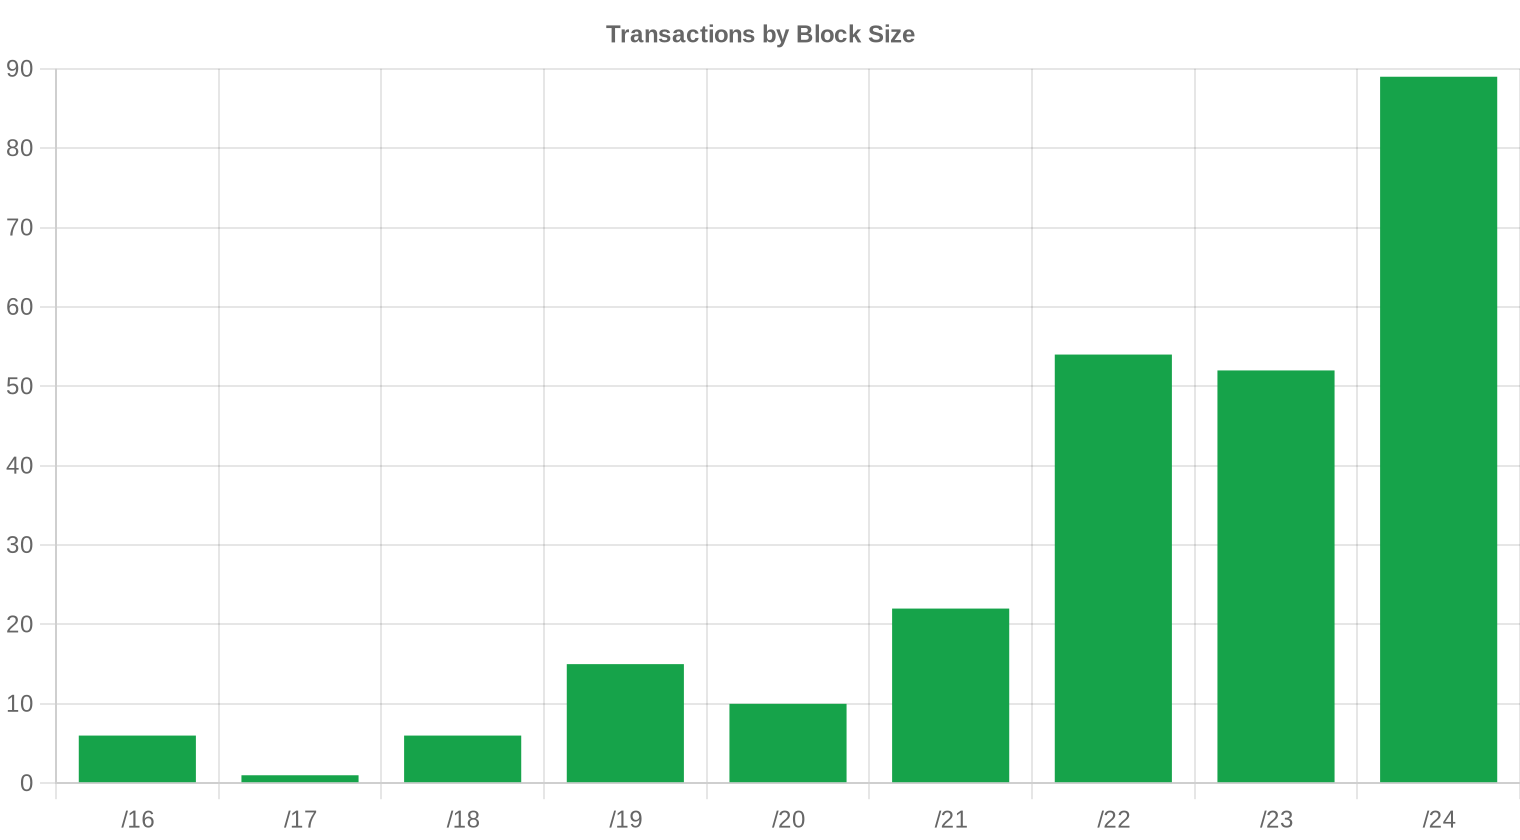
Geographic Activity
Country-level transaction data was not available for Q4 2024. Based on RIR distribution, European buyers and sellers accounted for the majority of activity through RIPE, with North America a distant second via ARIN at 61 transactions. Asia-Pacific held steady with 42 APNIC deals, roughly proportional to prior quarters.Registry Transfer Activity
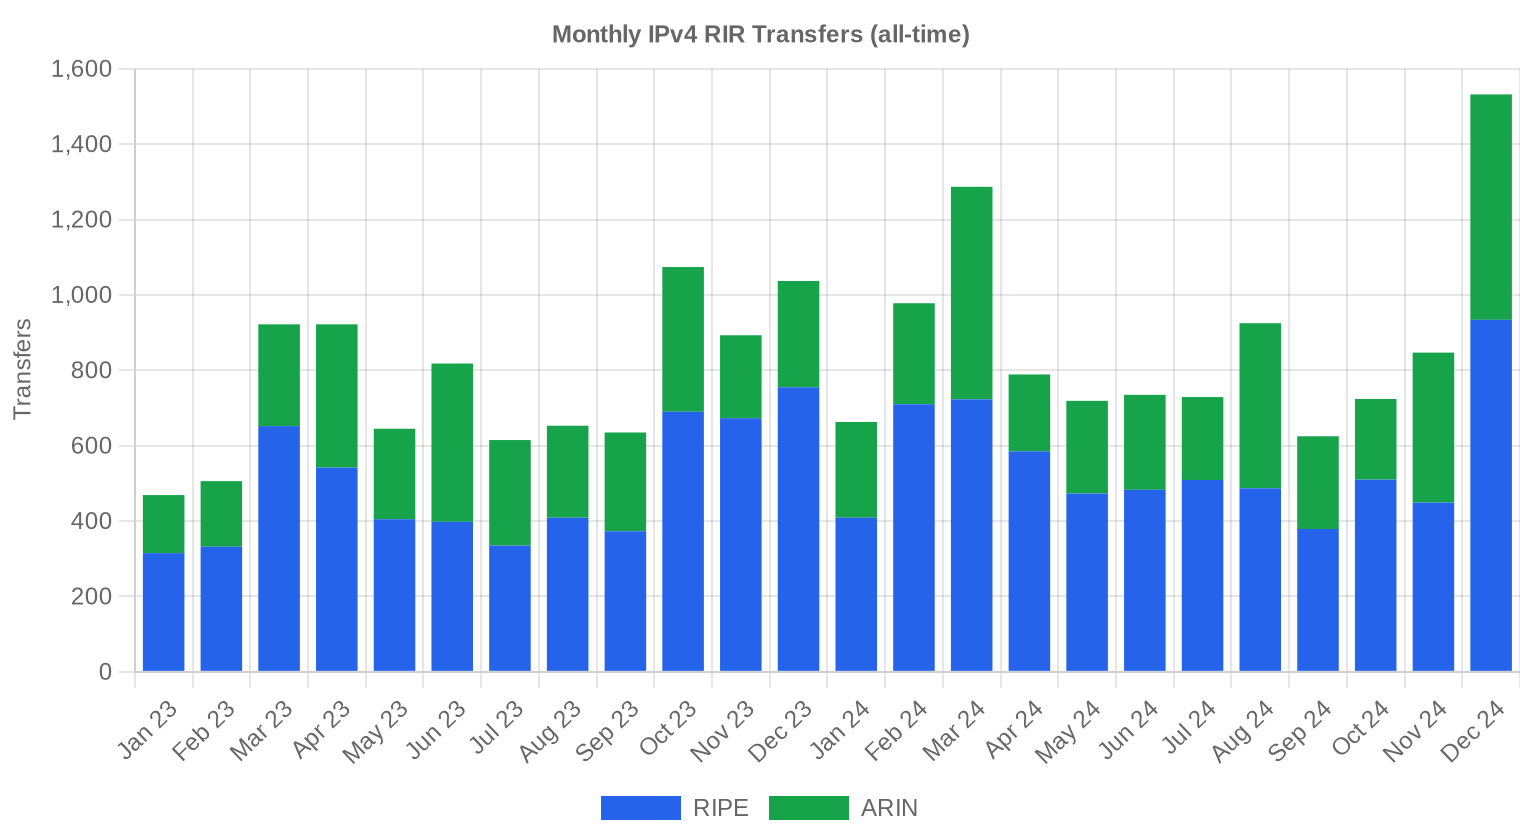
Official RIR transfer registries recorded 3,103 transfers in Q4 2024 — a figure that includes both market transactions and intra-organizational moves. RIPE led with 1,893 transfers (61%), followed by ARIN at 1,210 (39%). APNIC, LACNIC, and AFRINIC recorded zero official transfers during the period, reflecting either reporting lags or policy-driven inactivity.Long-Run Transfer Trends
Over the trailing 24 months, cumulative RIR-recorded transfers reached 19,742 — a substantial dataset that confirms the structural depth of this market. The peak month was December 2024, consistent with the year-end rush we see annually as buyers close out budget cycles and sellers accelerate deals before fiscal year-end. The RIPE/ARIN split over this window runs 63.5% to 36.5%, essentially unchanged from the quarterly ratio, which tells us the geographic mix of activity is stable.| RIR | RIR Transfers |
|---|---|
| RIPE | 12,530 |
| ARIN | 7,212 |
| RIR Transfers | 19,742 |
Outlook & Forecast
Forecasting each block-size band and RIR separately with our AI model:
The overall average price per IP is projected to reach $32.84 by December 2024, with a next-month estimate of $32.75 per IP.
- RIPE: projected at $32.00 per IP next month, trending toward $32.50 by December 2024.
- ARIN: projected at $34.50 per IP next month, trending toward $35.50 by December 2024.
- APNIC: projected at $29.50 per IP next month, trending toward $29.00 by December 2024.
- LACNIC: projected at $29.00 per IP next month, trending toward $28.00 by December 2024.
- AFRINIC: insufficient data for a reliable forecast.

Forecast by Block Size
| Block | Current $/IP | Next Month | Year-End | Confidence |
|---|---|---|---|---|
| /24 | $32.00 | $33.50 (+4.7%) | $33.00 (+3.1%) | medium |
| /23 | $32.00 | $32.00 (0.0%) | $32.50 (+1.6%) | medium |
| /22 | $32.00 | $32.00 (0.0%) | $32.00 (0.0%) | medium |
| /21 | $32.00 | $32.00 (0.0%) | $32.50 (+1.6%) | medium |
| /20 | $33.00 | $33.00 (0.0%) | $34.00 (+3.0%) | low |
| /19 | $35.00 | $34.50 (-1.4%) | $35.50 (+1.4%) | low |
| /18-/16 | $31.00 | $31.50 (+1.6%) | $32.00 (+3.2%) | low |
| /15-up | $51.50 | $50.00 (-2.9%) | $50.00 (-2.9%) | low |
Editor's Take: Buy vs. Lease
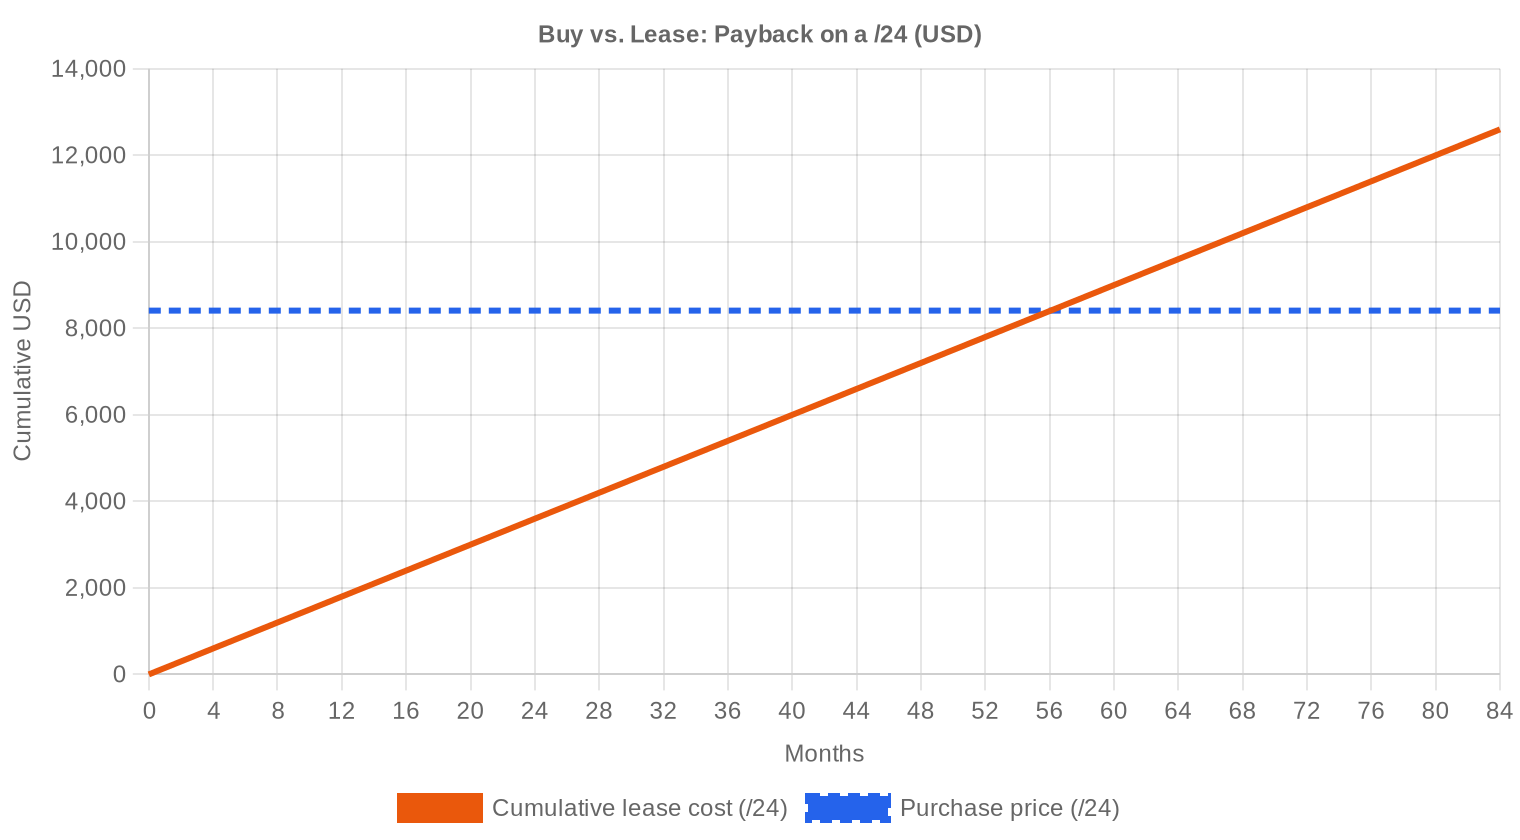
The buy-versus-lease math is unambiguous this quarter, and it favors buying. At $32.85/IP purchase price and $0.5859/IP monthly lease rate, the breakeven is 56.1 months — just under 4.7 years. Any organization planning to use IPv4 addresses for five or more years is leaving money on the table by leasing. The implied annual yield on a leased block is 21.4%, which is extraordinary for any asset class, and it tells you the leasing market hasn't yet repriced to reflect the decline in purchase prices. For buyers, the current flat-to-declining price environment removes urgency — there's no penalty for taking an extra month to negotiate. For sellers, the volume surge this quarter suggests others share the view that it's better to monetize now than wait for a recovery that the data doesn't support.| /24 Purchase price | $8,410 |
| /24 Lease price | $150 / mo |
| Payback period | 56.1 mo (4.7 yr) |
| Gross annual yield | 21.4% |
What This Means for You
Buyers: You're operating in a buyer's market for the first time in several years. Prices are down 4.9% year-over-year and the volume surge means more inventory is available. Use the competition among sellers to negotiate — particularly in RIPE, where 140 deals closed this quarter alone. There's no rush; the forecast is flat.Sellers: The 65.6% jump in transaction volume signals that other holders are moving to liquidate. If you've been waiting for a price recovery, the trend is not cooperating. Listing now captures current demand before further supply enters the market.
Leasers: At $0.59/IP per month, leasing remains viable for short-duration needs under four years. Beyond that, the economics shift decisively toward ownership. Reassess your lease commitments against a purchase at current prices.
Block Holders: The 21.4% annual yield on leased blocks is attractive if you're not ready to sell. Leasing generates cash while preserving optionality. But monitor pricing — if per-IP values continue to erode, the capital loss can offset lease income over a multi-year hold.
Browse verified IPv4 blocksSell IPv4 →
List your blocks with managed transferLease IPv4 →
Flexible short-term capacityLease Out IPv4 →
Turn idle blocks into recurring revenue
IPv4 Pricing by Block Size
Small blocks carry a meaningful premium. A /24 (256 IPs) at the market average prices out at roughly $8,410 — but actual /24 transactions frequently clear above average due to the minimum-routable-unit premium. At the other end, /16 blocks (65,536 IPs) trade at or below the per-IP average because buyers at that scale have negotiating leverage and sellers need to find the limited pool of buyers who can absorb that volume. The spread between /24 and /16 per-IP pricing remains in the 15–25% range, consistent with prior quarters.| Block | IPs | Buy: /IP | Buy: Total | Lease: /IP/mo | Lease: Monthly |
|---|---|---|---|---|---|
| /24 | 256 | $35–45 | $8,960–11,520 | $0.38–0.50 | $97–128 |
| /22 | 1,024 | $28–38 | $28,672–38,912 | $0.33–0.45 | $338–461 |
| /20 | 4,096 | $22–32 | $90,112–131,072 | $0.30–0.40 | $1,229–1,638 |
| /18 | 16,384 | $20–30 | $327,680–491,520 | $0.30–0.38 | $4,915–6,226 |
| /16 | 65,536 | $18–28 | $1,179,648–1,835,008 | $0.30–0.35 | $19,661–22,938 |
IPv4 Price History: 2011–2026
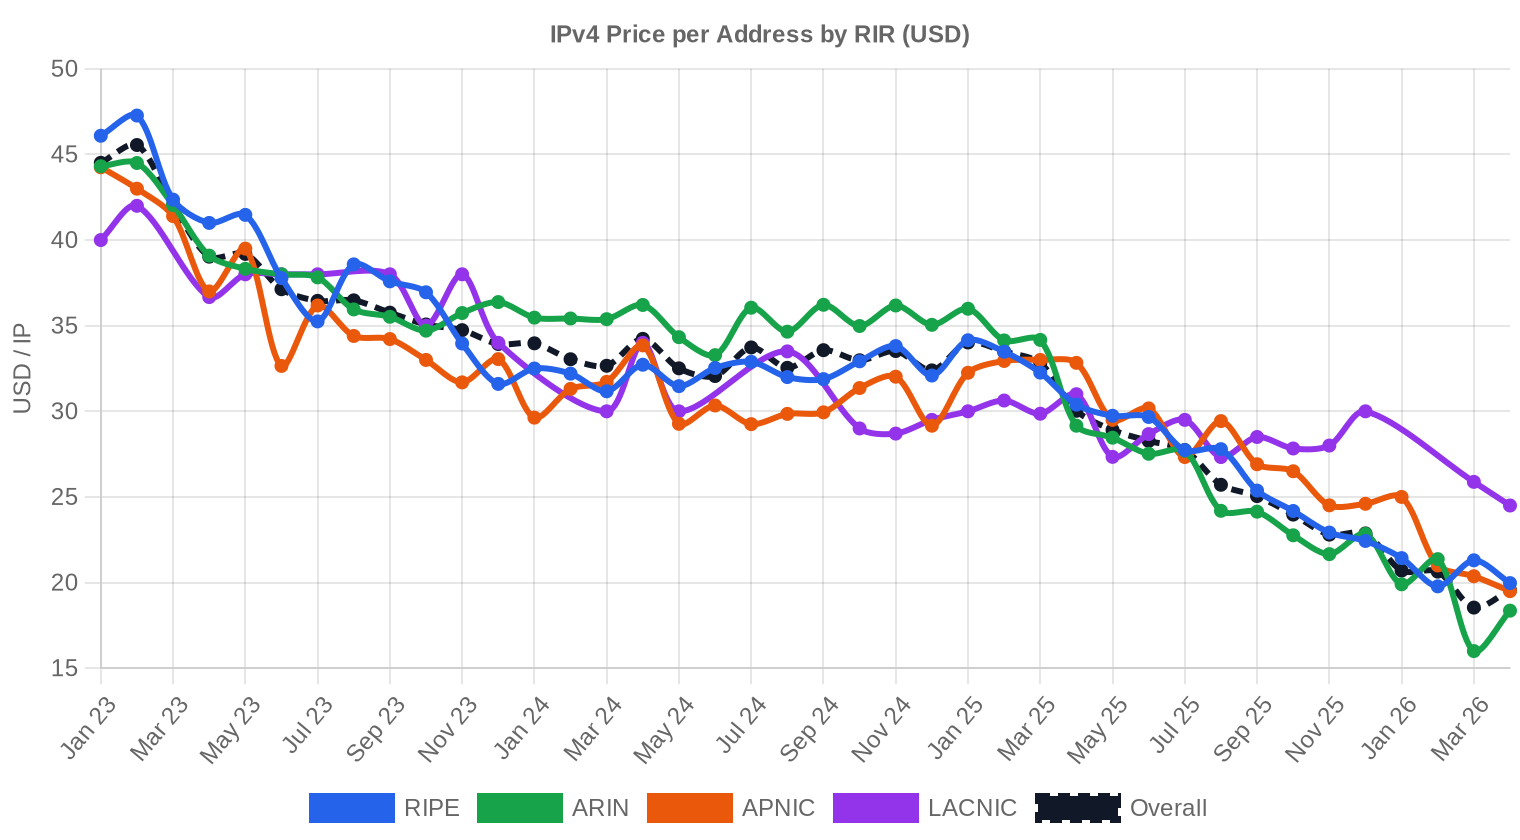
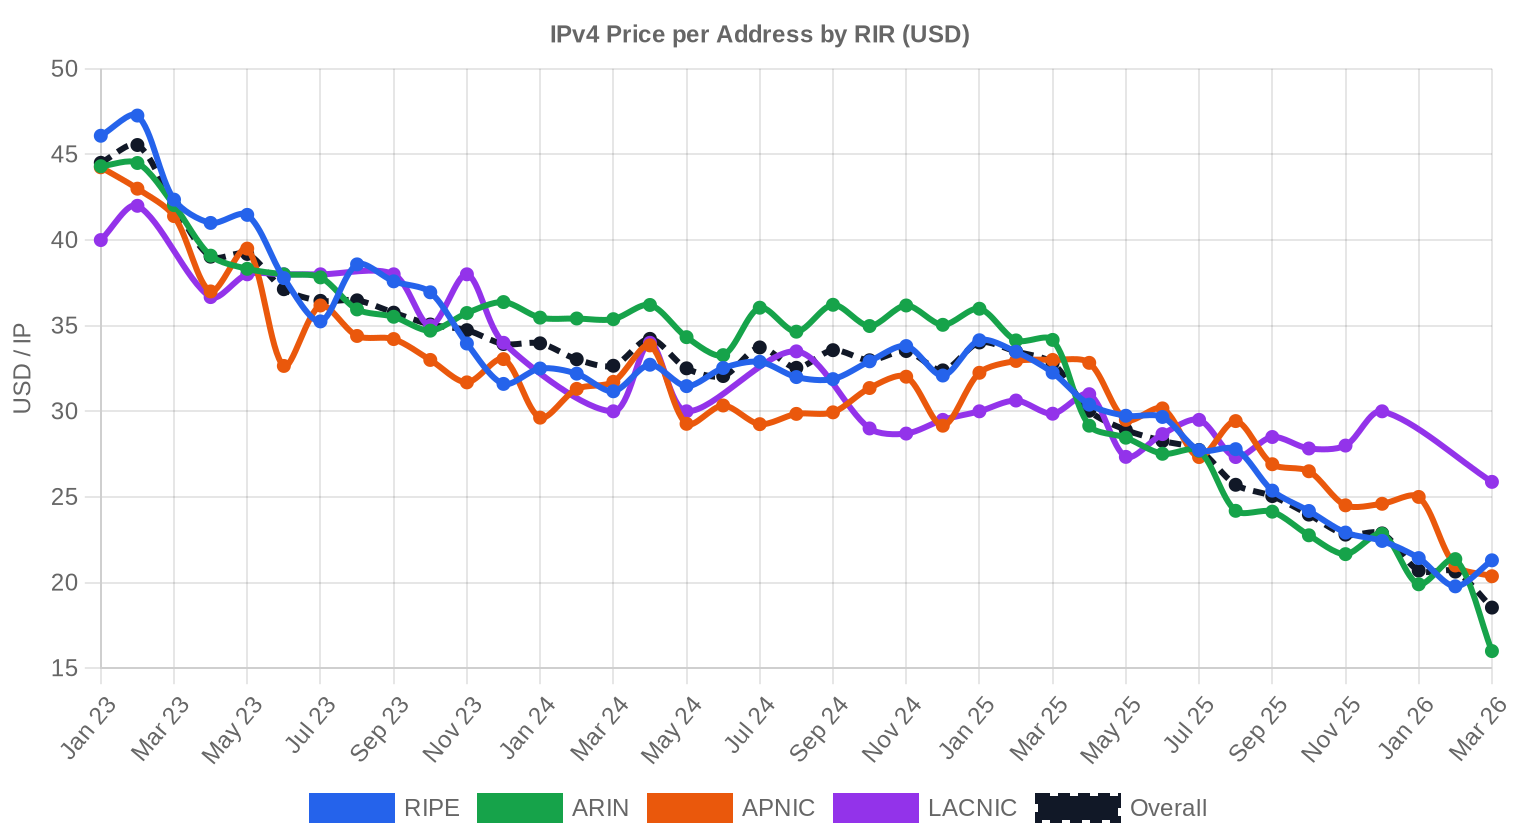
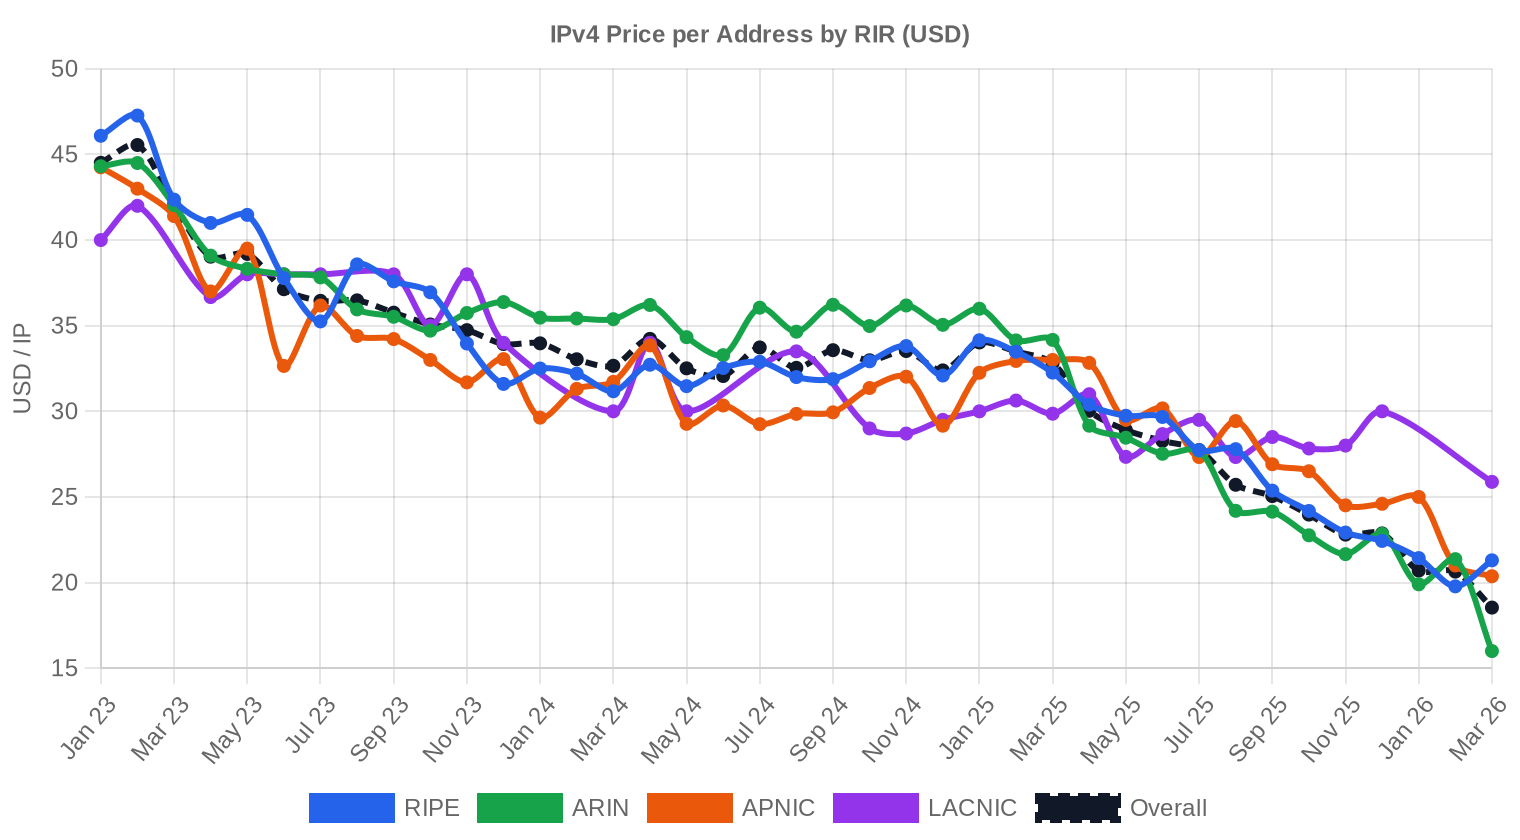
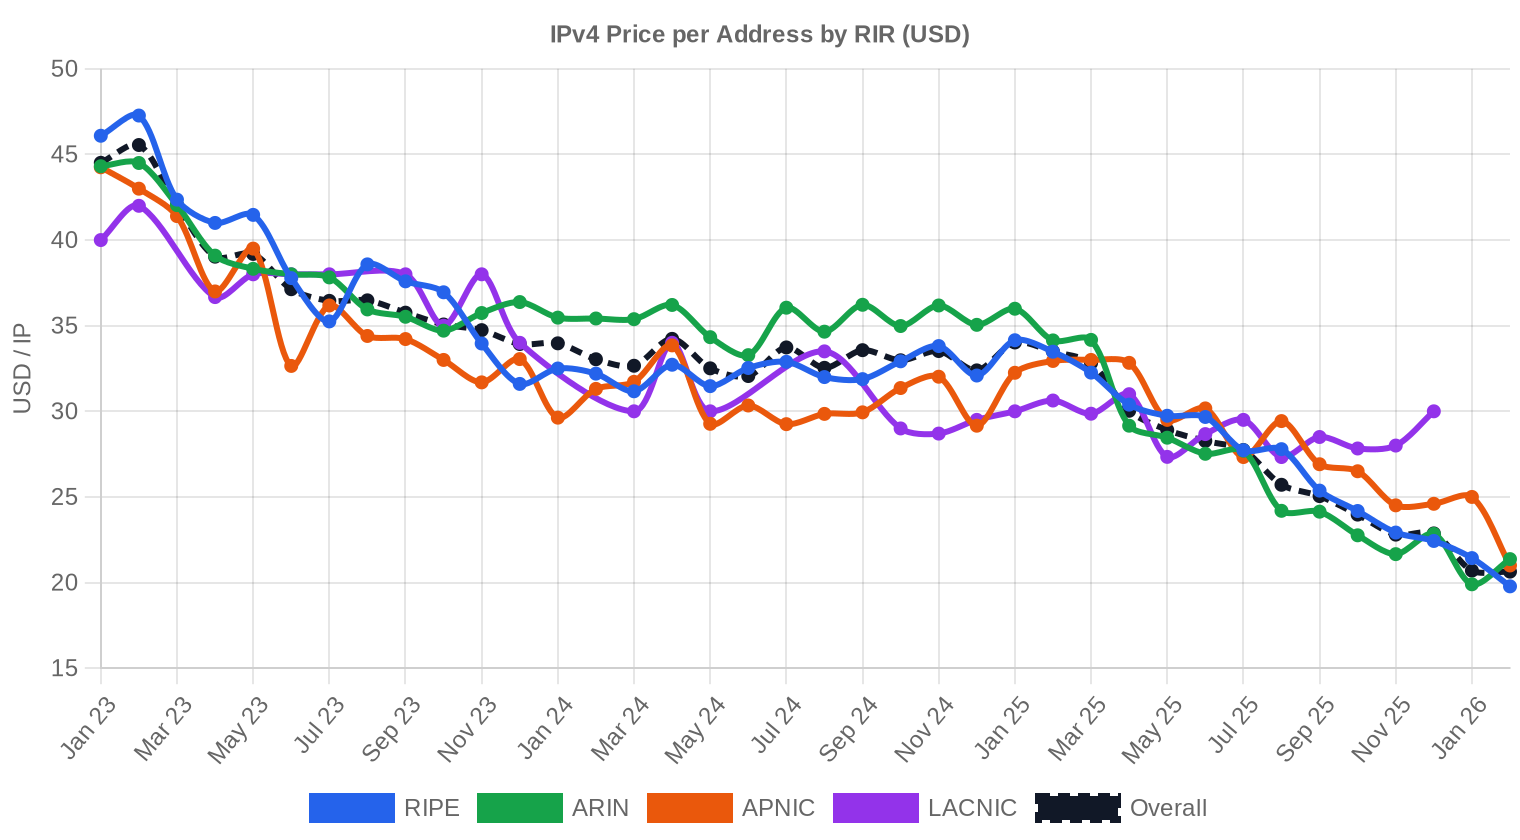
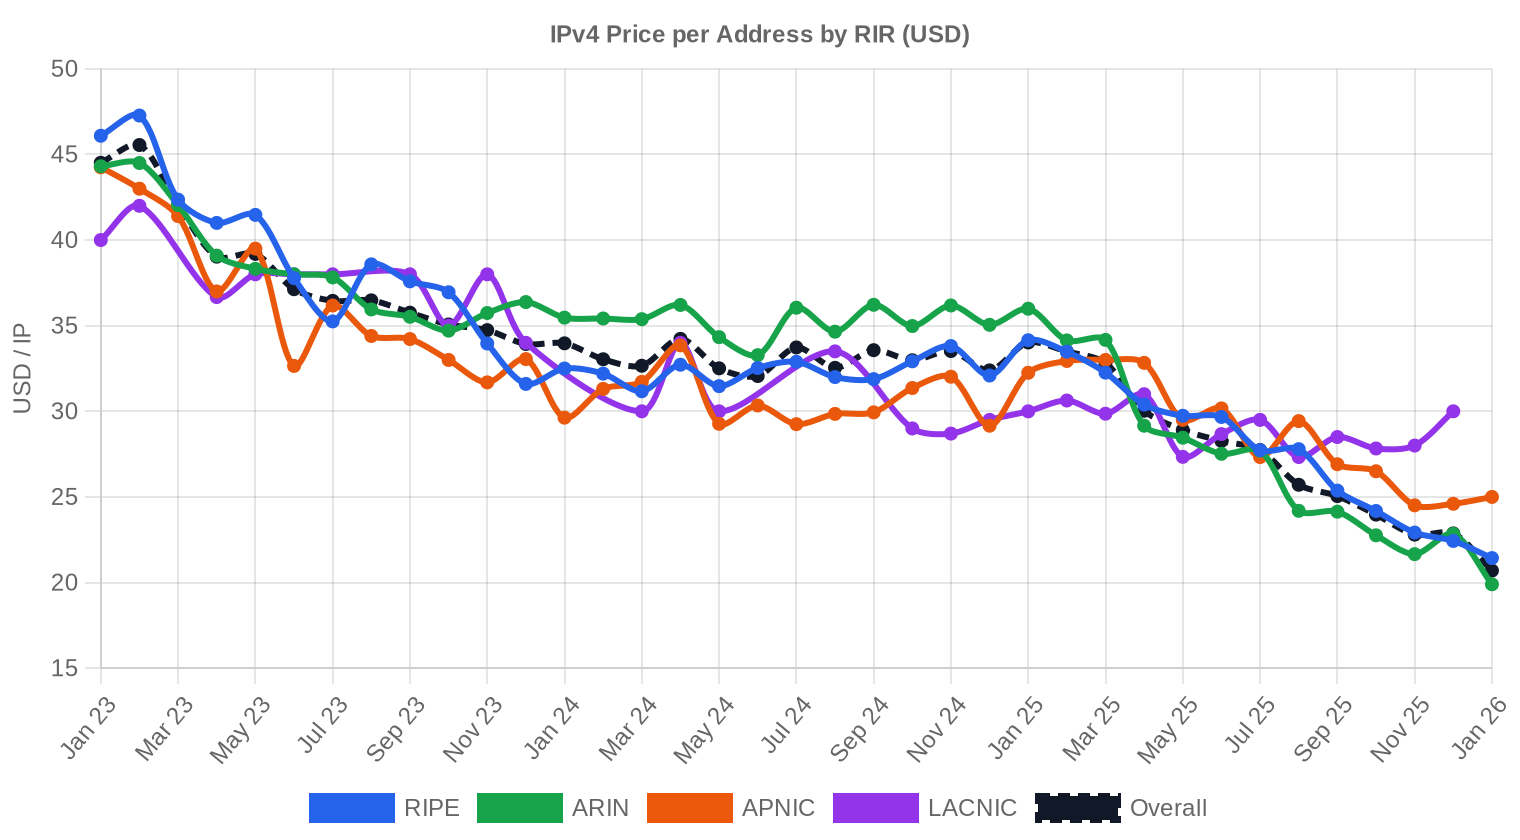
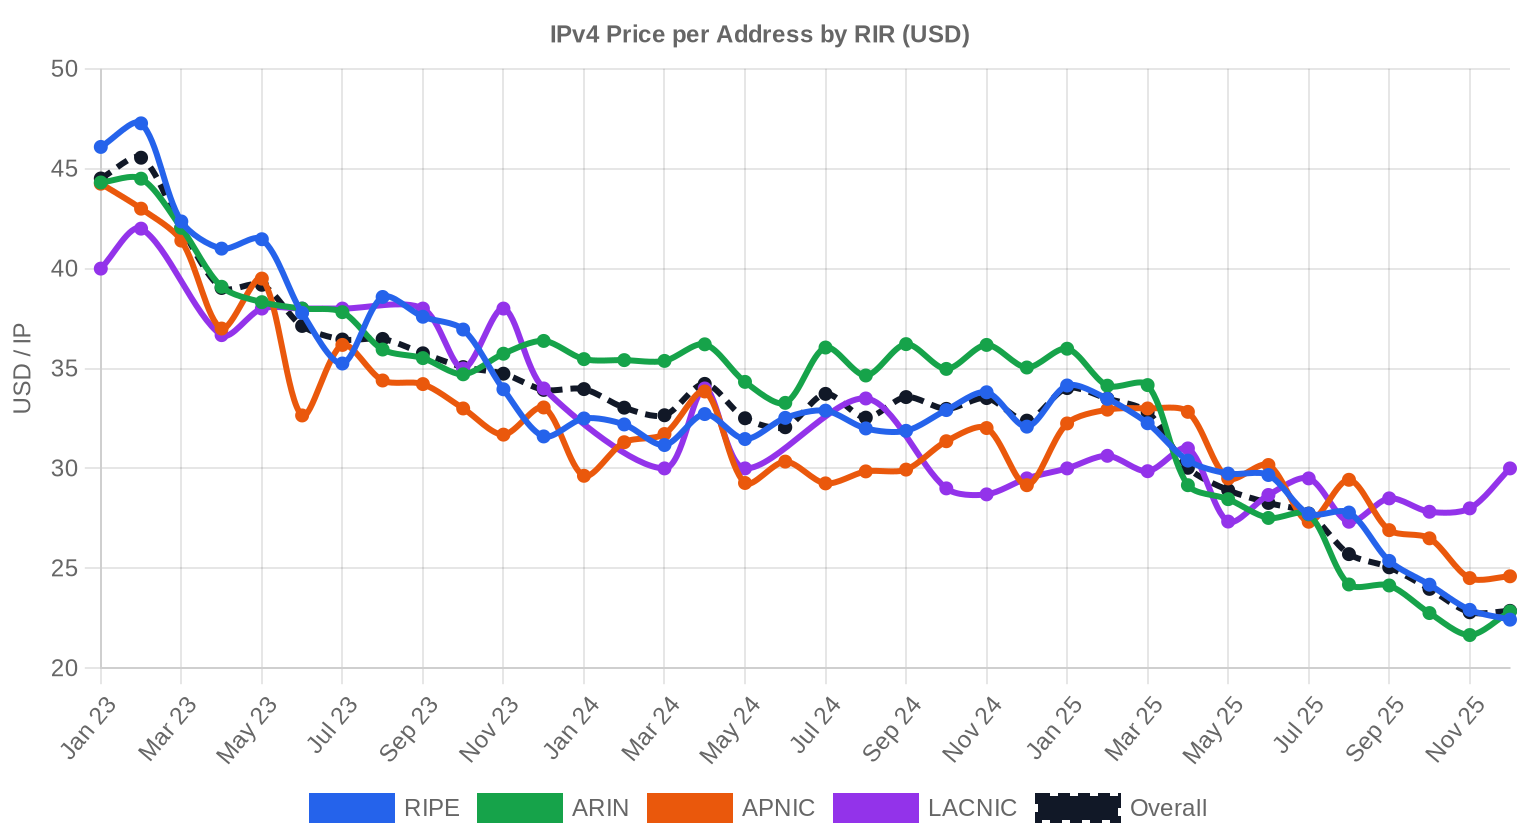
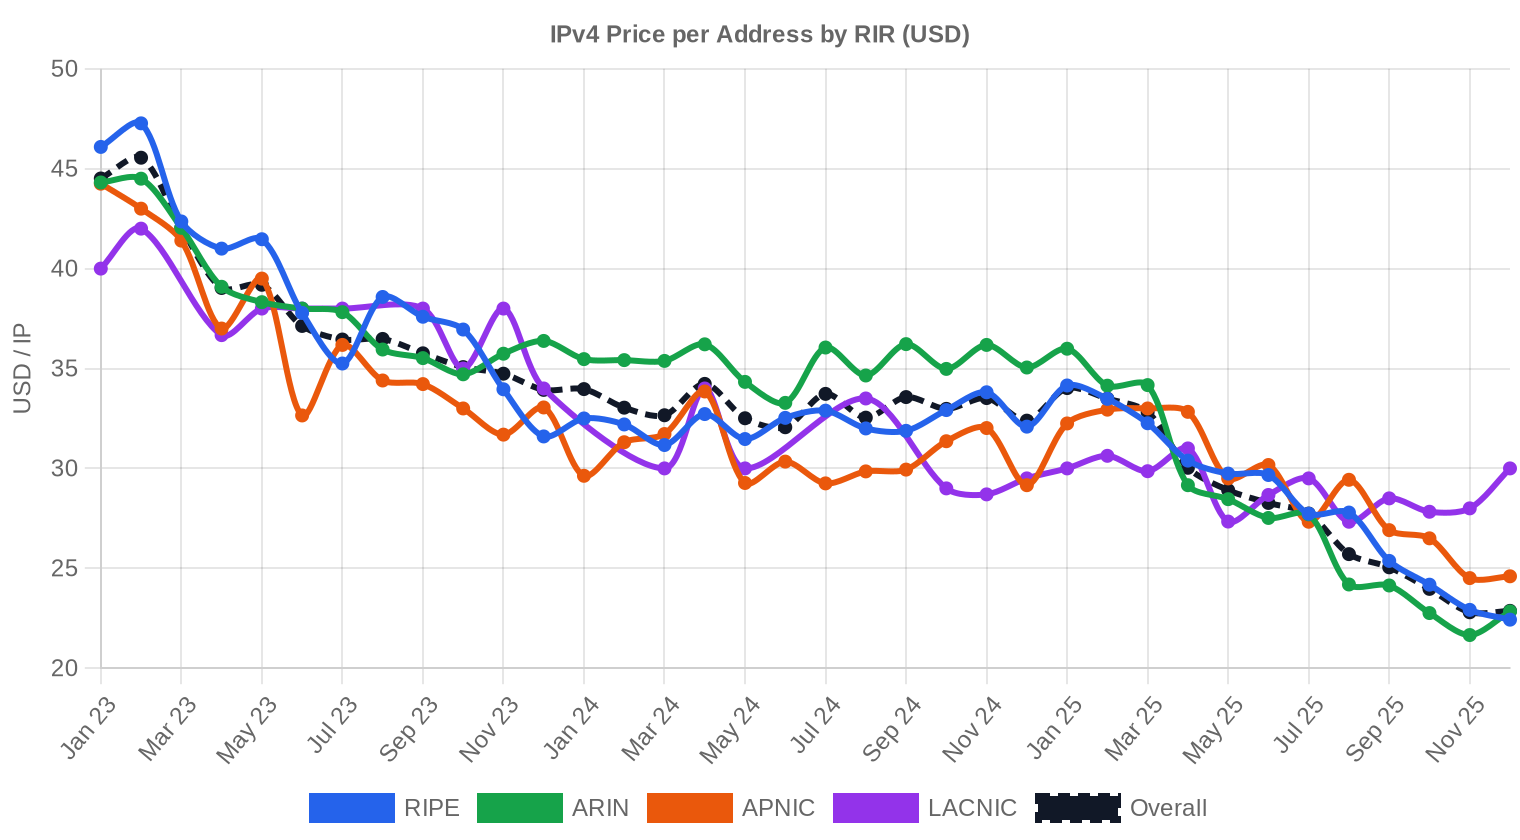
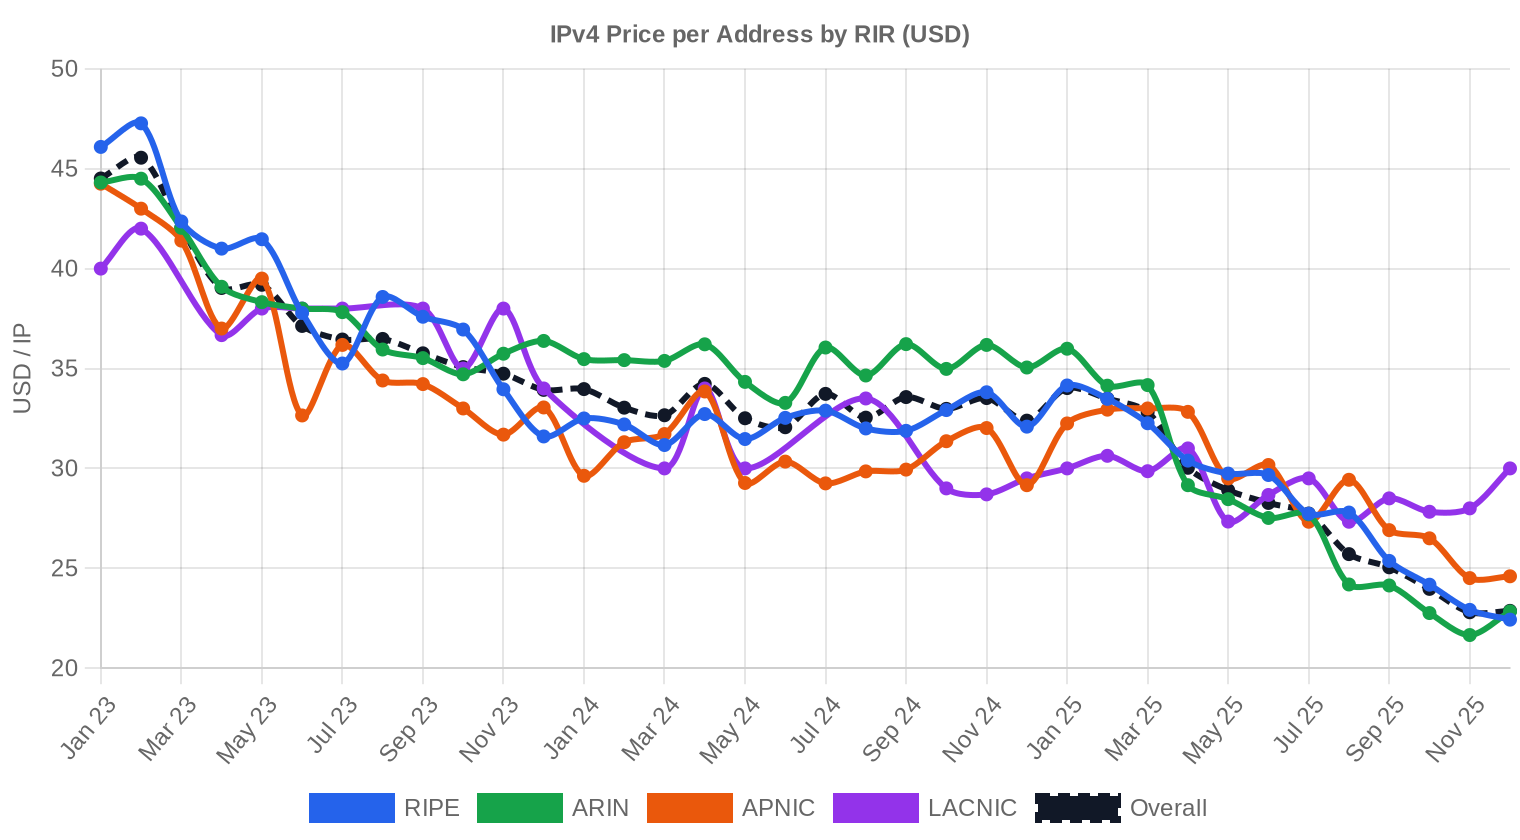
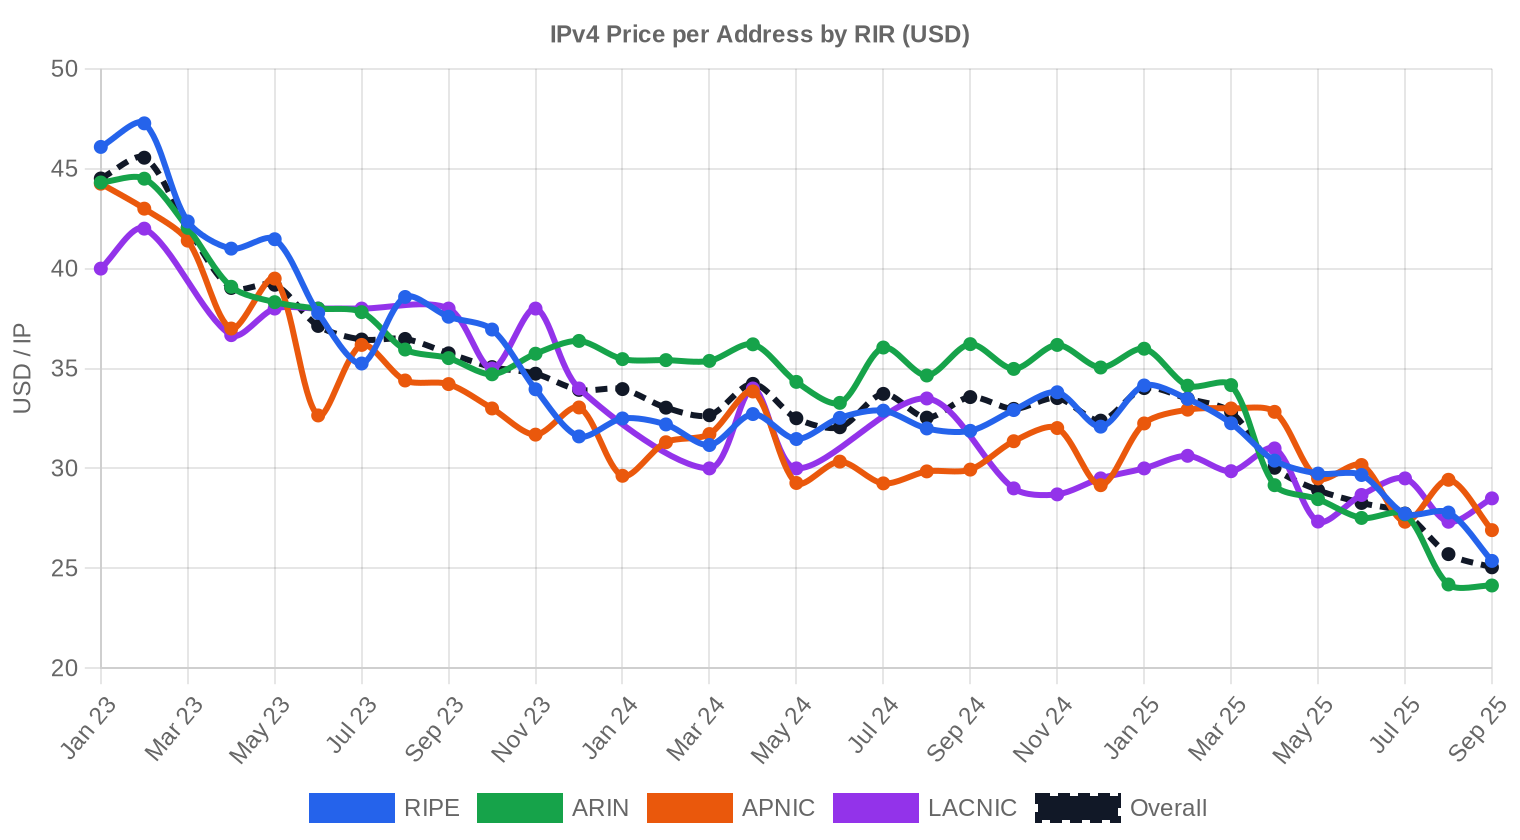
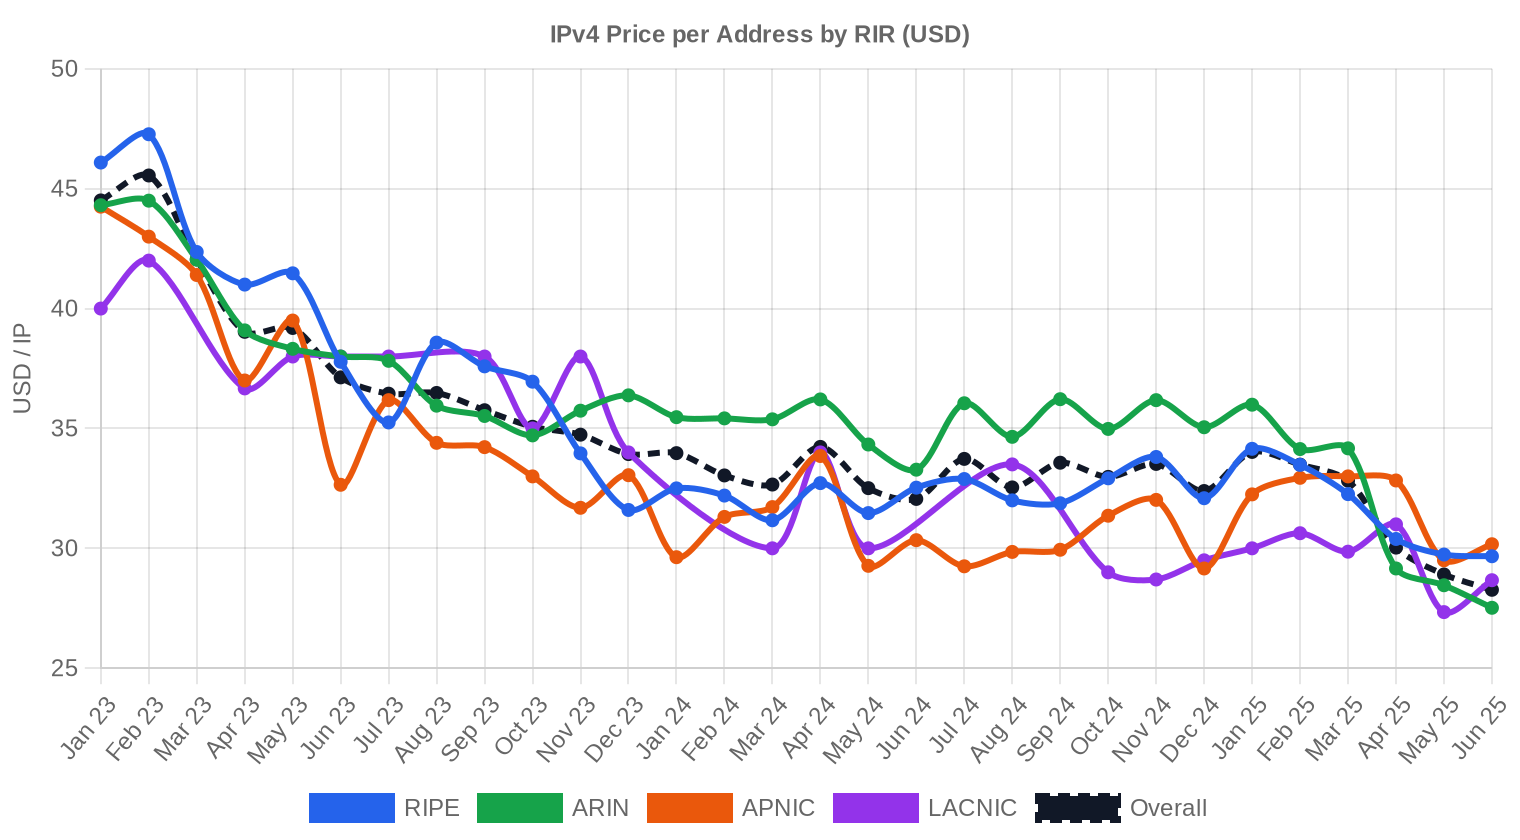
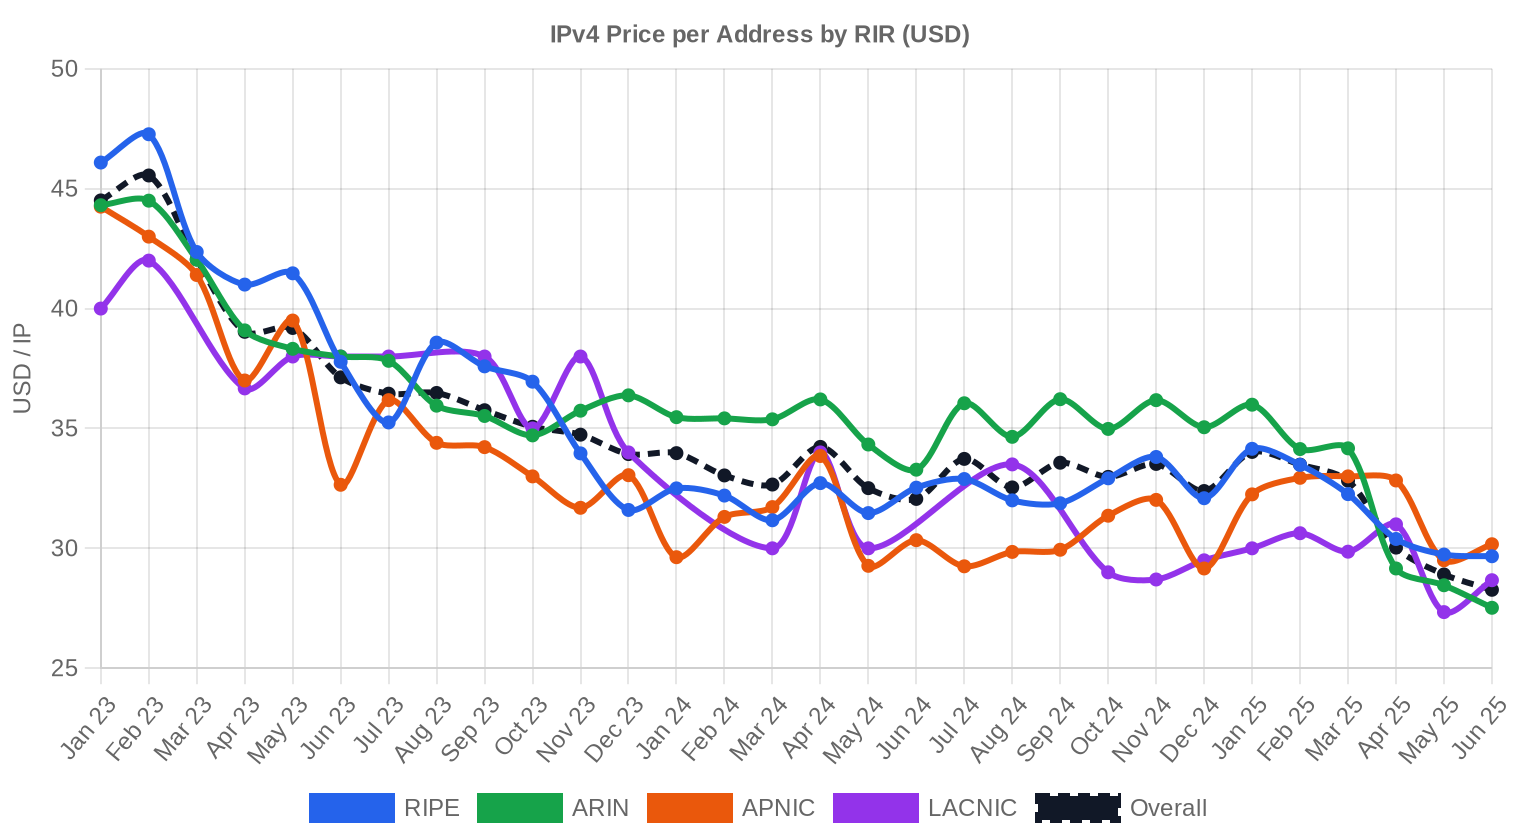
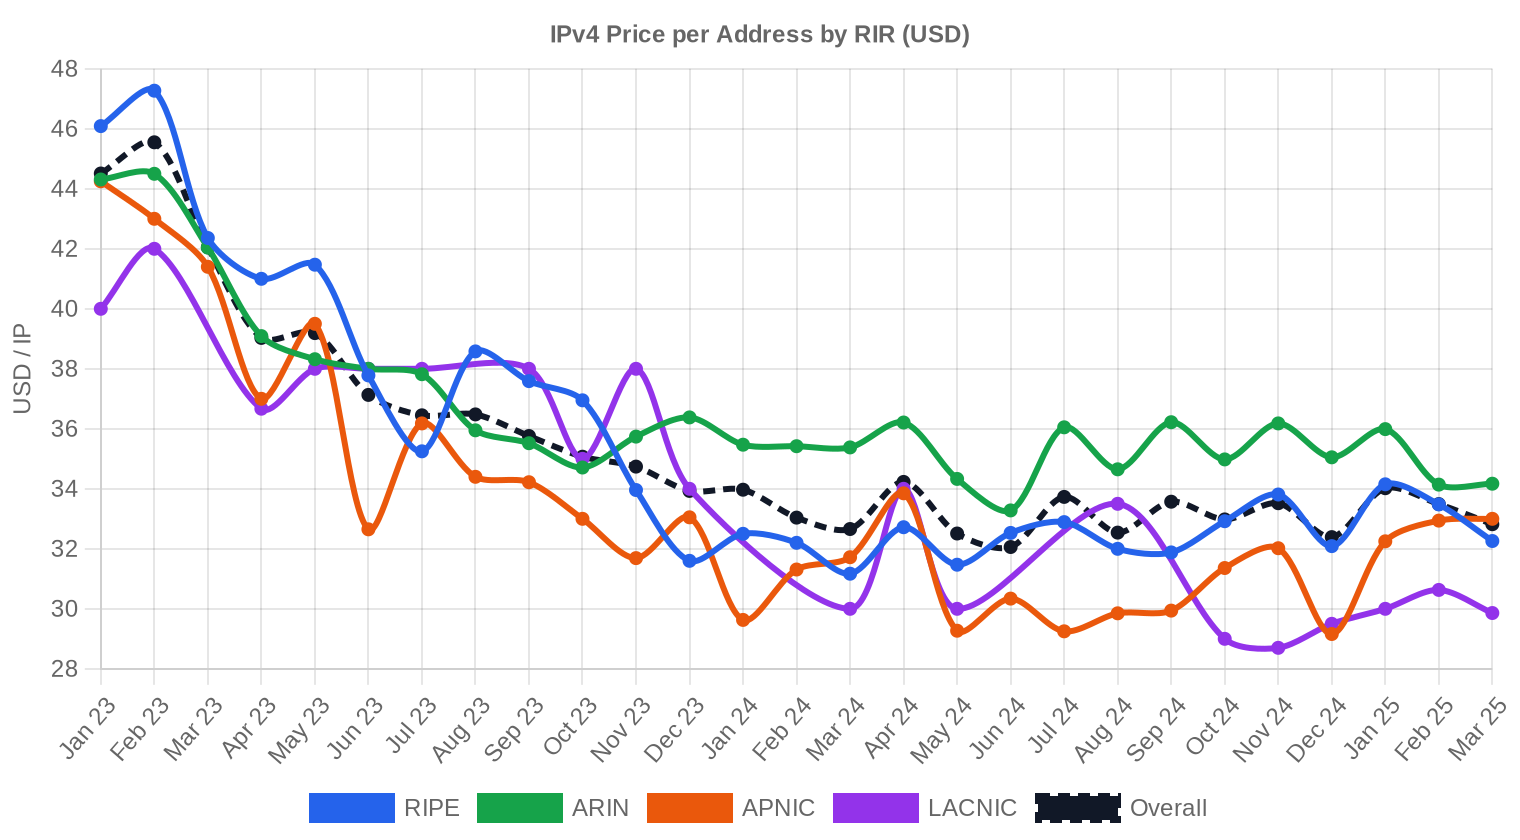
IPv4 addresses first acquired market value in 2011 following IANA free pool exhaustion. Prices climbed steadily from sub-$10/IP through the mid-2010s, reaching a peak above $50/IP in early 2023 for certain RIRs. AWS's decision to charge $0.005/hour for public IPv4 addresses (effective February 2024) marked a turning point, nudging large cloud tenants to reclaim and release unused space. The result has been the bifurcation we see today: ARIN blocks still command mid-$30s pricing while RIPE and APNIC have settled into the low $30s, with the overall market trending lower for three consecutive quarters.| Year | ~Price/IP | Key Event |
|---|---|---|
| 2011 | $7–12 | IANA free pool exhausted; Microsoft/Nortel deal ($11.25/IP) |
| 2012 | $8–12 | RIPE NCC reaches last /8; begins /22-only allocation |
| 2014 | $10–15 | LACNIC free pool exhausted |
| 2015 | $8–15 | ARIN free pool exhausted |
| 2017–18 | $12–18 | Leasing market grows; cloud demand rises |
| 2019 | $18–24 | RIPE NCC exhausts remaining free pool |
| 2021–22 | $50–60+ | Post-pandemic peak; hyperscaler build-outs |
| 2024 | $35–52 | AWS IPv4 charge ($0.005/IP/hr); large block correction |
| 2025–26 | $18–45 | Market bifurcation; /16s below $20 for first time since 2019 |
Market Structure: Who Is Buying & Selling
The buyer side is dominated by cloud infrastructure providers, regional ISPs expanding fixed-wireless and fiber deployments, and enterprises with legacy on-premise infrastructure that can't easily transition to IPv6. On the sell side, we see a mix of corporate divestitures from companies that over-accumulated during the 2015–2020 period, bankruptcy-driven liquidations, and legacy holders — universities, government agencies, early Internet participants — who are monetizing allocations they've held for decades. The 65.6% volume surge this quarter suggests sellers are becoming more motivated, likely in response to the persistent price decline.IPv4 vs. Other Asset Classes
At a 21.4% implied annual yield on leased blocks, IPv4 addresses outperform virtually every conventional asset class. US 10-year Treasuries yield roughly 4.3%. Commercial real estate cap rates sit in the 6–8% range. The S&P 500's long-run annual return is around 10%. The catch, of course, is that IPv4 is an illiquid, depreciating asset in a market with no central exchange and significant transfer friction. Adjusted for those risks, the yield is still compelling — but it requires active management and an understanding that terminal value may trend toward zero on a long enough timeline.| Asset Class | Typical Yield | Liquidity | Primary Risk |
|---|---|---|---|
| IPv4 | 21.4% | Moderate | IPv6 adoption, block quality |
| Commercial Real Estate | 5–8% | Low | Vacancy, rate cycle |
| Investment-Grade Bonds | 4–5% | High | Duration, credit risk |
| S&P 500 | ~1,3% | High | Market volatility |
| Money Market / T-Bills | ~4–5% | High | Rate cycle changes |
IPv6 Adoption & Why IPv4 Remains Essential
Global IPv6 adoption sits around 40–45% of traffic at major content networks, but the enterprise and SMB segments lag badly. Most corporate VPNs, legacy applications, and IoT deployments still depend on IPv4. The coexistence period will extend well into the 2030s, and possibly beyond, because the cost of dual-stack operation is lower than the cost of a full IPv6 migration for most organizations. IPv4 addresses remain a functional necessity, not a speculative artifact.AI & Cloud Infrastructure Demand
AI infrastructure buildout is an emerging demand driver for IPv4 space. Training clusters and inference endpoints need routable addresses for API access, model serving, and inter-datacenter communication. The major AI labs — OpenAI, Anthropic, Google DeepMind — operate through hyperscaler cloud environments that already hold massive IPv4 portfolios, but the second-tier AI companies building their own infrastructure are net buyers in the market. We expect this to become a more visible factor in 2025 as purpose-built AI datacenters come online.What Determines IPv4 Block Value
Not all /24s are created equal. Blacklist status is the single biggest value determinant — a block that appears on Spamhaus or other major blocklists can trade at a 30–50% discount. Allocation age matters less than it used to, but blocks with clean transfer histories and no legacy routing issues still command premiums. RIR affiliation drives pricing directly: an ARIN /24 averages $35.33/IP versus $32.52 for RIPE this quarter, a $717 difference on a single /24 based on registry alone.Sell vs. Lease: A Decision Framework
In a declining-price environment, the calculus favors selling unless you have high-quality tenants locked into multi-year leases. A block sold today at $32.85/IP captures current value; a block leased at $0.59/IP per month needs 56 months to match that return — and if prices fall further during those 56 months, you've lost on both sides. Leasing makes sense for holders who believe prices will stabilize or recover, or who have existing lease contracts generating reliable cash flow above the market rate.| /24 Purchase price | $8,410 |
| /24 Lease price | $150 / mo |
| Payback period | 56.1 mo (4.7 yr) |
| Gross annual yield | 21.4% |
RIPE NCC 24-Month Transfer Restriction
RIPE NCC's 24-month holding requirement before a block can be transferred again acts as a natural supply governor. Blocks acquired in the 2022–2023 price peak are only now becoming eligible for resale, and many of those holders are underwater at current prices. This creates a psychological floor — few sellers want to realize a loss — but also constrains supply rotation, which partially explains why RIPE pricing has held up better than the volume surge might suggest.Deal Size Distribution
Average deal size jumped to $108,165 in Q4, up 48% from $72,941 in Q3 and down 19% from $133,550 in Q4 2023. The distribution is heavily bottom-weighted: 195 deals (76%) were under $50,000, accounting for just $3.4 million of the $27.6 million total. Meanwhile, seven deals above $1 million accounted for $14.0 million — more than half of total market value. This concentration means a small number of large buyers continue to drive the dollar-weighted market, while the /24-and-smaller segment operates almost as a separate market with its own pricing dynamics.Top Trading Countries
Country-level granularity was not captured in our Q4 2024 dataset. Based on RIR distribution, the European Economic Area (via RIPE at 54.9% share) and the United States (via ARIN at 23.9%) remain the dominant trading geographies. APNIC's 42 transactions likely concentrate in India, Australia, and Southeast Asian markets where mobile carrier expansion and datacenter construction drive persistent demand.BEAD Broadband Program Impact
The $42.45 billion BEAD program is beginning to move from grant awards to actual network construction. As rural ISPs and fixed-wireless operators start deploying infrastructure in 2025, they'll need IPv4 space — typically /20s through /18s — to address customer premises equipment. This cohort tends to be price-sensitive and operationally unsophisticated in the transfer market, which creates opportunity for brokers but also potential supply pressure on mid-size blocks that are already the scarcest segment of the market.Hyperscaler IPv4 Holdings
Amazon, Microsoft, and Google collectively control an estimated 100+ million IPv4 addresses — more than many RIRs have in their entire registry. Amazon's public IPv4 charge ($3.60/IP per month in AWS) has been a market-shaping event, prompting customers to release unused Elastic IPs and reducing net demand from the cloud segment. Microsoft's Azure has been quieter but holds similarly massive inventories. Any decision by a hyperscaler to sell or lease excess blocks would move the market materially, though none have signaled that intention.Macroeconomic Conditions & Market Impact
The Fed held rates steady through most of Q4, with markets pricing in cuts for 2025. Higher rates nominally compress IPv4 valuations by raising the discount rate on future lease income, but the practical effect has been minimal — most IPv4 transactions are funded from operating budgets, not leveraged. Enterprise IT spending remains healthy, with Gartner projecting mid-single-digit growth for 2025, which should sustain baseline demand for IPv4 even as the price trend softens.Model Update & Calibration
We reviewed our past projections against actual market outcomes and recalibrated the model for this report. The updated model places more weight on recent price movements using exponential decay, dynamically adjusts prediction bands to reflect current market conditions, and corrects for any systematic bias detected in earlier forecasts. The predicted-vs-actual comparison chart below shows how closely our past estimates tracked reality.
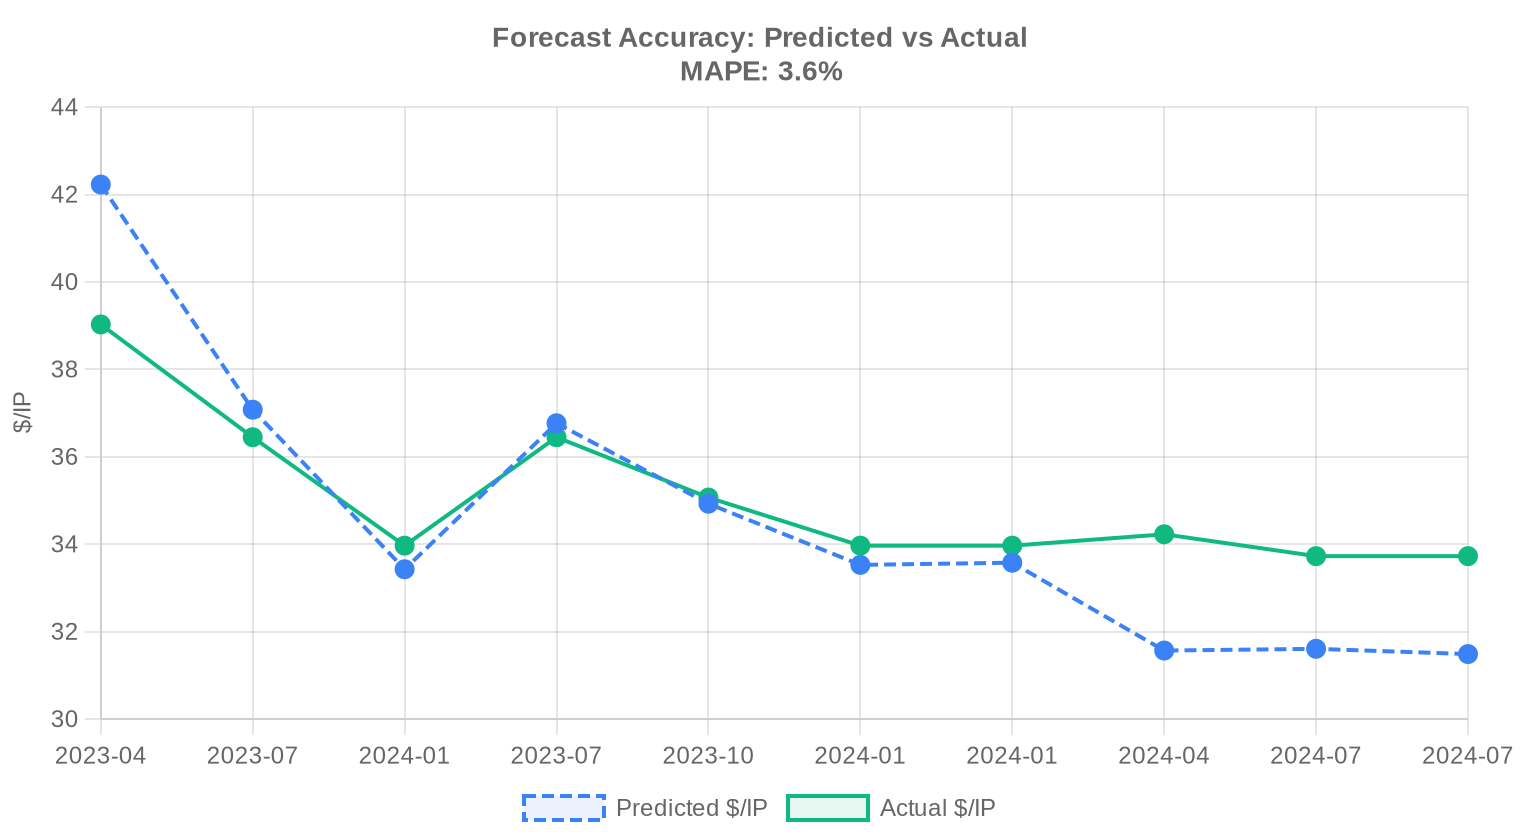
| Report Period | Target Month | Predicted | Actual | Deviation |
|---|---|---|---|---|
| 2023-Q3 | 2023-10 | $35 | $35 | 0% |
| 2023-H2 | 2024-01 | $34 | $34 | -1% |
| 2023-Q4 | 2024-01 | $34 | $34 | -1% |
| 2024-Q1 | 2024-04 | $32 | $34 | -8% |
| 2024-H1 | 2024-07 | $32 | $34 | -6% |
| 2024-Q2 | 2024-07 | $31 | $34 | -7% |
Methodology
Figures are based on completed IPv4Center marketplace transactions and RIR transfer statistics. Prices are in US dollars per IP address. Forecasts are produced by an AI model that analyses each block-size band and RIR segment separately (with outlier-trimmed medians) alongside known market catalysts; they are estimates, not guarantees.
Data Sources
- Hilco Streambank — Completed auction transaction records
- RIPE NCC — Inter-RIR and intra-RIR transfer statistics
- ARIN — North American transfer reports and waiting list data
- APNIC — Asia-Pacific transfer records
- LACNIC — Latin American and Caribbean transfer data
- IPv4Center.com — Proprietary marketplace transaction and lease pricing data
This report is generated automatically for informational purposes only and does not constitute financial advice.
Frequently Asked Questions
What was the average price per IPv4 address in Q4 2024?
The global weighted average landed at .85 per address, with the median at . Prices ranged from a floor of to a ceiling of depending on RIR, block size, and deal terms.
How many IPv4 transfer transactions closed in Q4 2024?
We tracked 255 priced transactions encompassing roughly 837,888 addresses for an aggregate market value of .6 million. An additional 3,103 registry-recorded transfers occurred across all RIRs, many of which were intra-organizational or undisclosed on price.
Why is ARIN space trading at a .80 premium over RIPE in Q4 2024?
ARIN blocks averaged .33 versus .52 for RIPE — a roughly 8.6% premium. North American addresses carry higher perceived routing reliability and demand from U.S.-based hyperscalers and hosting providers. The tighter ARIN free pool also supports a scarcity premium.
Which RIR region dominated transaction volume this quarter?
RIPE accounted for 54.9% of priced transactions (140 out of 255) and 60.7% of total addresses traded (508,672 IPs). ARIN was a distant second at 61 transactions, followed by APNIC at 42 and LACNIC at 12. AFRINIC recorded zero priced deals.
What does the /24 market look like specifically — aren't those the most liquid blocks?
Correct. The /24 (256 addresses) was the most traded prefix size with 89 transactions, roughly 35% of all deals. At the global average of .85, a /24 costs approximately ,410 — still the market's benchmark unit, much like the Treasury bill is to fixed income.
Is the market trending up or down heading into 2025?
Up. Prices rose approximately 2.63% over the quarter, and our forecast model — which we consider reliable for this dataset — projects a December 2024 exit rate of .84 and a near-term January figure around .75. Modest appreciation, not a spike, but the direction is unambiguous.
What were the cheapest IPv4 addresses available in Q4 2024, and where?
The global floor was per IP, observed in the ARIN region — likely a large legacy block with clean title but limited routing history. LACNIC was close behind at .50 and APNIC at . Buyers willing to take non-traditional RIR regions can still find relative value.
How does APNIC pricing compare to RIPE and ARIN this quarter?
APNIC averaged .43 per IP — the lowest among the three major regions — with a tight range of –. The median was , identical to RIPE's. For buyers who can use Asia-Pacific space, APNIC offers a modest discount without meaningful routing disadvantage in most use cases.
Should I buy or lease IPv4 addresses at current Q4 2024 rates?
Buy. At current lease rates of .59/IP/month versus a purchase price of .85, the breakeven is approximately 56 months — or 4.7 years. If your planning horizon exceeds five years, purchasing is the rational choice. The implied annual yield for a lessor is 21.4%, which tells you who's capturing the surplus in a lease arrangement.
What is the current monthly lease rate for a /24 block?
Approximately 0 per month for a /24, based on a sample of 44 lease transactions, predominantly in the RIPE region. That annualizes to about ,800 — versus an outright purchase at roughly ,410. The math favors buying for any hold period beyond ~4.7 years.
What mistakes should buyers avoid in the current IPv4 market?
Three common errors: overpaying for small ARIN blocks when equivalent RIPE or APNIC space is –3 cheaper per IP; signing multi-year leases when the breakeven favors buying at 56 months; and neglecting due diligence on block reputation and blacklist status, which can render a bargain-priced block effectively unusable.
What are the risks of buying IPv4 addresses at the current .85 average?
The principal risk is long-tail IPv6 adoption eventually eroding resale value, though that timeline keeps extending. Nearer-term risks include regulatory changes at specific RIRs that could complicate transfers, and the concentration risk that 7 deals above M represented over half (M) of total market value — suggesting the market is thinner than headline numbers imply.
How concentrated is the Q4 2024 market by deal size?
Highly. Seven transactions exceeding million each accounted for .0 million — roughly 50.7% of total market value. Meanwhile, 195 deals under K represented just .4 million, or 12.5% of value. This is a barbell market: lots of small retail trades and a handful of institutional-sized blocks driving the dollar volume.
Why did AFRINIC record zero transactions again in Q4 2024?
AFRINIC's ongoing governance crisis and the effective freeze on inter-RIR transfers continue to render that region's address space illiquid. Until organizational stability is restored and transfer policies are normalized, AFRINIC blocks are essentially stranded assets from a secondary-market perspective.
What's happening with LACNIC — only 12 deals seems very thin?
LACNIC averaged .96 per IP across just 12 transactions totaling 18,176 addresses — the thinnest of the active regions by a wide margin. Pricing was compressed (.50– range), and the region continues to suffer from limited broker infrastructure and transfer-process friction. Bargain hunters take note, but liquidity risk is real.
How many total registry transfers were recorded, beyond just priced deals?
A total of 3,103 transfers were logged across RIR databases in Q4 2024. RIPE dominated with 1,893 (61.0%) and ARIN contributed 1,210 (39.0%). APNIC, LACNIC, and AFRINIC recorded zero formal transfers this period. The gap between 3,103 registry transfers and 255 priced deals underscores how much of the market remains opaque.
Is IPv6 adoption finally going to kill the IPv4 market?
Not this quarter, and not next quarter either. IPv6 deployment continues to advance — Google reports north of 45% of its traffic over IPv6 — but the enterprise installed base, legacy IoT, and carrier-grade NAT dependencies ensure IPv4 demand persists. Prices rose 2.63% in Q4 2024. The obituary remains premature.
What's the typical deal size in Q4 2024?
The average deal involved approximately 3,286 addresses (roughly a /14 equivalent) at an average transaction value of 8,165. However, the median tells a different story — the /24 was the single most traded prefix, meaning most deals are far smaller than the average suggests. A few whale trades pull the mean up considerably.
What are the risks of leasing IPv4 instead of buying at current rates?
At .59/IP/month, a lessee is effectively paying a 21.4% annual yield to the lessor. Over a standard three-year cloud deployment, you'll have spent .09 per IP with nothing to show for it — versus owning an asset at .85 that retains resale value. Leasing makes sense only for short-duration projects under roughly 4.7 years or where capital allocation constraints prevent outright purchase.
What price should I expect to pay for a /22 (1,024 IPs) in the RIPE region?
At RIPE's Q4 2024 median of per IP, budget approximately ,768 for a /22. The observed range was .75–.00 per IP, so in practice expect ,416 to ,960 depending on block cleanliness, geographic sub-allocation, and whether the seller is motivated.
What drove the 2.63% price increase in Q4 2024?
A combination of steady enterprise demand, continued cloud infrastructure buildout, and constrained supply — the ARIN and RIPE free pools have been effectively exhausted for years. No new supply enters the system; every transaction is secondary-market. Modest demand growth against fixed supply yields predictable, grind-higher pricing.
How long does a typical IPv4 transfer take to complete?
RIR processing times vary. RIPE inter-RIR transfers typically close in 2–4 weeks. ARIN transfers can take 4–8 weeks depending on the need verification process and whether legacy blocks require updated RSA agreements. APNIC is generally 3–5 weeks. Budget two months end-to-end including due diligence and escrow.
Should sellers hold IPv4 inventory hoping for higher prices in 2025?
Our forecast suggests prices will hover near .75–.85 into early 2025 — appreciation, but not dramatic. Holding costs are negligible (annual RIR fees), so there's no carry penalty. But the market is also not exhibiting the kind of scarcity-driven acceleration that would justify speculative hoarding. If you have a buyer at +, take the liquidity.
What mistakes do first-time IPv4 sellers commonly make?
Underpricing legacy ARIN blocks that command a + average this quarter, failing to clean up WHOIS and abuse-contact records before listing, and accepting non-escrow payment terms. Also: not shopping the block to multiple brokers. The bid-ask spread in this market can be –5 per IP — that's ,000+ on a single /24.
What does the maximum price in Q4 2024 tell us about the top of the market?
The /IP ceiling was observed in the ARIN region and likely reflects a small, clean, well-routed block sold to a buyer with urgent need — possibly a /24 with pristine reputation. The 37% premium over the global average underscores that block quality, size, and urgency can move pricing dramatically. Not every address is created equal.