15 min read
This report analyzes the IPv4 transfer market for Q3 2024, based on completed IPv4Center marketplace transactions and official RIR transfer records.
Executive Summary
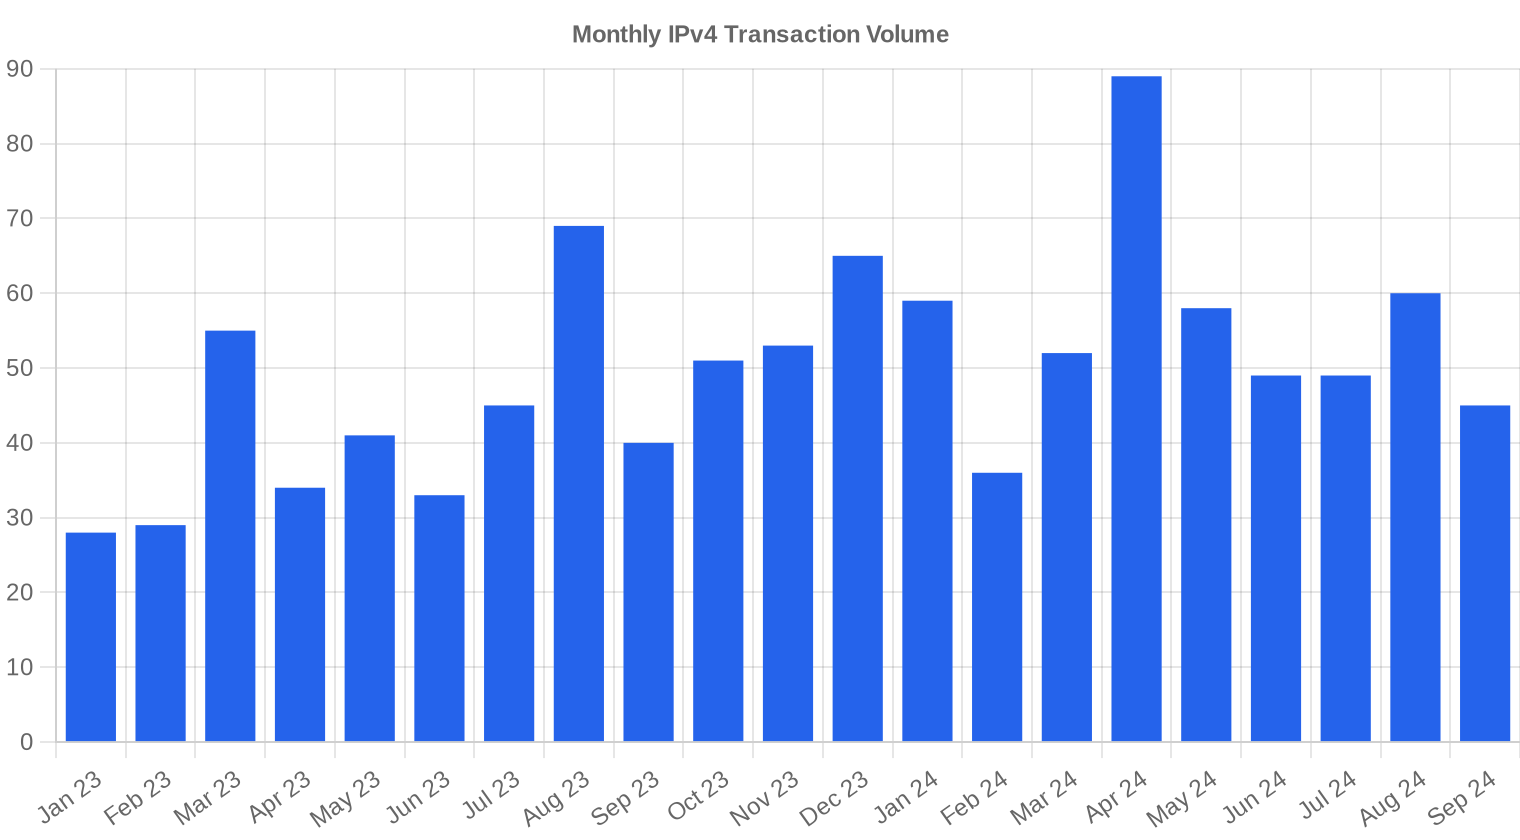
The IPv4 transfer market posted a flat quarter on price and a sharp pullback in deal count. Average pricing came in at $33.22/IP across 154 transactions totaling 338,944 addresses and $11.2 million in aggregate value — essentially unchanged from Q2 2024 (up just $0.10/IP, or 0.26%). But volume tells a different story: transaction count dropped 21.4% from the prior quarter, suggesting buyer hesitation despite stable pricing. Year-over-year, the average is down 8.5% from Q3 2023, continuing the post-peak repricing that began in late 2023. The median held at $32.50, with a $26–$44 range that reflects widening regional dispersion rather than any single anomaly.Market Overview
| Transactions | 154 |
| IP Addresses Traded | 338,944 |
| Estimated Market Value | $11,232,892 |
| Average Price / IP | $33.22 |
| Median Price / IP | $32.50 |
| RIR Transfers | 2,279 |
Year-over-Year Comparison
| Metric | This period | A year earlier (Q3 2023) | Change |
|---|---|---|---|
| Transactions | 154 | 154 | +0.0% |
| IP Addresses Traded | 338,944 | 293,888 | +15.3% |
| Estimated Market Value | $11,232,892 | $11,008,701 | +2.0% |
| Average Price / IP | $33.22 | $36.29 | -8.5% |
| RIR Transfers | 2,279 | 1,903 | +19.8% |
Price Dynamics
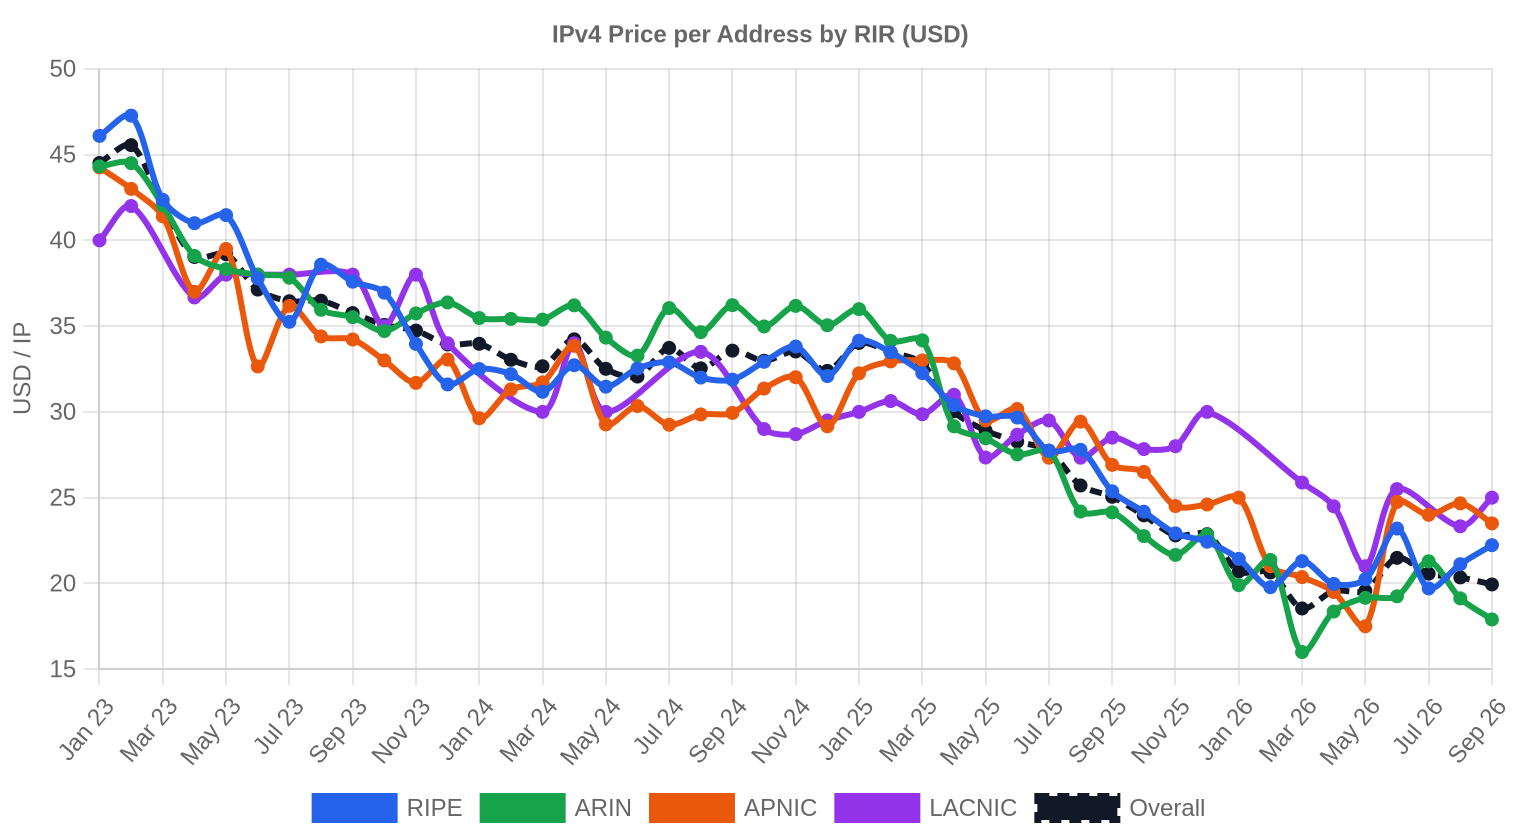
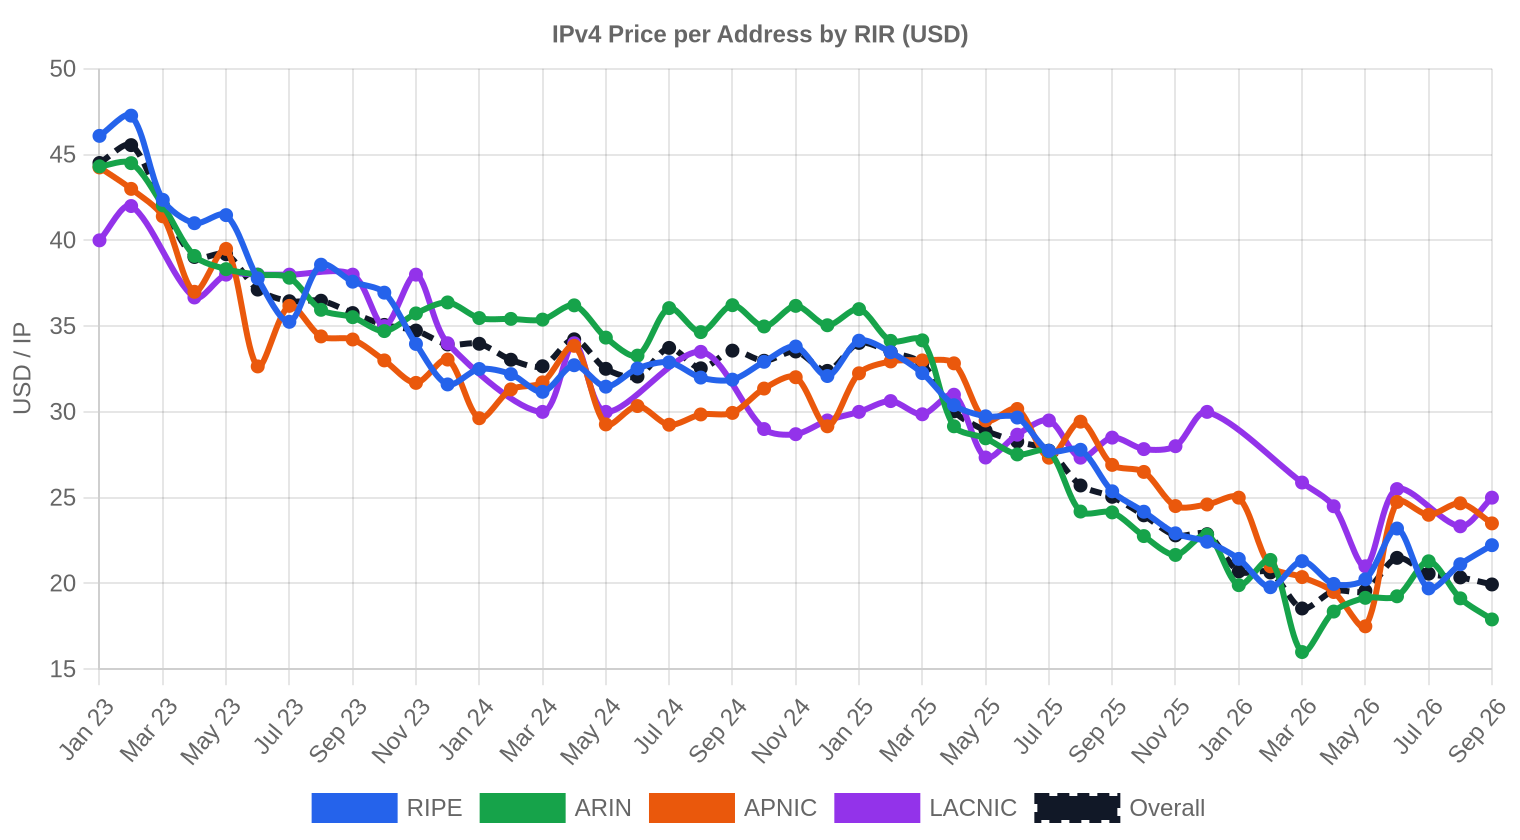
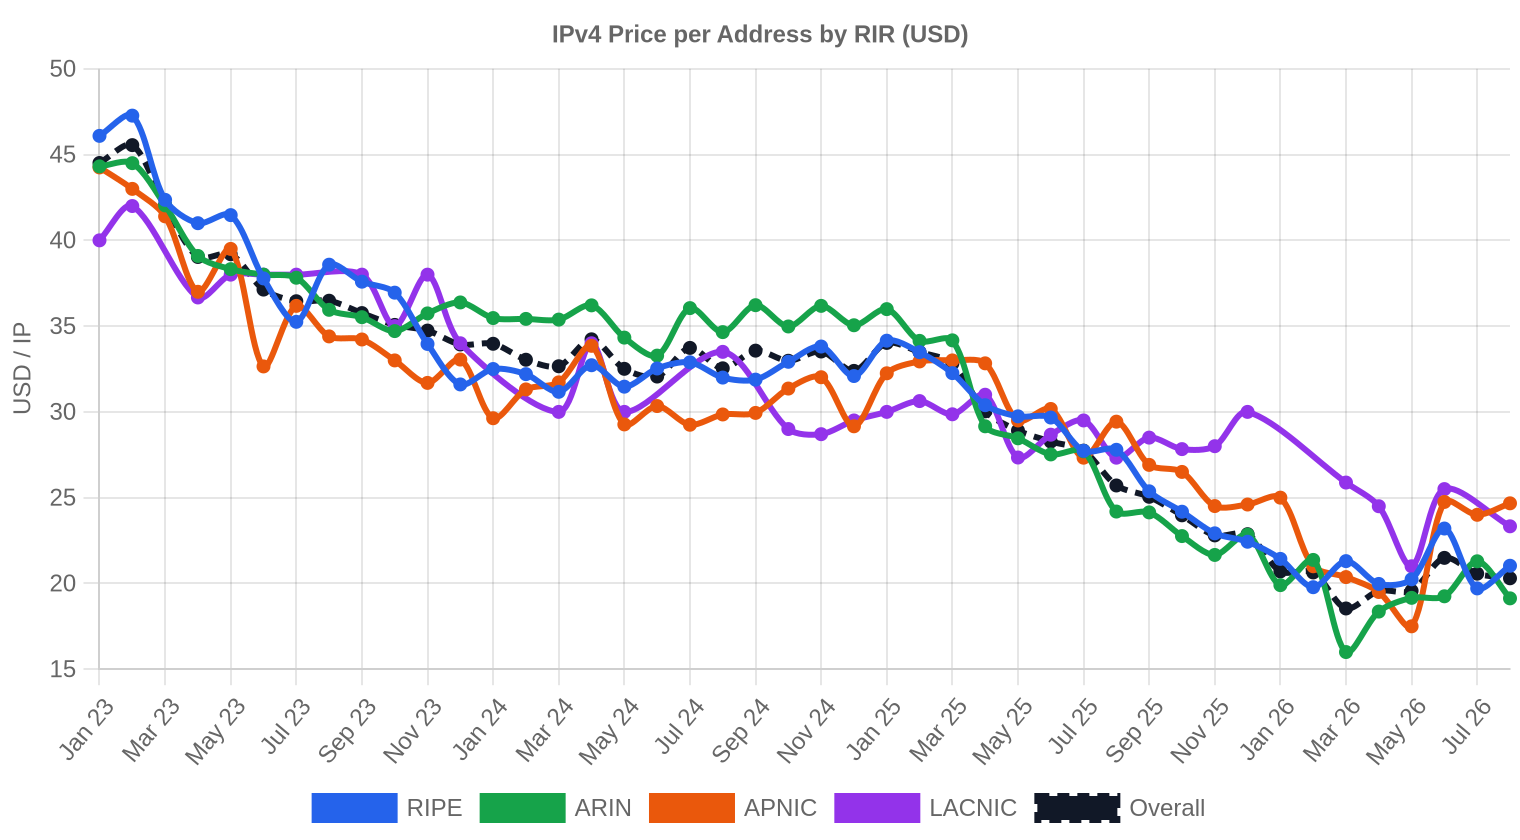
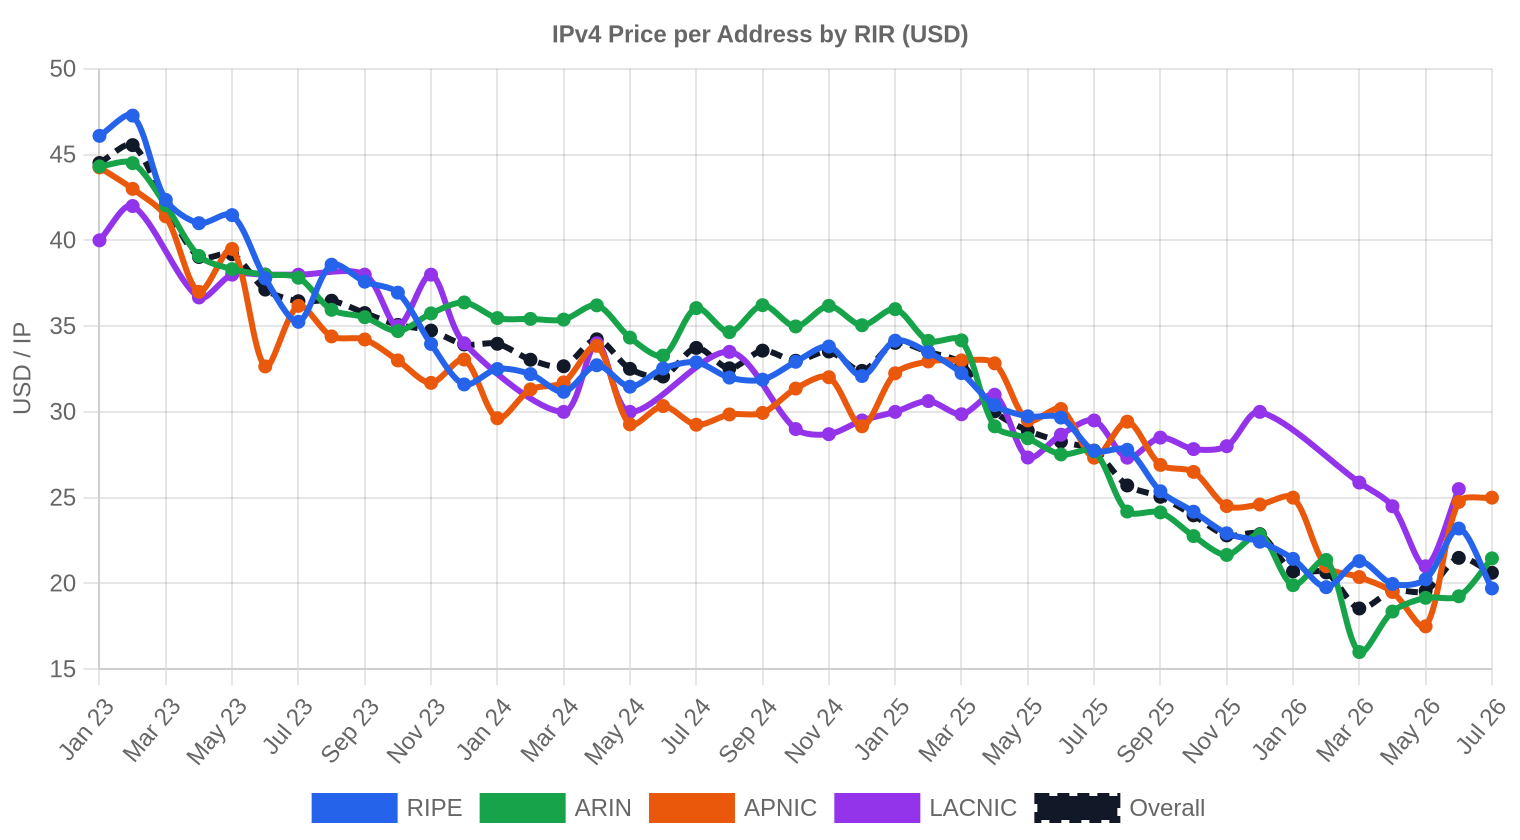
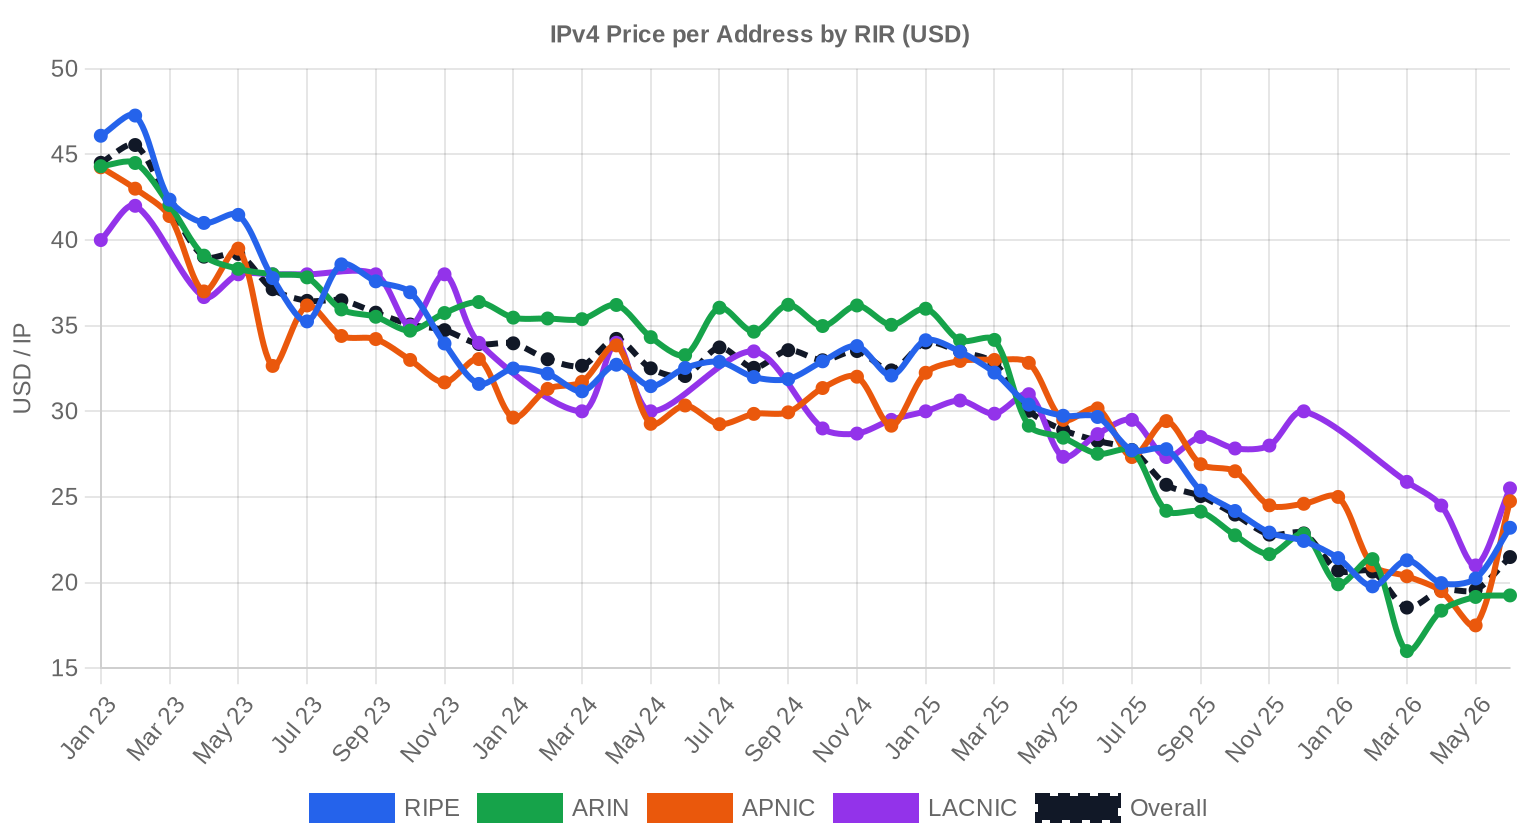
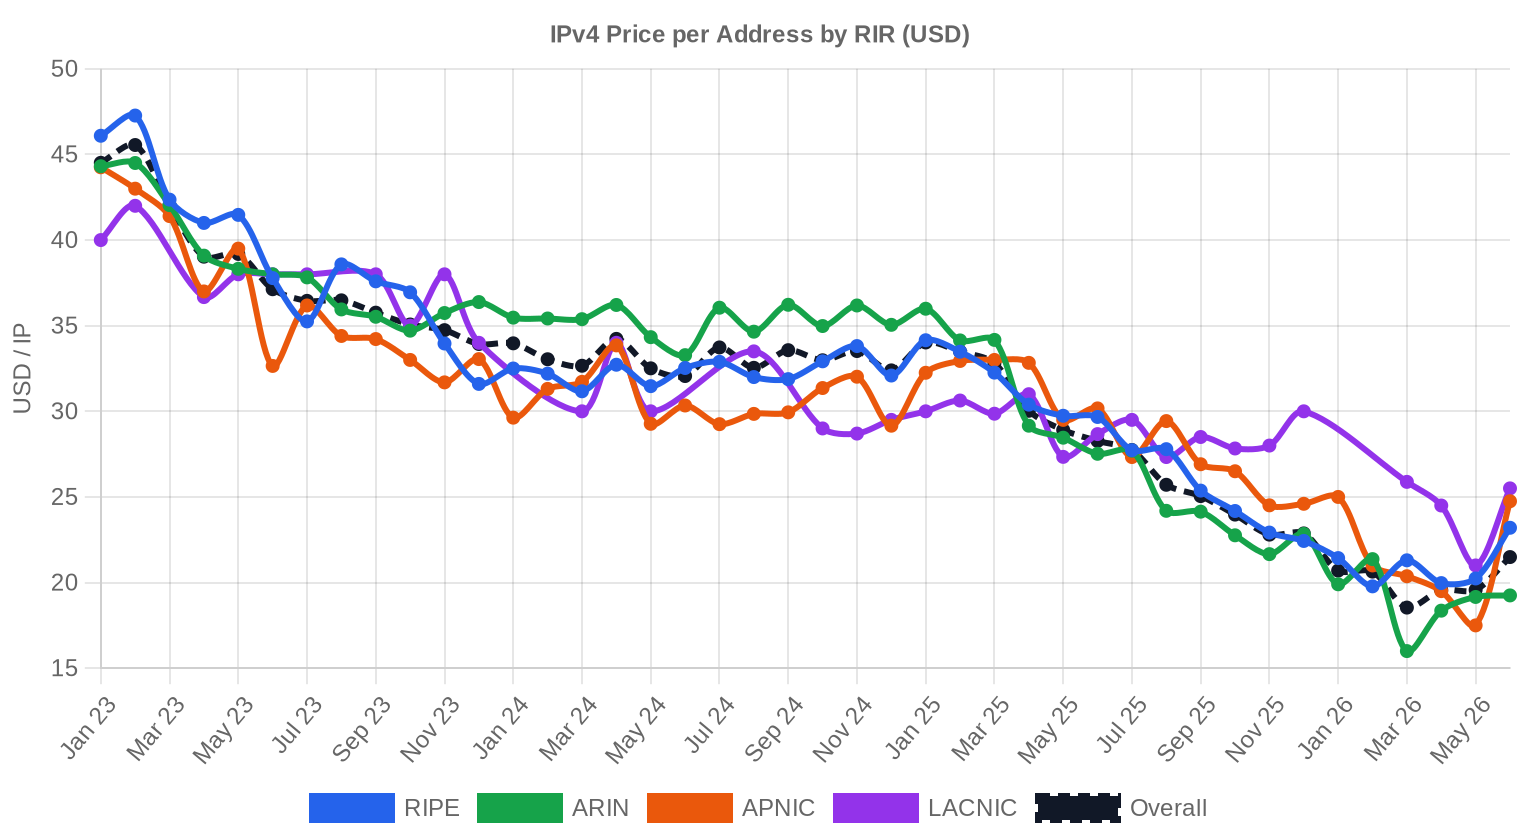
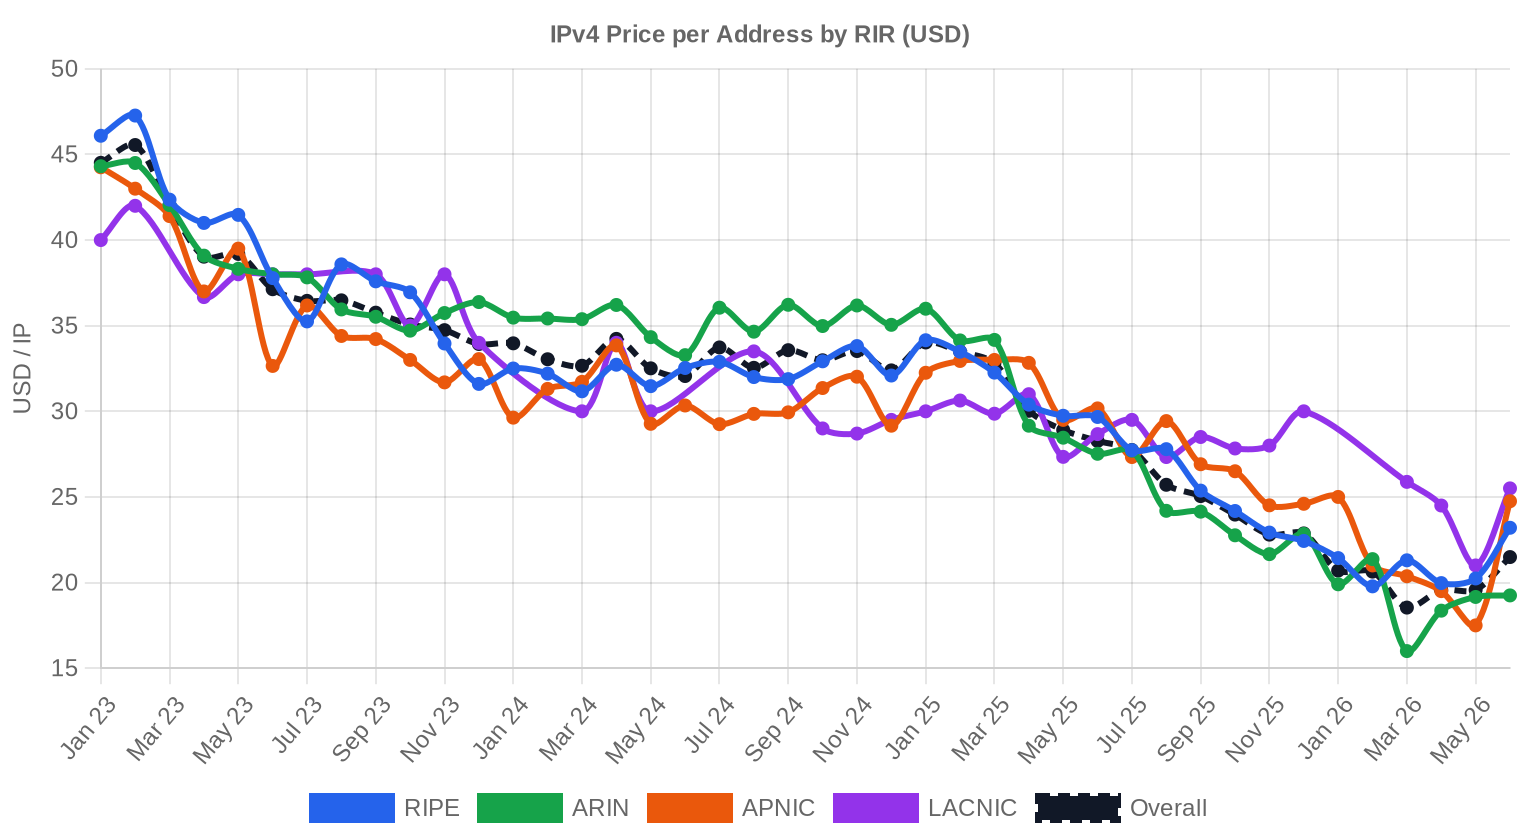
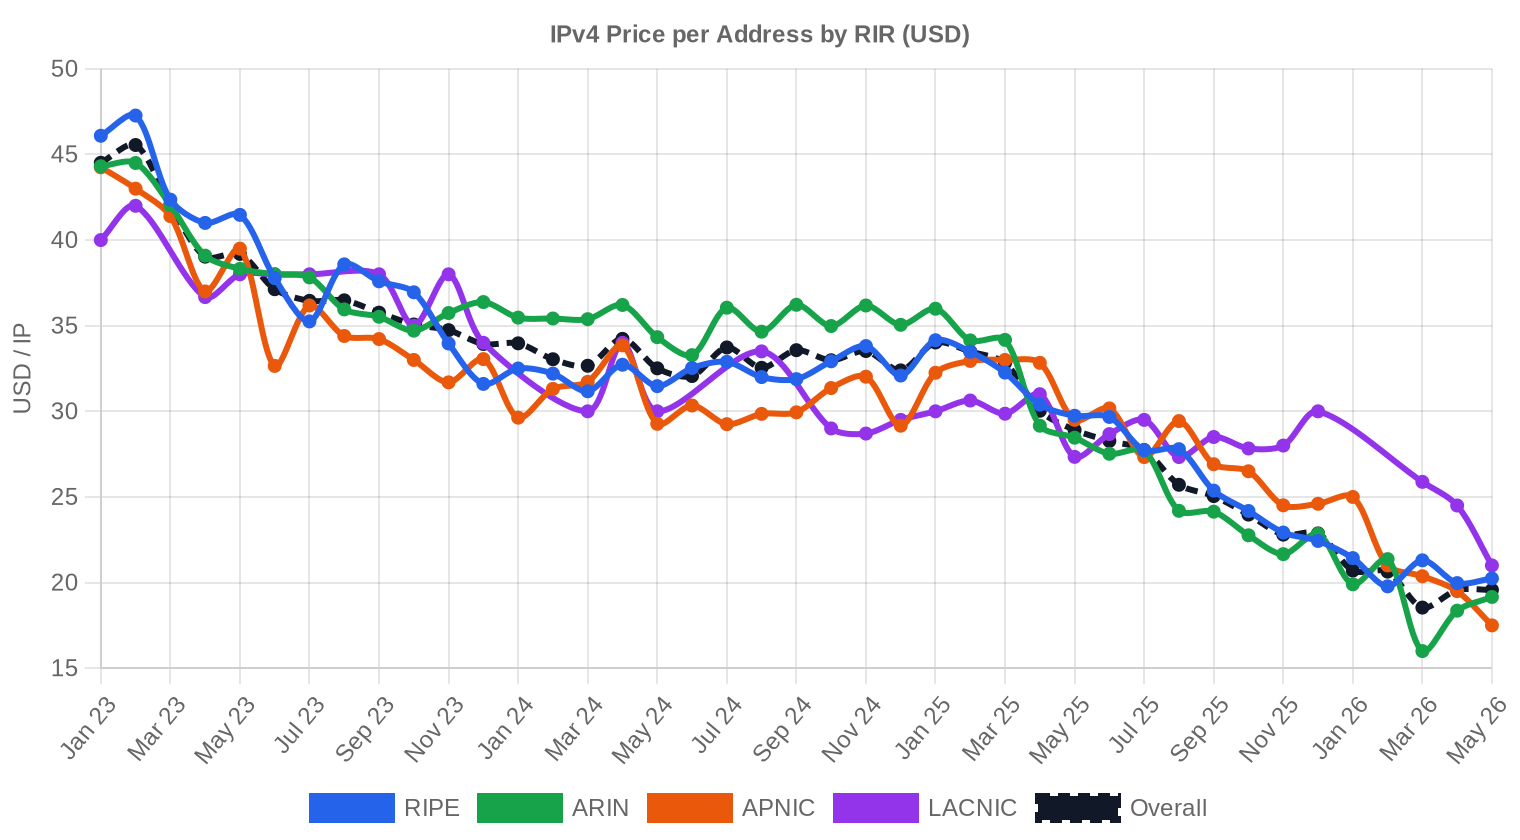
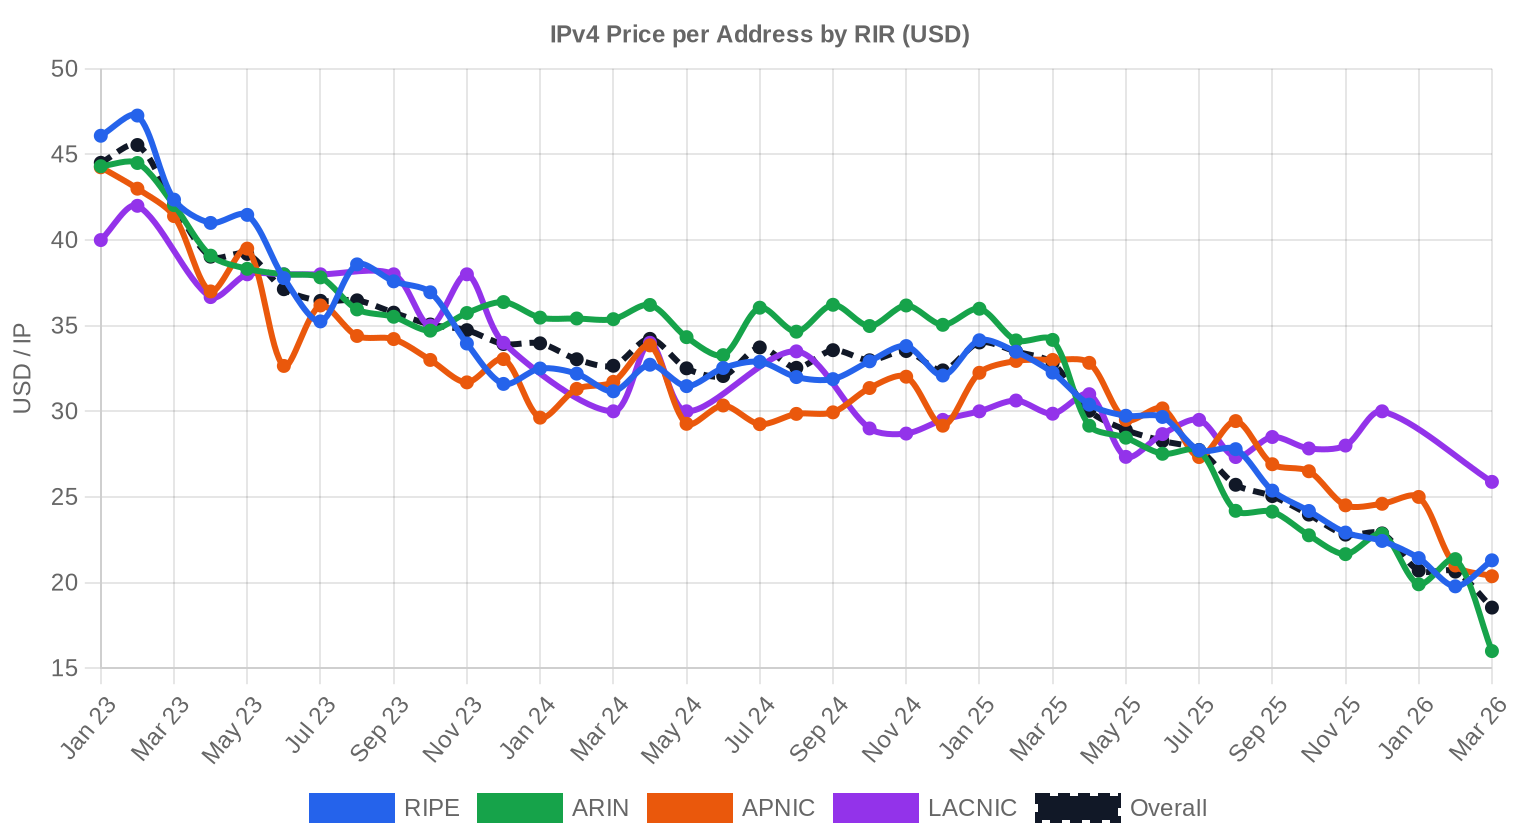
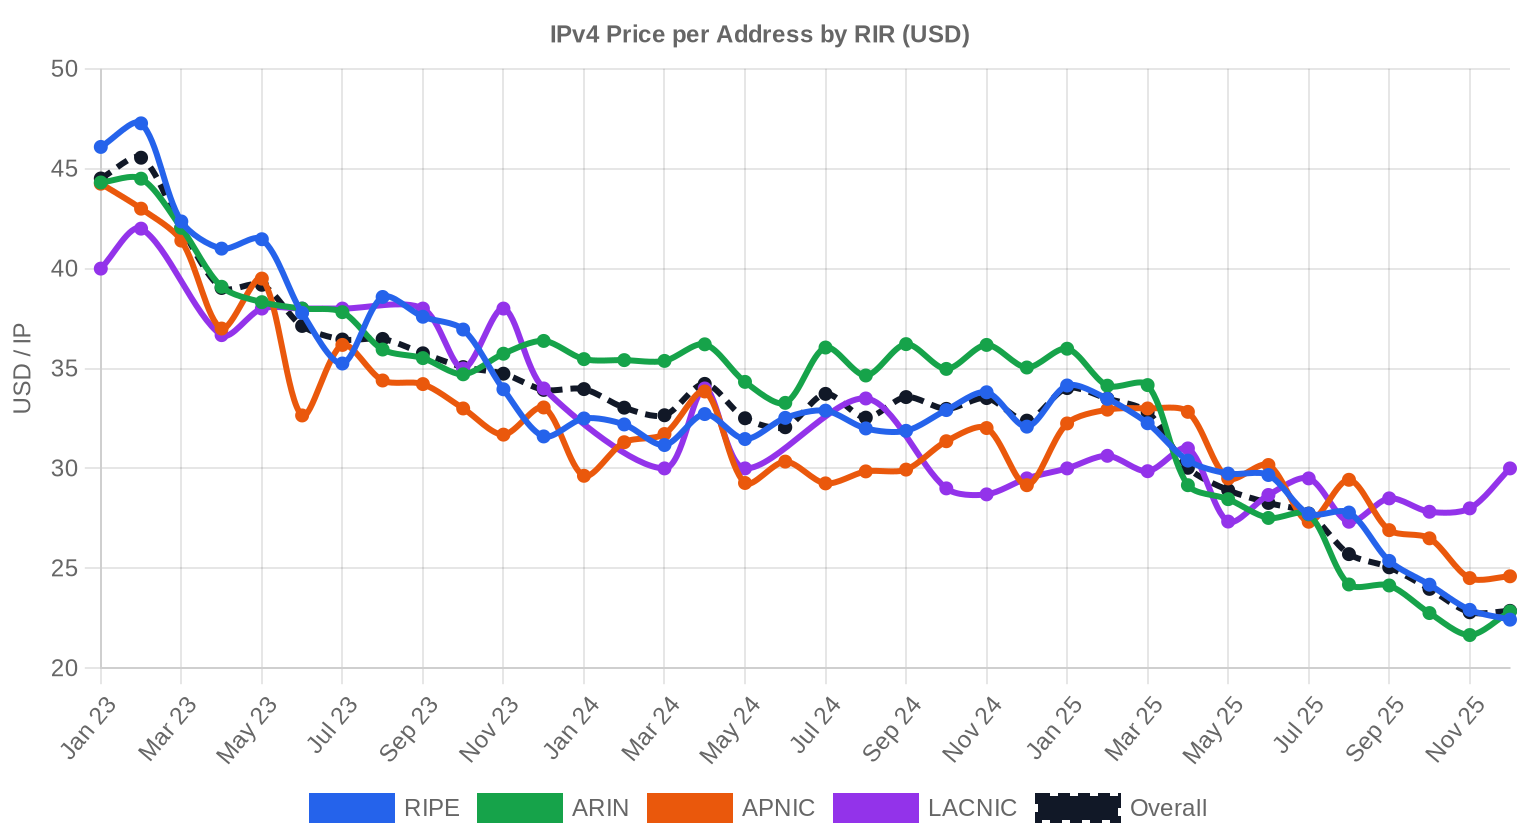
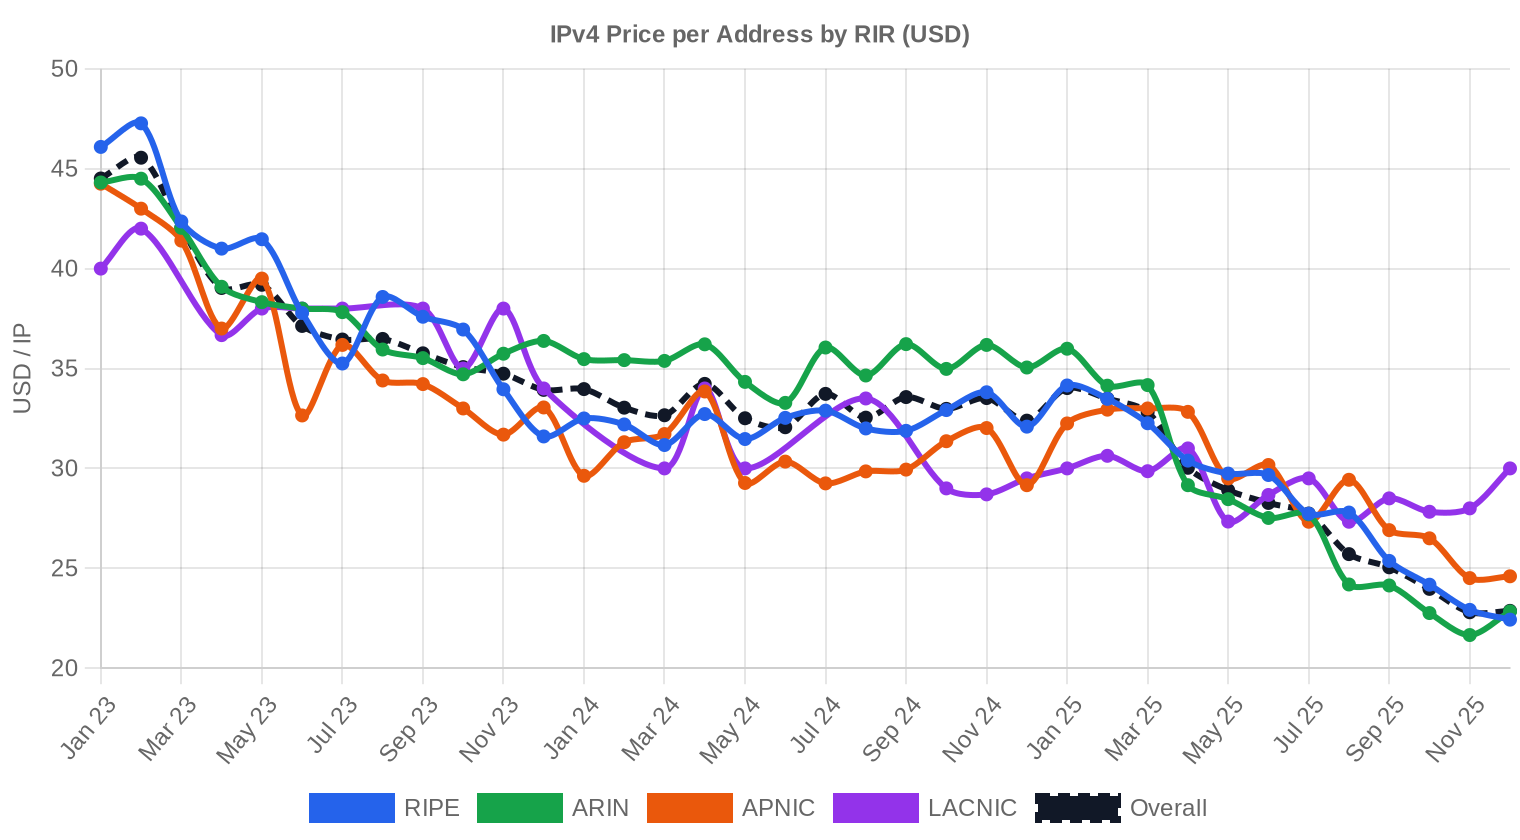
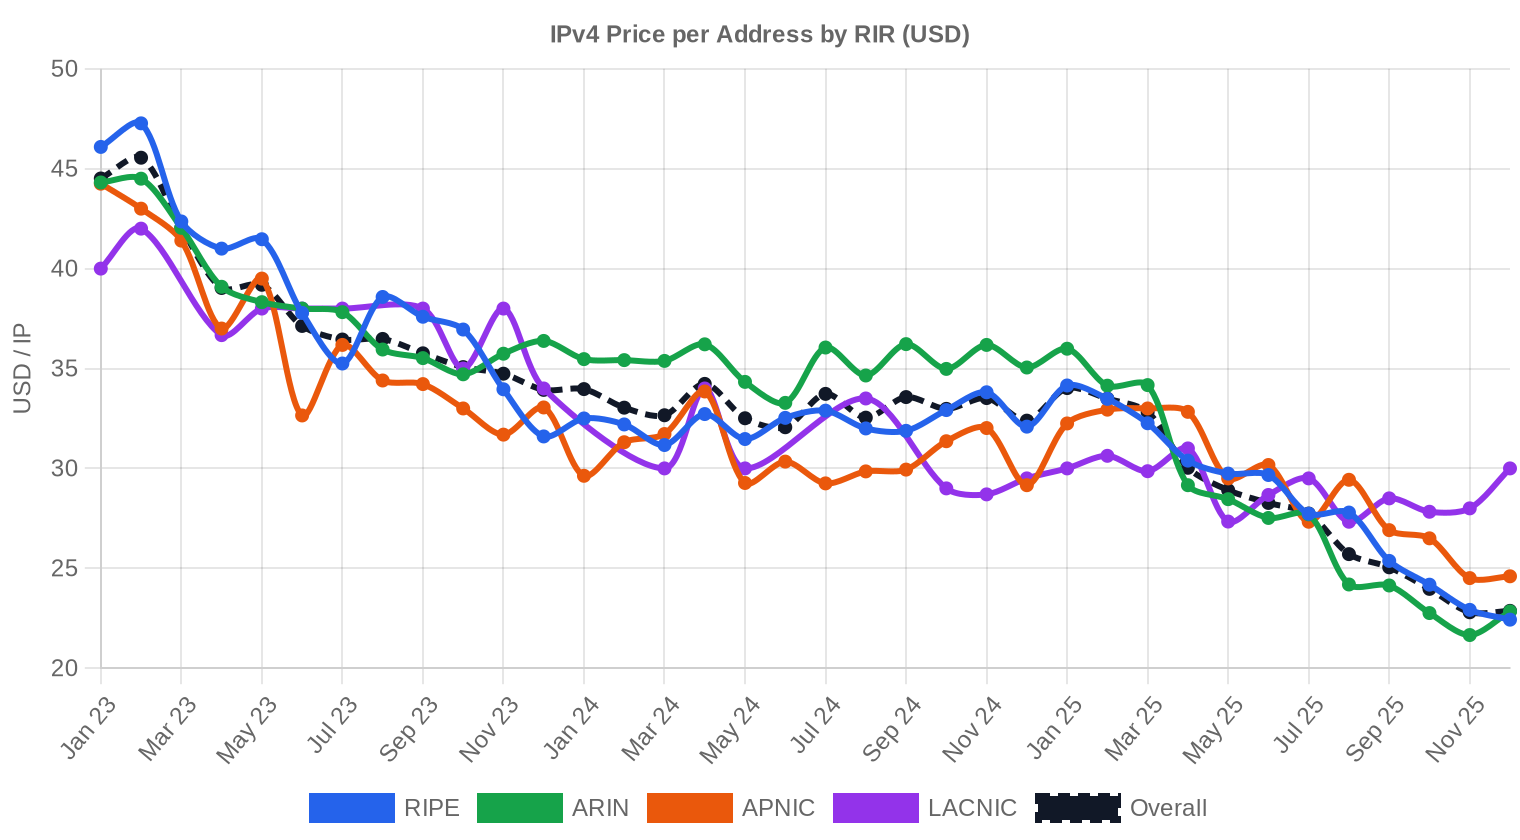
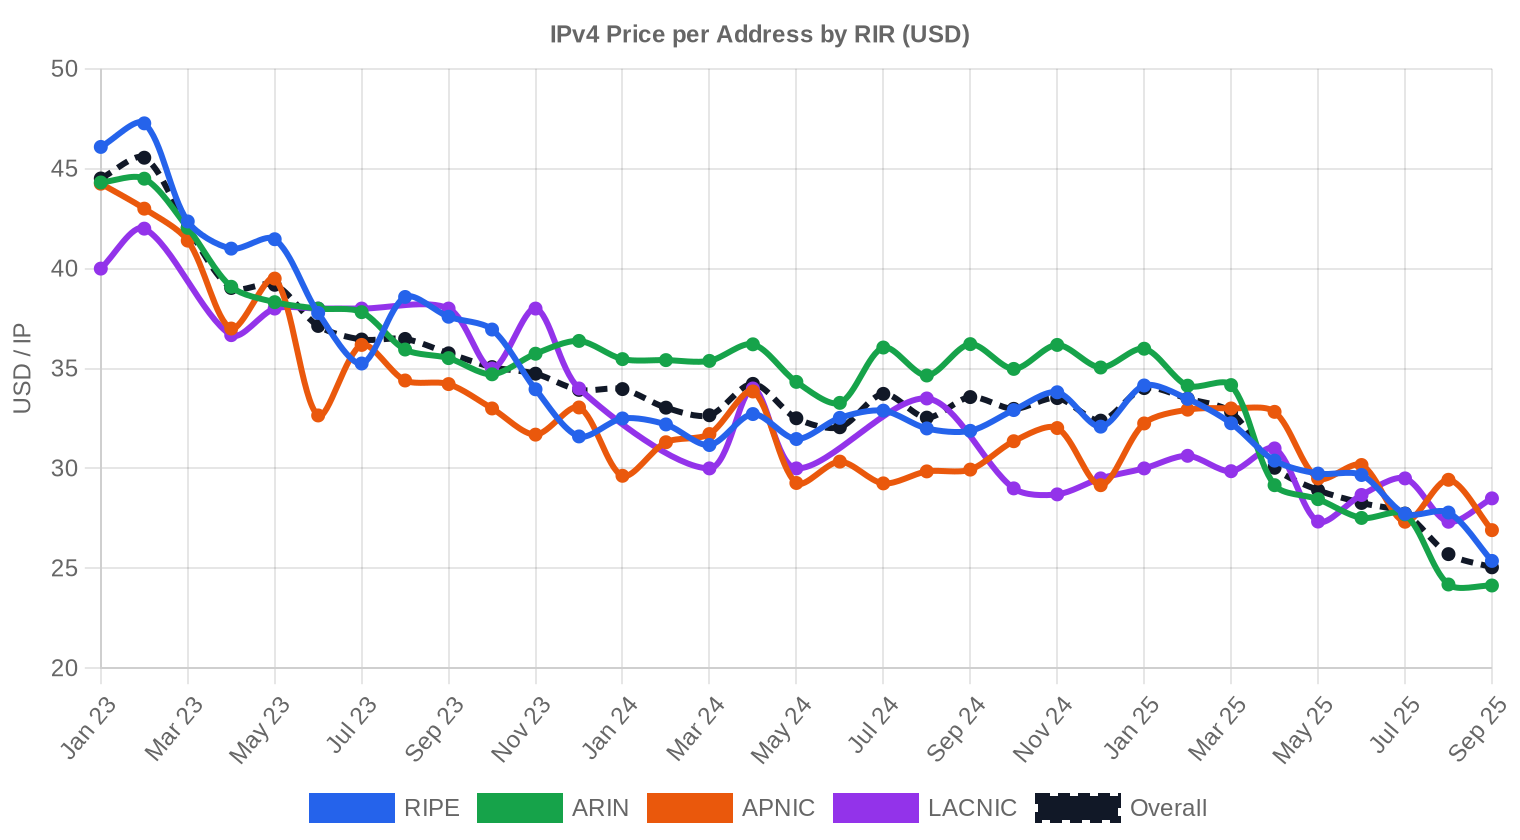
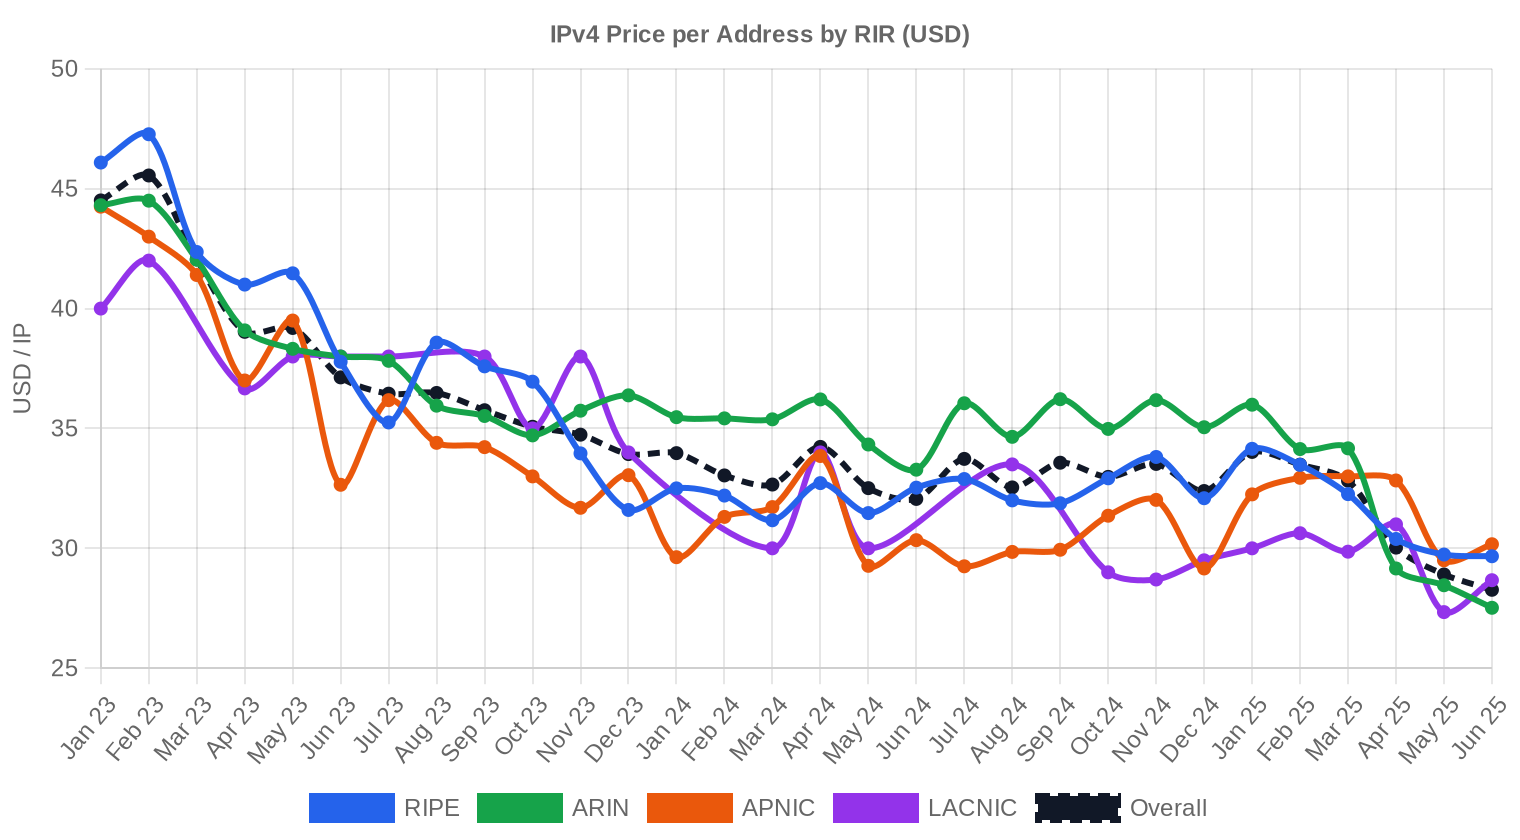
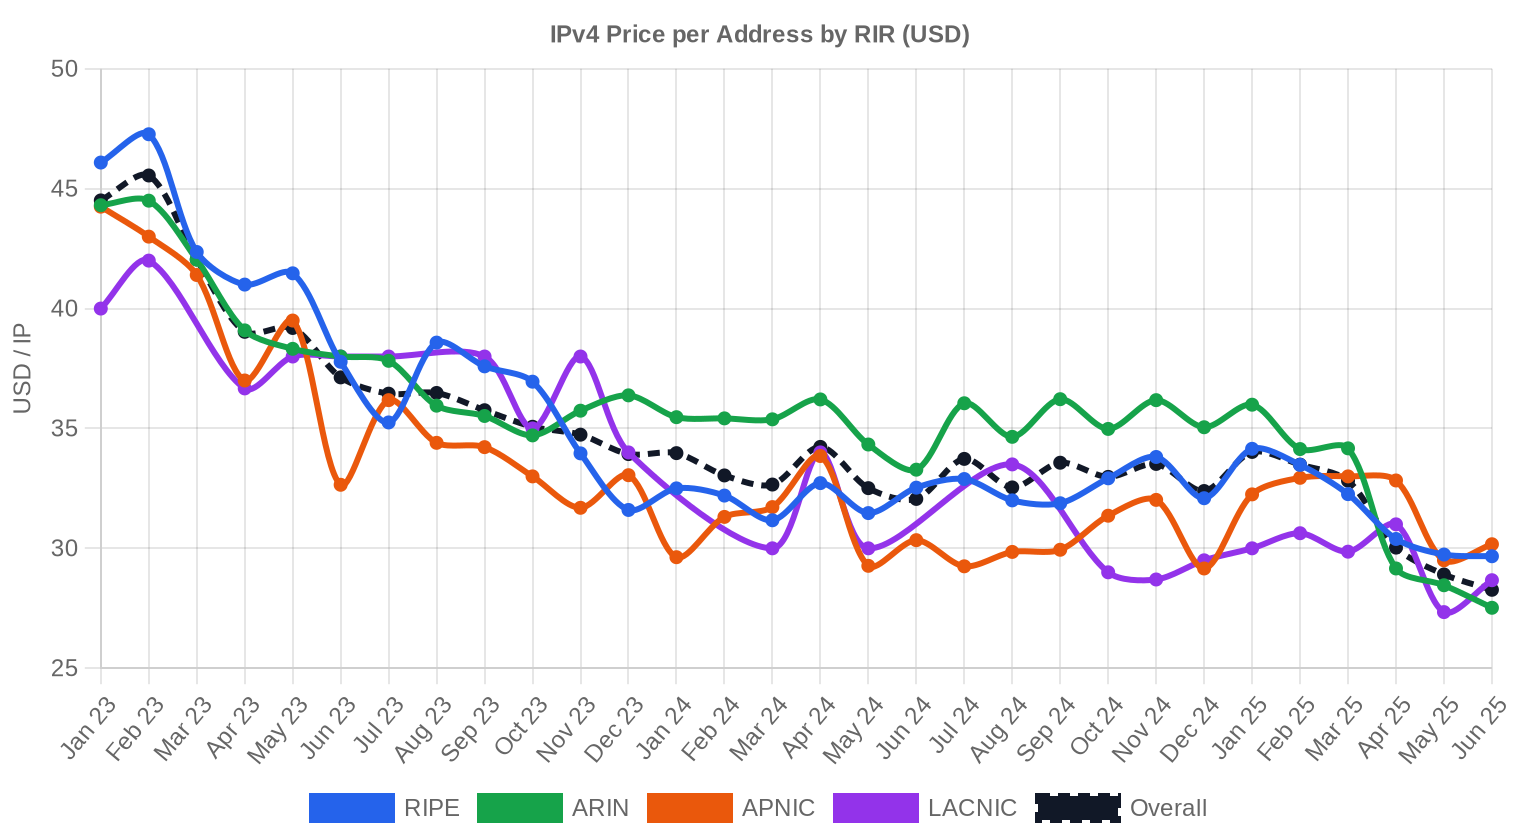
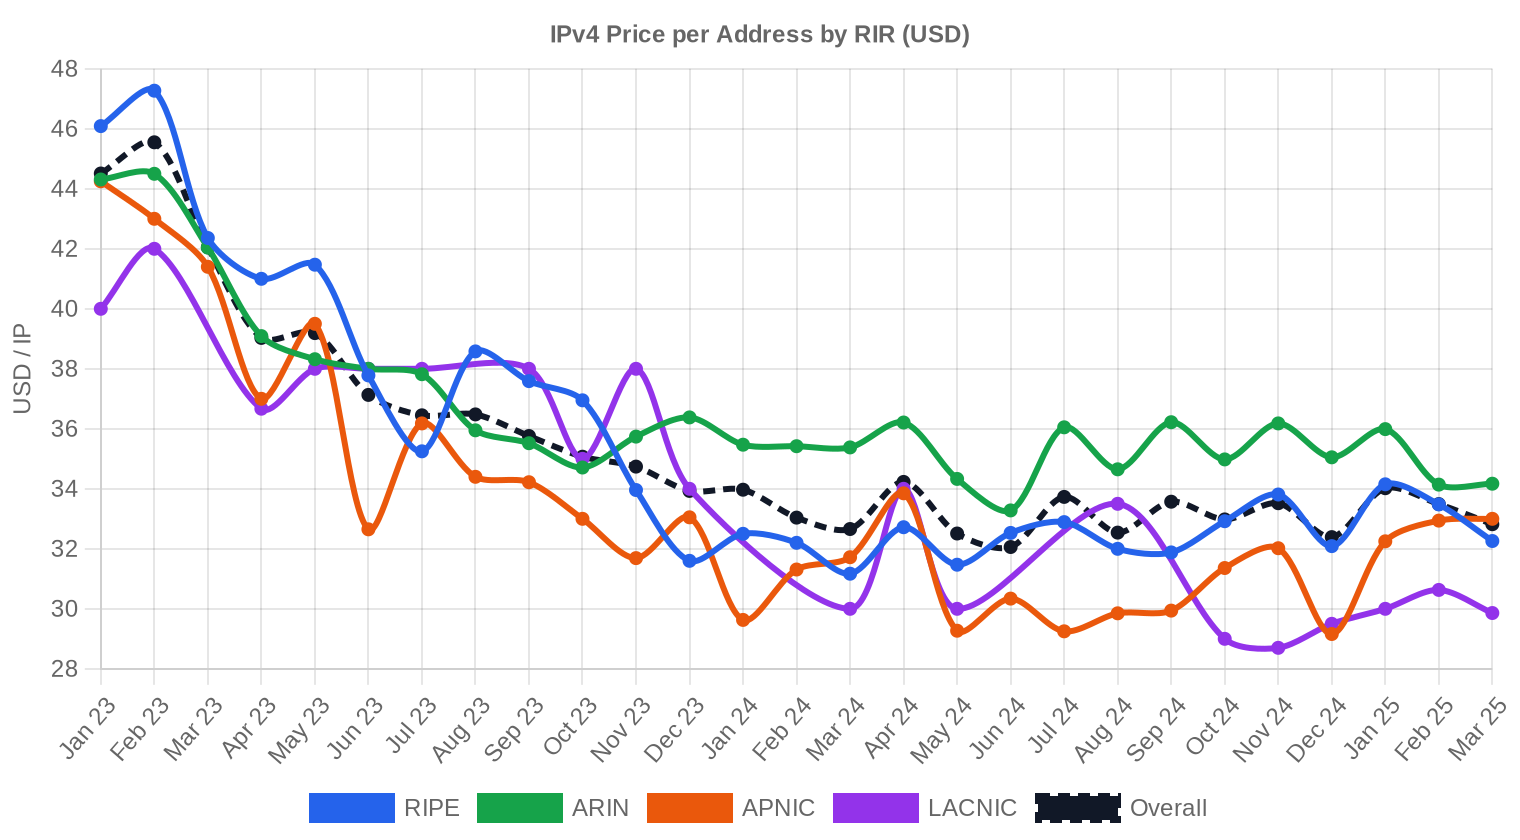
The $18 spread between the floor ($26/IP) and ceiling ($44/IP) this quarter is almost entirely a function of RIR and block size. ARIN blocks commanded the top of the range at $44, while APNIC addresses traded as low as $26 — a $5.91/IP gap between average RIR prices that would have been unthinkable two years ago. The regression trend is mildly positive at +0.26%, but that's noise against an 8.5% year-over-year decline. What's changed from Q2 is not the price level but the conviction behind it: fewer buyers are stepping up, and those who do are getting more selective on quality, cleanliness, and registry. The bid-ask spread appears to be narrowing on small blocks while widening on /16s and larger, where three deals above $1 million accounted for nearly half the quarter's total value.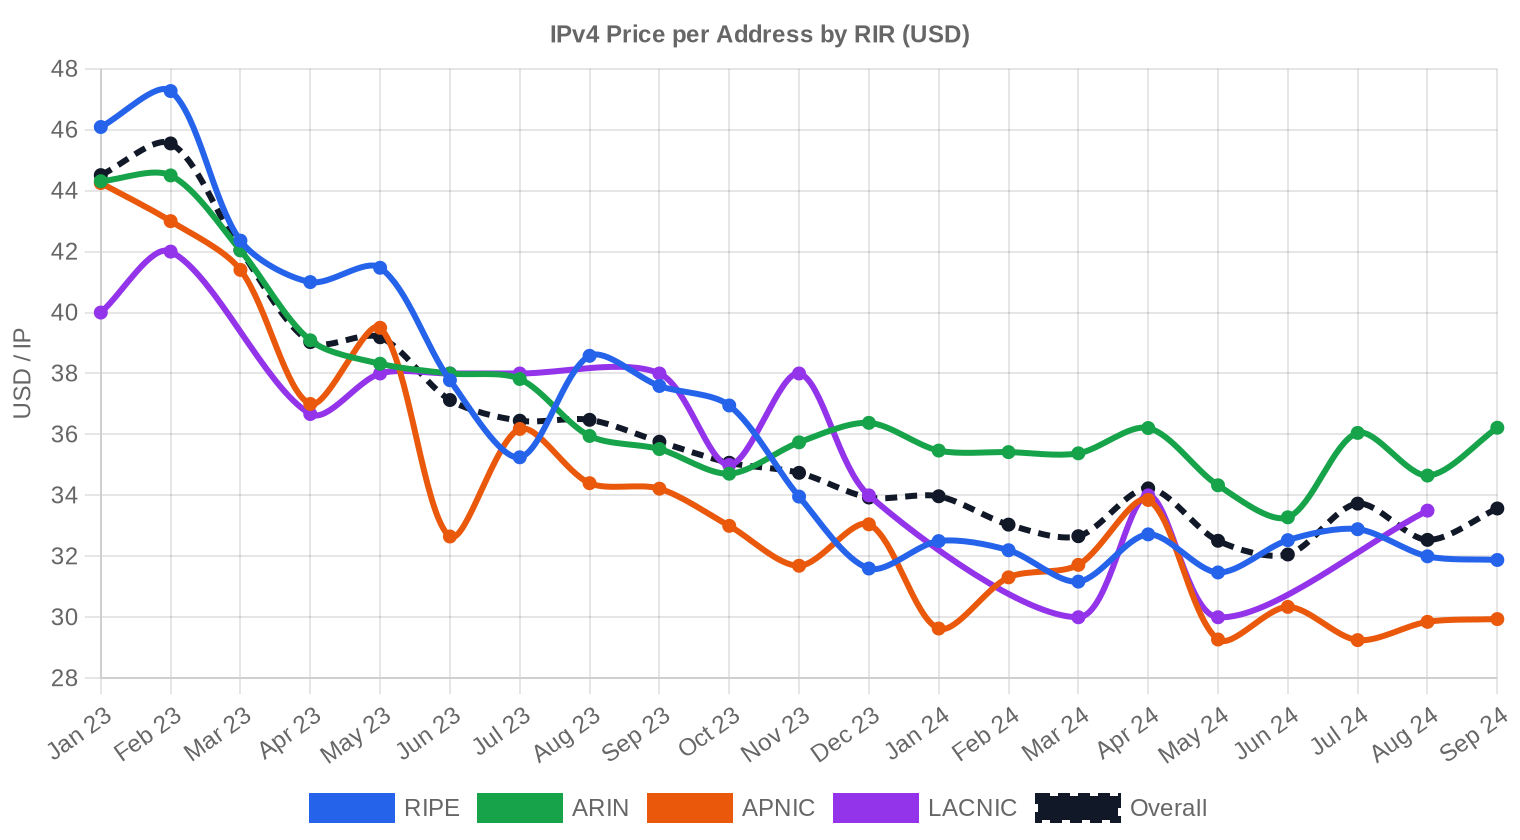
Pricing by RIR
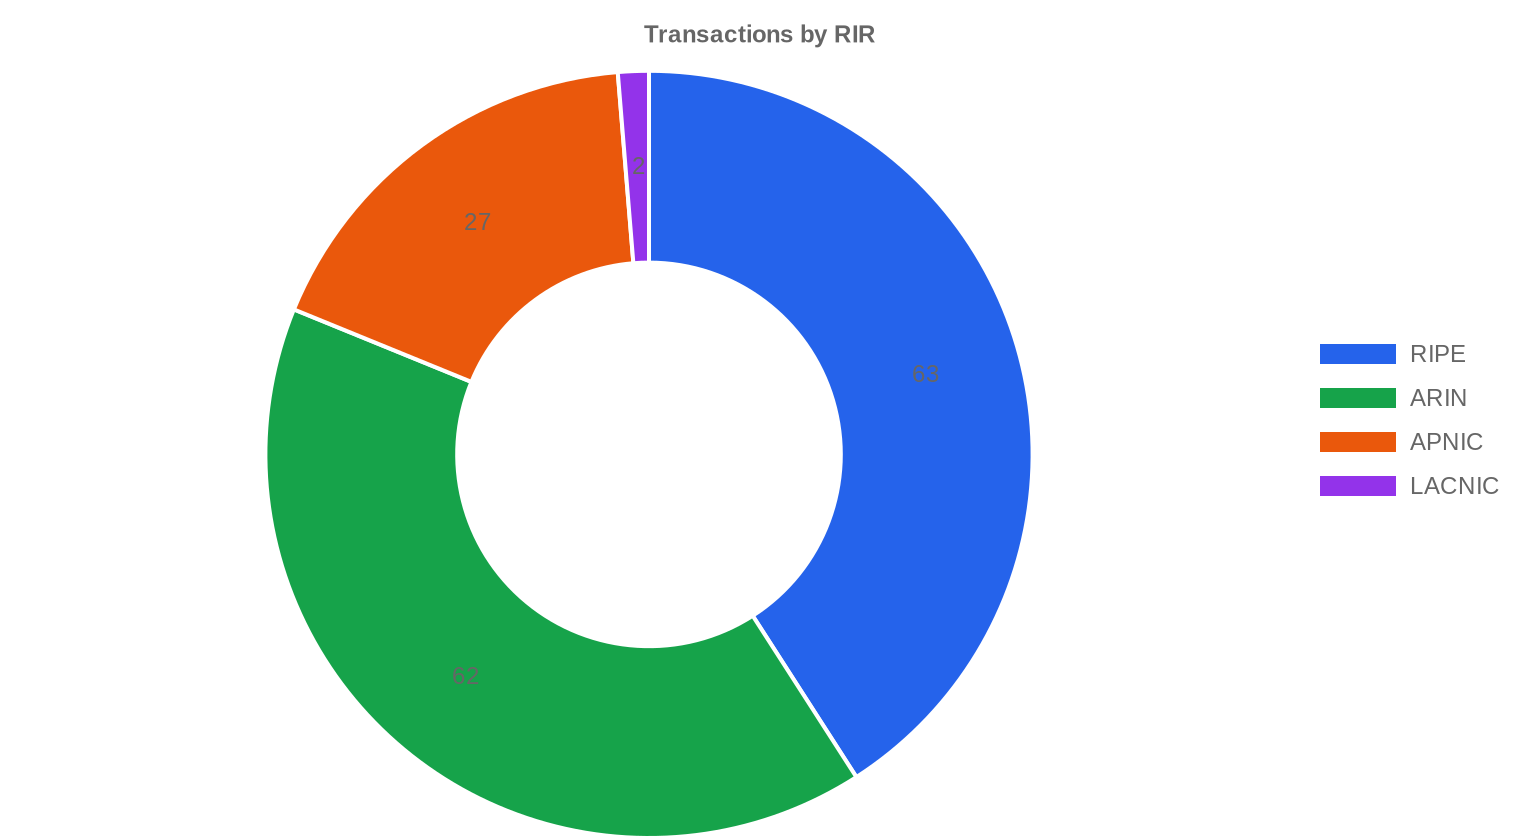
ARIN and RIPE split the quarter almost evenly by transaction count, but ARIN dominated by volume — 258,560 IPs versus RIPE's 65,280. The premium for ARIN-registered space widened again: $35.66/IP average versus $32.30 for RIPE and $29.75 for APNIC. That $5.91 ARIN-to-APNIC spread is the widest we've tracked in recent quarters and reflects both the transferability advantages of ARIN blocks and the relative oversupply of APNIC /24s from Southeast Asian holders.RIPE: $32.30/IP average across 63 transactions (40.9% of deal count, 19.3% of IP volume). Tight range of $28.50–$40.00 shows a mature, liquid market.
ARIN: $35.66/IP average across 62 transactions (76.3% of IP volume). Range of $28–$44 reflects the pull of larger blocks — three deals over $1M were almost certainly ARIN space.
APNIC: $29.75/IP average across 27 transactions. Continues to trade at a structural discount, with a $26–$32.80 band that attracts budget-conscious buyers willing to accept regional constraints.
LACNIC: Just 2 transactions totaling 768 IPs at $33.50/IP average. Too thin to draw conclusions, but pricing was inline with global averages.
| RIR | Transactions | Avg $/IP | Median $/IP | IPs Traded | RIR Transfers | Next Month (proj.) | Year-End (proj.) |
|---|---|---|---|---|---|---|---|
| RIPE | 63 | $32.30 | $32.00 | 65,280 | 1,375 | $31.00 | $31.00 |
| ARIN | 62 | $35.66 | $35.00 | 258,560 | 904 | $37.00 | $37.50 |
| APNIC | 27 | $29.75 | $30.00 | 14,336 | 0 | $29.50 | $29.50 |
| LACNIC | 2 | $33.50 | $33.50 | 768 | 0 | $33.00 | $33.00 |
Transaction Volume
Supply & Block Sizes
/24 blocks dominated again, accounting for 62 of 154 transactions — 40% of all deals. This is the bread-and-butter of the market: single /24s are the minimum routable block on most networks, and they're what SMBs and smaller ISPs actually need. The concentration at /24 tells us the long tail of small buyers remains active even as headline deal count falls, which is healthy for market structure.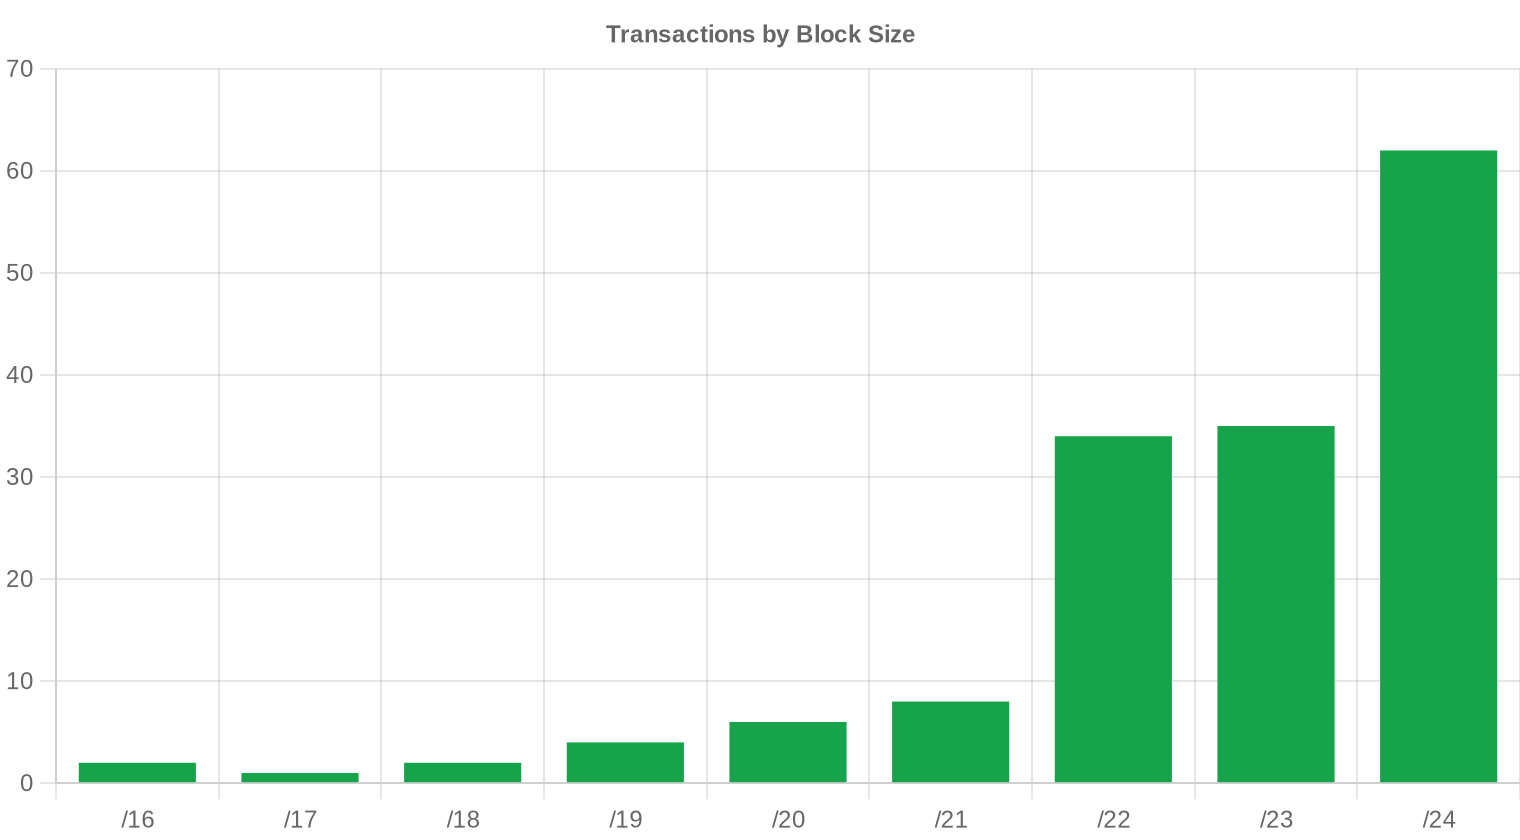
Geographic Activity
Country-level data is unavailable for Q3 2024. However, the RIR distribution — 40.9% RIPE, 40.3% ARIN, 17.5% APNIC — suggests European and North American buyers continue to drive the market roughly in proportion to their share of global IP-dependent infrastructure. APNIC's 27 deals are consistent with steady demand from Southeast Asian hosting providers and ISPs who favor the region's lower price point.Registry Transfer Activity
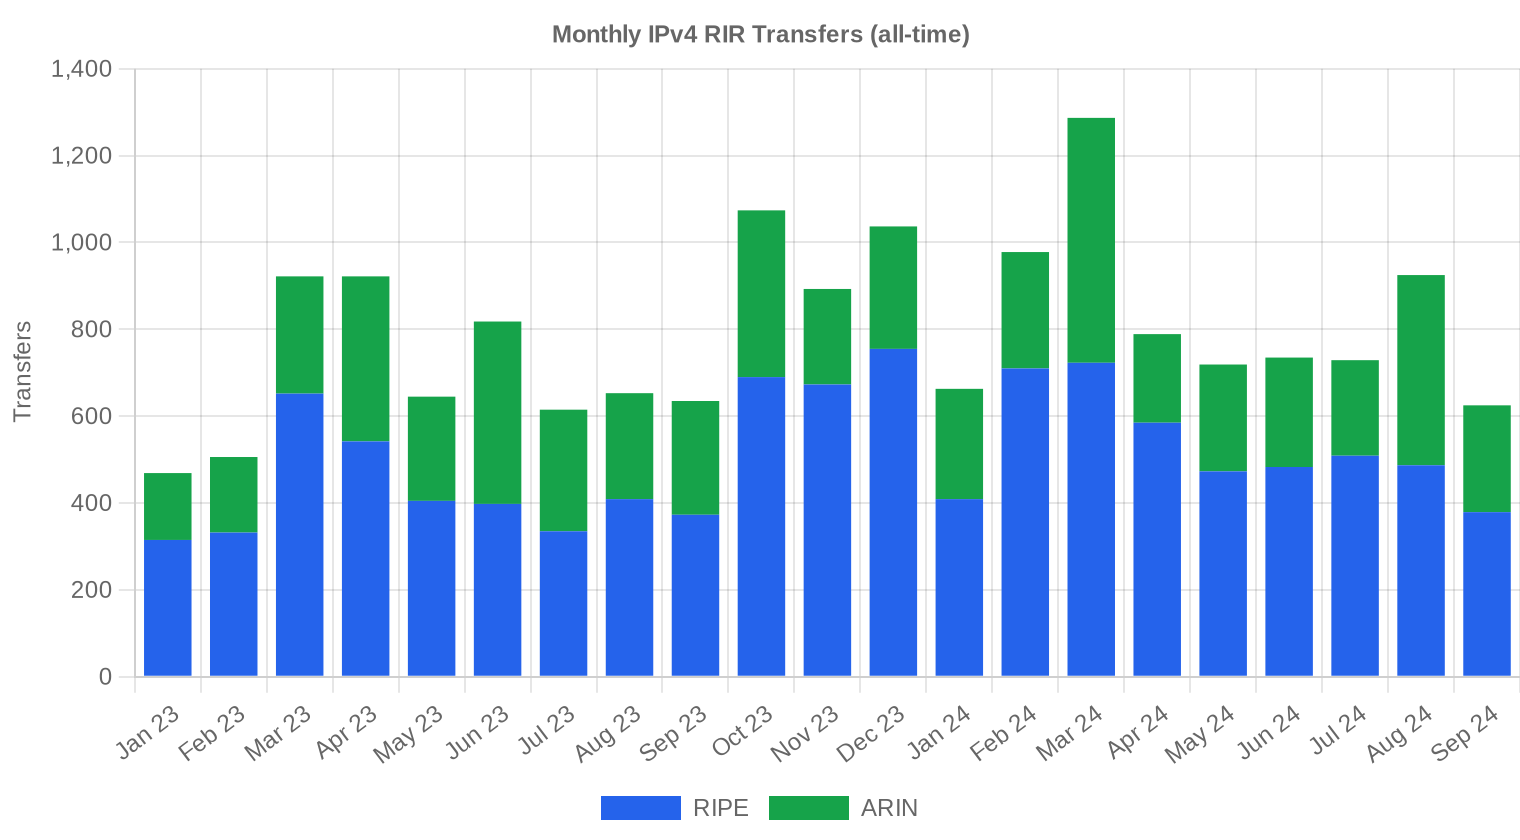
RIR-recorded transfers totaled 2,279 this quarter. RIPE accounted for the majority at 1,375 transfers (60.3%), with ARIN at 904 (39.7%). APNIC, LACNIC, and AFRINIC recorded zero official transfers in the period, though APNIC transacted 27 deals on our platform — the gap likely reflects differences in how registries count and report inter-party vs. intra-RIR movements.Long-Run Transfer Trends
Over the 21-month tracking window, cumulative transfers reached 16,639. The peak month was March 2024, which aligns with end-of-Q1 budget cycles and a brief price dip that drew opportunistic buyers. RIPE holds 63.9% of the long-run transfer share versus ARIN's 36.1%, a ratio that has been remarkably stable and reflects the deeper European secondary market where the 24-month rule creates both friction and a reliable resale pipeline.| RIR | RIR Transfers |
|---|---|
| RIPE | 10,637 |
| ARIN | 6,002 |
| RIR Transfers | 16,639 |
Outlook & Forecast
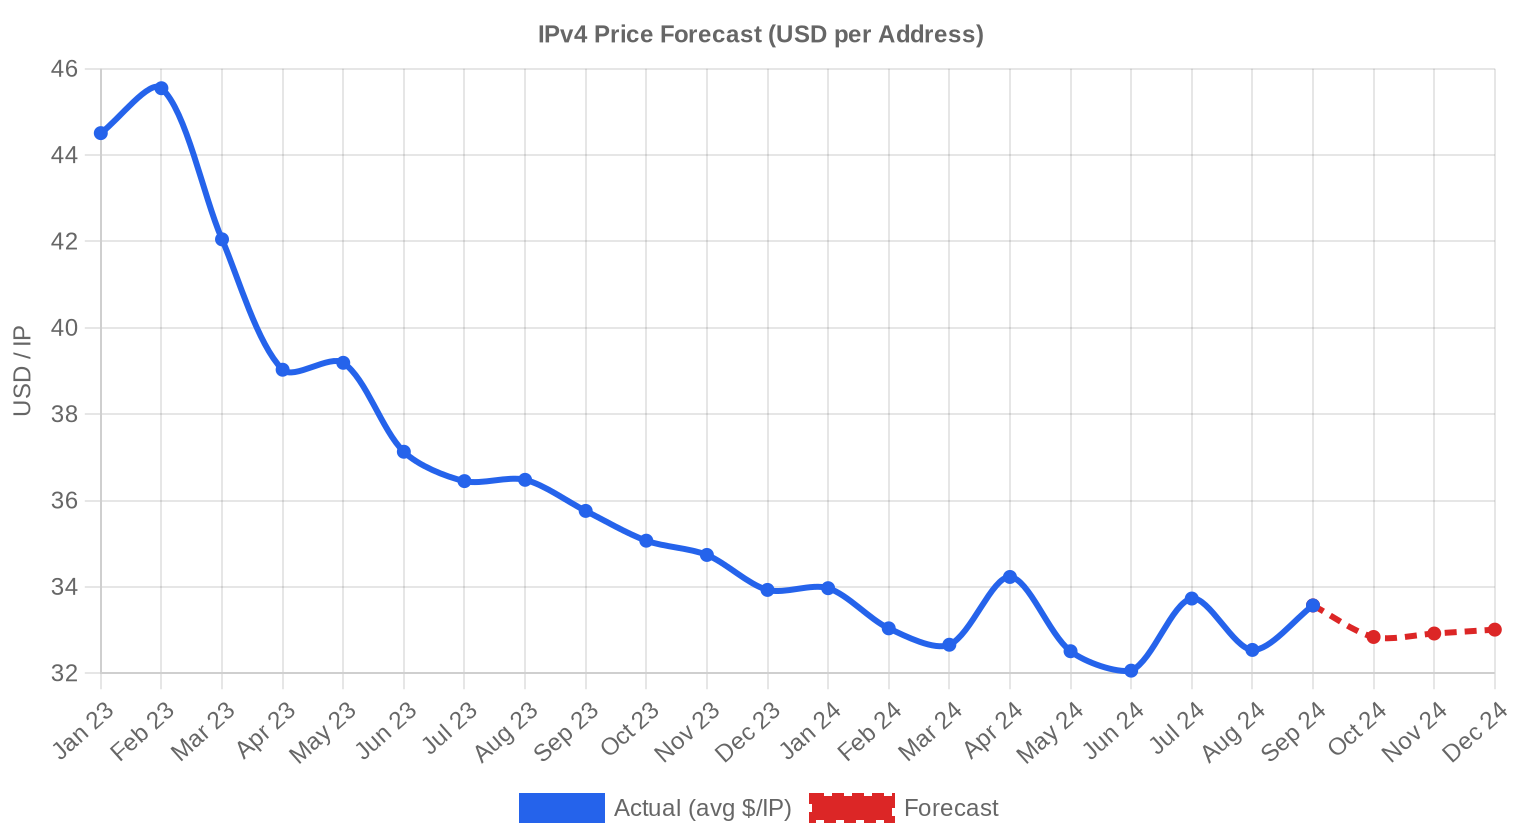
Forecasting each block-size band and RIR separately with our AI model:
The overall average price per IP is projected to reach $33.01 by December 2024, with a next-month estimate of $32.61 per IP.
- RIPE: projected at $31.00 per IP next month, trending toward $31.00 by December 2024.
- ARIN: projected at $37.00 per IP next month, trending toward $37.50 by December 2024.
- APNIC: projected at $29.50 per IP next month, trending toward $29.50 by December 2024.
- LACNIC: projected at $33.00 per IP next month, trending toward $33.00 by December 2024.
- AFRINIC: insufficient data for a reliable forecast.
Forecast by Block Size
| Block | Current $/IP | Next Month | Year-End | Confidence |
|---|---|---|---|---|
| /24 | $32.80 | $33.00 (+0.6%) | $33.50 (+2.1%) | medium |
| /23 | $30.99 | $31.00 (0.0%) | $31.00 (0.0%) | medium |
| /22 | $32.50 | $32.50 (0.0%) | $33.00 (+1.5%) | medium |
| /21 | $33.00 | $33.00 (0.0%) | $33.50 (+1.5%) | medium |
| /20 | $38.00 | $36.00 (-5.3%) | $37.00 (-2.6%) | low |
| /19 | $33.50 | $33.50 (0.0%) | $34.00 (+1.5%) | low |
| /18-/16 | $31.75 | $32.00 (+0.8%) | $32.00 (+0.8%) | low |
| /15-up | $51.50 | $50.00 (-2.9%) | $50.00 (-2.9%) | low |
Editor's Take: Buy vs. Lease
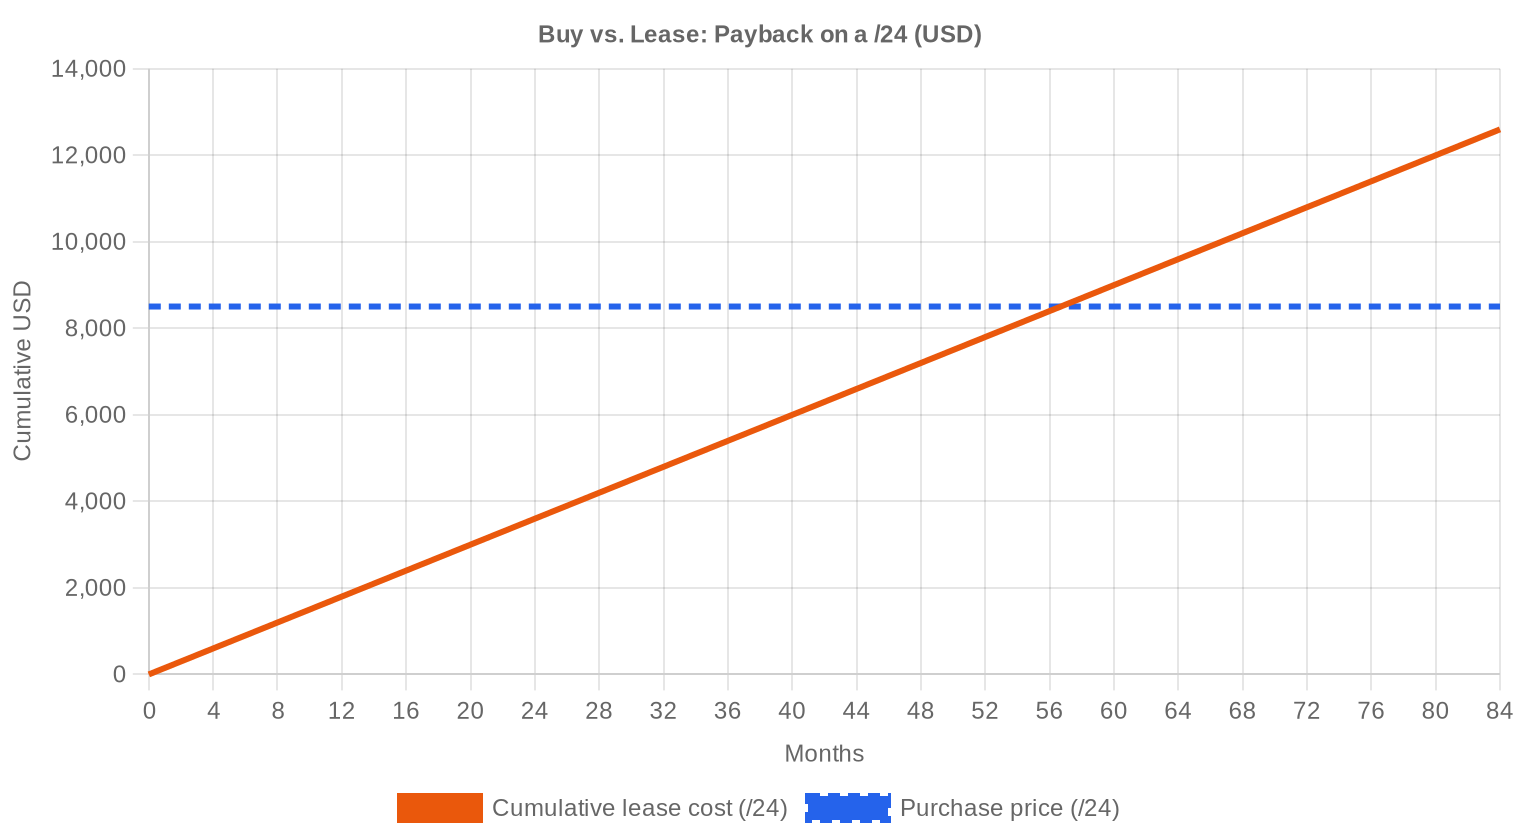
The buy-versus-lease math continues to favor purchasing. At current rates — $33.22/IP to buy, $0.5859/IP per month to lease — the breakeven is 56.7 months, or roughly 4.7 years. Any buyer with a planning horizon beyond five years should be acquiring, not leasing. The implied annual yield for a block holder leasing out space is 21.2%, which is extraordinary by any asset-class standard and explains why institutional holders are reluctant to sell. For a /24, the numbers are $8,504 to buy versus $150/month to lease — that's $1,800/year, a 21% cash yield on a depreciating-but-not-expiring asset. Our recommendation: buy if you need the space for more than four years; lease only for short-term projects or burst capacity.| /24 Purchase price | $8,504 |
| /24 Lease price | $150 / mo |
| Payback period | 56.7 mo (4.7 yr) |
| Gross annual yield | 21.2% |
What This Means for You
Buyers: Prices are 8.5% cheaper than a year ago and essentially flat quarter-over-quarter. The 21% drop in deal count means less competition for available blocks. This is a buyer's market if you're willing to move quickly on quality inventory — especially RIPE /24s in the $28–$32 band.Sellers: The decline in transaction volume is a warning sign. If you're sitting on blocks acquired during the 2021–2023 run-up, Q4 looks like a window to exit before any further softening. ARIN blocks still fetch a meaningful premium, so hold those longer if you can.
Leasers: At $0.59/IP/month, leasing remains expensive relative to buying on any multi-year horizon. If your lease commitment is approaching the 5-year mark, run the breakeven calculation and consider converting to ownership.
Block holders: A 21.2% annual yield on leased-out space is well above any fixed-income alternative. If you don't need the addresses operationally, the leasing income alone justifies holding. Selling only makes sense if you need the lump sum or believe prices will decline materially from here.
Browse verified IPv4 blocksSell IPv4 →
List your blocks with managed transferLease IPv4 →
Flexible short-term capacityLease Out IPv4 →
Turn idle blocks into recurring revenue
IPv4 Pricing by Block Size
/24s traded at an effective premium of 15–20% over per-IP rates on larger blocks, consistent with prior quarters. The three deals above $1 million — likely /16 or larger ARIN blocks — almost certainly cleared in the $28–$32/IP range, well below the $35.66 ARIN average, confirming the standard volume discount curve. For reference, a clean /24 in RIPE space is clearing around $8,200–$10,200, while a /20 (4,096 IPs) likely trades near $130,000–$140,000.| Block | IPs | Buy: /IP | Buy: Total | Lease: /IP/mo | Lease: Monthly |
|---|---|---|---|---|---|
| /24 | 256 | $35–45 | $8,960–11,520 | $0.38–0.50 | $97–128 |
| /22 | 1,024 | $28–38 | $28,672–38,912 | $0.33–0.45 | $338–461 |
| /20 | 4,096 | $22–32 | $90,112–131,072 | $0.30–0.40 | $1,229–1,638 |
| /18 | 16,384 | $20–30 | $327,680–491,520 | $0.30–0.38 | $4,915–6,226 |
| /16 | 65,536 | $18–28 | $1,179,648–1,835,008 | $0.30–0.35 | $19,661–22,938 |
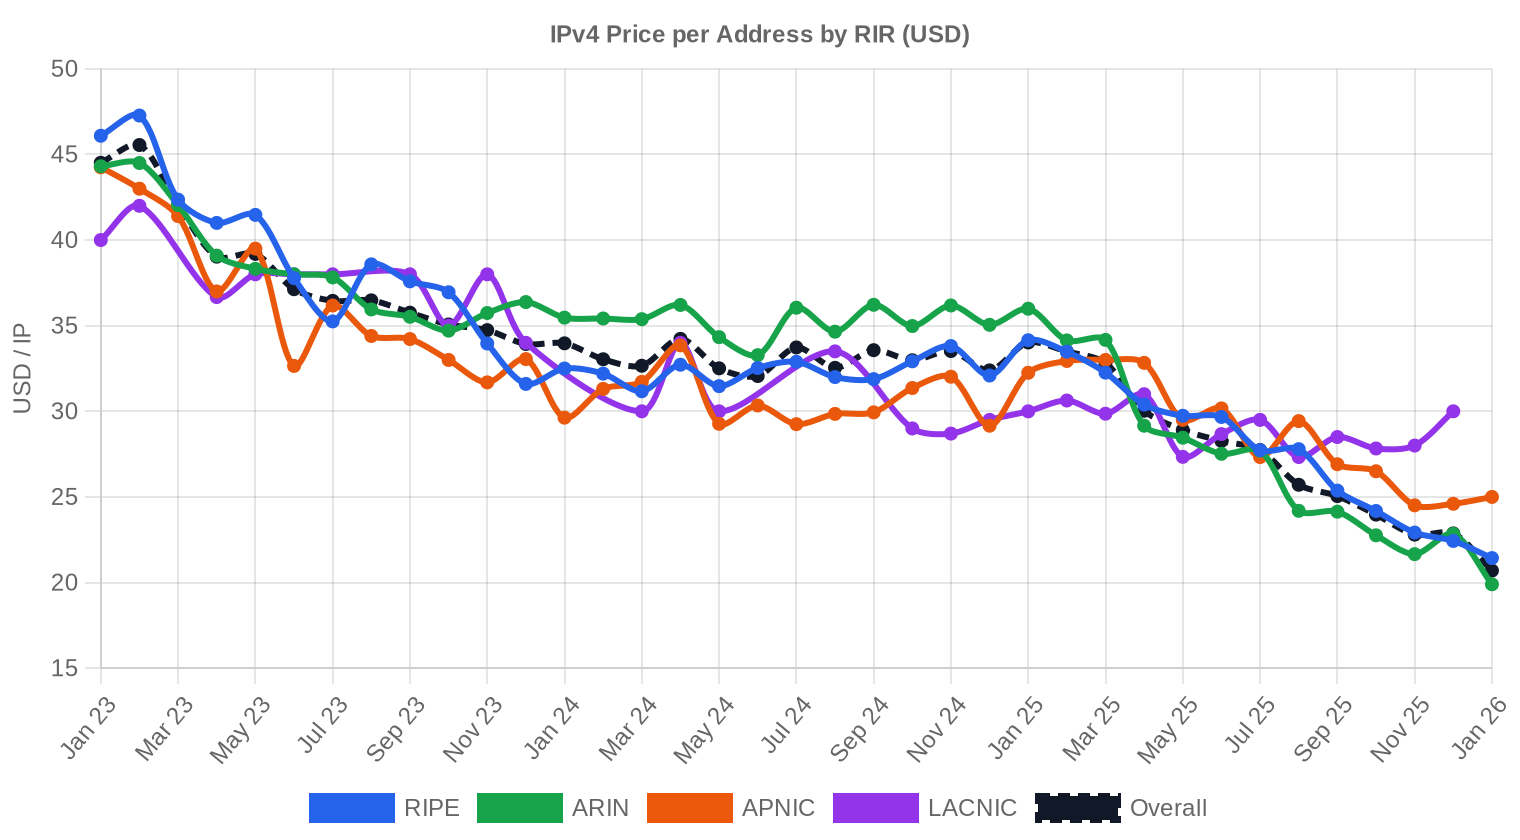
IPv4 Price History: 2011–2026
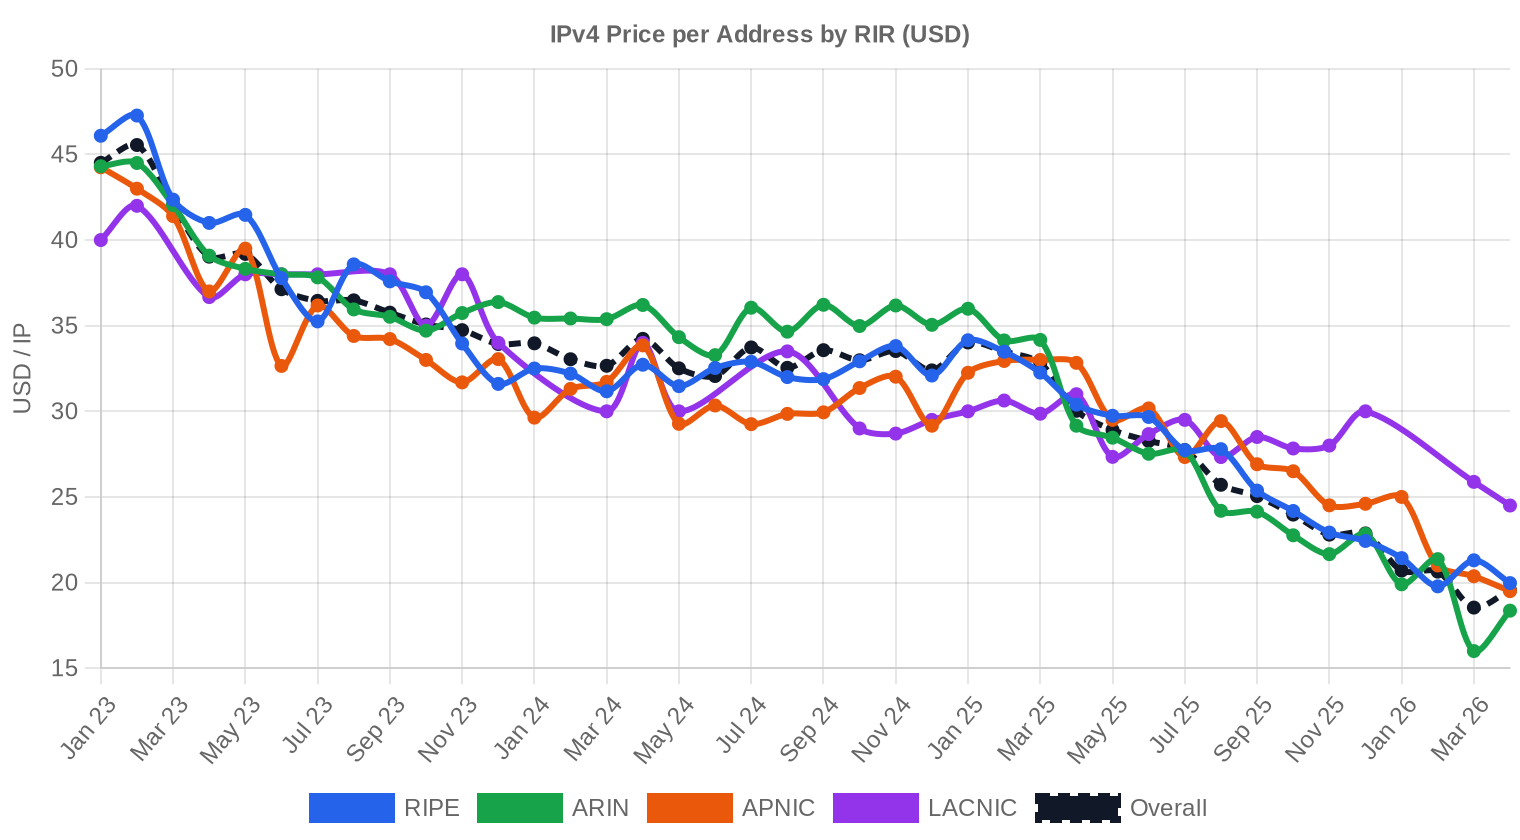
IPv4 addresses first acquired meaningful market value after IANA exhaustion in 2011, when initial trades cleared below $10/IP. Prices climbed steadily through the 2010s, accelerated sharply during 2021–2022 to peak near $50–$55/IP for small blocks, then corrected after AWS began charging $0.005/hour for public IPs in February 2024. The current $33.22 average represents a roughly 35–40% correction from peak levels and appears to be finding a floor. The market has bifurcated: ARIN and RIPE blocks trade at premiums reflecting transferability and routing trust, while APNIC and LACNIC space discounts reflect regional constraints and smaller buyer pools.| Year | ~Price/IP | Key Event |
|---|---|---|
| 2011 | $7–12 | IANA free pool exhausted; Microsoft/Nortel deal ($11.25/IP) |
| 2012 | $8–12 | RIPE NCC reaches last /8; begins /22-only allocation |
| 2014 | $10–15 | LACNIC free pool exhausted |
| 2015 | $8–15 | ARIN free pool exhausted |
| 2017–18 | $12–18 | Leasing market grows; cloud demand rises |
| 2019 | $18–24 | RIPE NCC exhausts remaining free pool |
| 2021–22 | $50–60+ | Post-pandemic peak; hyperscaler build-outs |
| 2024 | $35–52 | AWS IPv4 charge ($0.005/IP/hr); large block correction |
| 2025–26 | $18–45 | Market bifurcation; /16s below $20 for first time since 2019 |
Market Structure: Who Is Buying & Selling
The buy side is dominated by mid-tier cloud providers, regional ISPs expanding coverage, and hosting companies stocking up ahead of BEAD-related buildouts. Enterprise IT departments are less active than they were in 2022–2023, likely because many completed their IPv4 procurement during that cycle. On the sell side, legacy allocations from defunct telecoms and corporate mergers continue to feed supply, and we're seeing more blocks come from private-equity-backed portfolio companies cleaning up IP assets acquired through roll-ups.IPv4 vs. Other Asset Classes
At a 21.2% implied annual yield (based on lease-to-purchase ratio), IPv4 addresses outperform virtually every conventional asset class. Ten-year Treasuries yield roughly 4.3%. Commercial real estate cap rates sit in the 5–7% range. Even high-yield bonds are in the 7–9% band. The caveat is liquidity — you can't sell a /24 in seconds the way you can dump a bond ETF — but for patient capital, the risk-adjusted return remains compelling, especially given that the underlying asset doesn't depreciate to zero as long as IPv4 routing tables exist.| Asset Class | Typical Yield | Liquidity | Primary Risk |
|---|---|---|---|
| IPv4 | 21.2% | Moderate | IPv6 adoption, block quality |
| Commercial Real Estate | 5–8% | Low | Vacancy, rate cycle |
| Investment-Grade Bonds | 4–5% | High | Duration, credit risk |
| S&P 500 | ~1,3% | High | Market volatility |
| Money Market / T-Bills | ~4–5% | High | Rate cycle changes |
IPv6 Adoption & Why IPv4 Remains Essential
IPv6 adoption continues its glacial pace. Google's measurements show roughly 45% of traffic reaching its services over IPv6, but that number is heavily skewed by mobile carriers and large ISPs who dual-stack. Enterprise adoption remains in the low single digits. The practical reality is that every public-facing service still needs IPv4 reachability, and that constraint won't change in any planning horizon that matters to current market participants. Coexistence — not replacement — is the operating assumption for the next decade.AI & Cloud Infrastructure Demand
The AI infrastructure buildout is a secondary but growing source of IPv4 demand. Training clusters need relatively few public IPs, but inference endpoints — especially those serving API traffic — require routable addresses at scale. GPU cloud providers that spun up in 2023–2024 have been steady buyers of /20 to /18 blocks in both ARIN and RIPE regions. As inference workloads scale toward millions of concurrent sessions, the IP requirements will grow in step.What Determines IPv4 Block Value
Block valuation hinges on five factors: RIR (ARIN commands 10–18% premiums over APNIC), allocation age (older blocks are perceived as cleaner), blacklist status (even one major blacklist hit can knock 15–20% off the price), contiguity (a single /20 is worth more than 16 scattered /24s), and transfer friction (RIPE's 24-month rule, APNIC's membership requirements). Buyers increasingly run automated reputation checks before bidding, which means sellers with dirty blocks face longer marketing timelines and deeper discounts.Sell vs. Lease: A Decision Framework
In a flat-to-declining price environment like Q3 2024, leasing is the higher-return strategy for holders who don't need immediate liquidity. At 21.2% annual yield, a block holder recovers the full market value of their asset in under five years while retaining ownership. Selling makes sense in two scenarios: if you believe prices will fall significantly further, or if you need the cash now. Given our flat forecast through year-end, the leasing math wins for most holders.| /24 Purchase price | $8,504 |
| /24 Lease price | $150 / mo |
| Payback period | 56.7 mo (4.7 yr) |
| Gross annual yield | 21.2% |
RIPE NCC 24-Month Transfer Restriction
RIPE NCC's 24-month holding requirement continues to act as a supply throttle, preventing rapid flipping and creating a natural delay in how quickly acquired blocks can re-enter the market. This rule effectively removes a chunk of supply from the tradeable float at any given time and supports a modest price premium for RIPE blocks that have already cleared the holding period. Buyers should verify a block's transfer history before closing — purchasing space still within its 24-month window means you inherit the remaining lock-up.Deal Size Distribution
The market remains heavily weighted toward small transactions: 131 deals (85% of count) fell under $50,000, totaling $2.28 million. The $50K–$250K band contributed 14 deals worth $1.36 million. Six deals in the $250K–$1M range totaled $2.18 million, and three transactions exceeded $1 million, accounting for $5.44 million — nearly half the quarter's total value. Average deal size rose to $72,941 from $67,775 in Q2, a 7.6% increase driven by those large-block trades rather than a broad-based move upmarket.Top Trading Countries
Country-level transaction data is not available for Q3 2024. Based on RIR distribution, the buyer base appears split roughly 40/40/20 between Europe, North America, and Asia-Pacific — a pattern consistent with the global distribution of hosting and ISP infrastructure investment. We expect more granular geographic reporting to become available as registry transparency initiatives mature.BEAD Broadband Program Impact
The $42.45 billion BEAD program is moving from planning to procurement in multiple states, and ISPs building out last-mile broadband will need IPv4 allocations to serve new subscribers. The impact so far has been muted — most BEAD recipients are still in the design phase — but we expect mid-size block demand (/20 to /18) to increase through 2025 as construction timelines accelerate. ISPs that wait until network deployment to source addresses will face tighter supply and likely higher prices.Hyperscaler IPv4 Holdings
Amazon, Microsoft, and Google collectively control an estimated 100+ million IPv4 addresses. AWS's decision to charge for public IPv4 starting in February 2024 reduced its internal demand and put downward pressure on the open market — that policy change is a primary driver of the 8.5% year-over-year price decline. If any hyperscaler decides to monetize surplus blocks, the supply impact could be significant. For now, they appear content to hold, which keeps the market in its current equilibrium.Macroeconomic Conditions & Market Impact
The Fed held rates steady through Q3 2024, with markets pricing in the first cut for late Q4. Higher-for-longer rates dampen capital expenditure budgets, which explains some of the 21.4% drop in deal count — fewer organizations are approving large IP purchases when financing costs remain elevated. If rate cuts materialize in Q4 or early 2025, we'd expect a modest uptick in transaction volume, particularly for mid-size deals in the $50K–$250K band where corporate budget approvals are most rate-sensitive.Model Update & Calibration
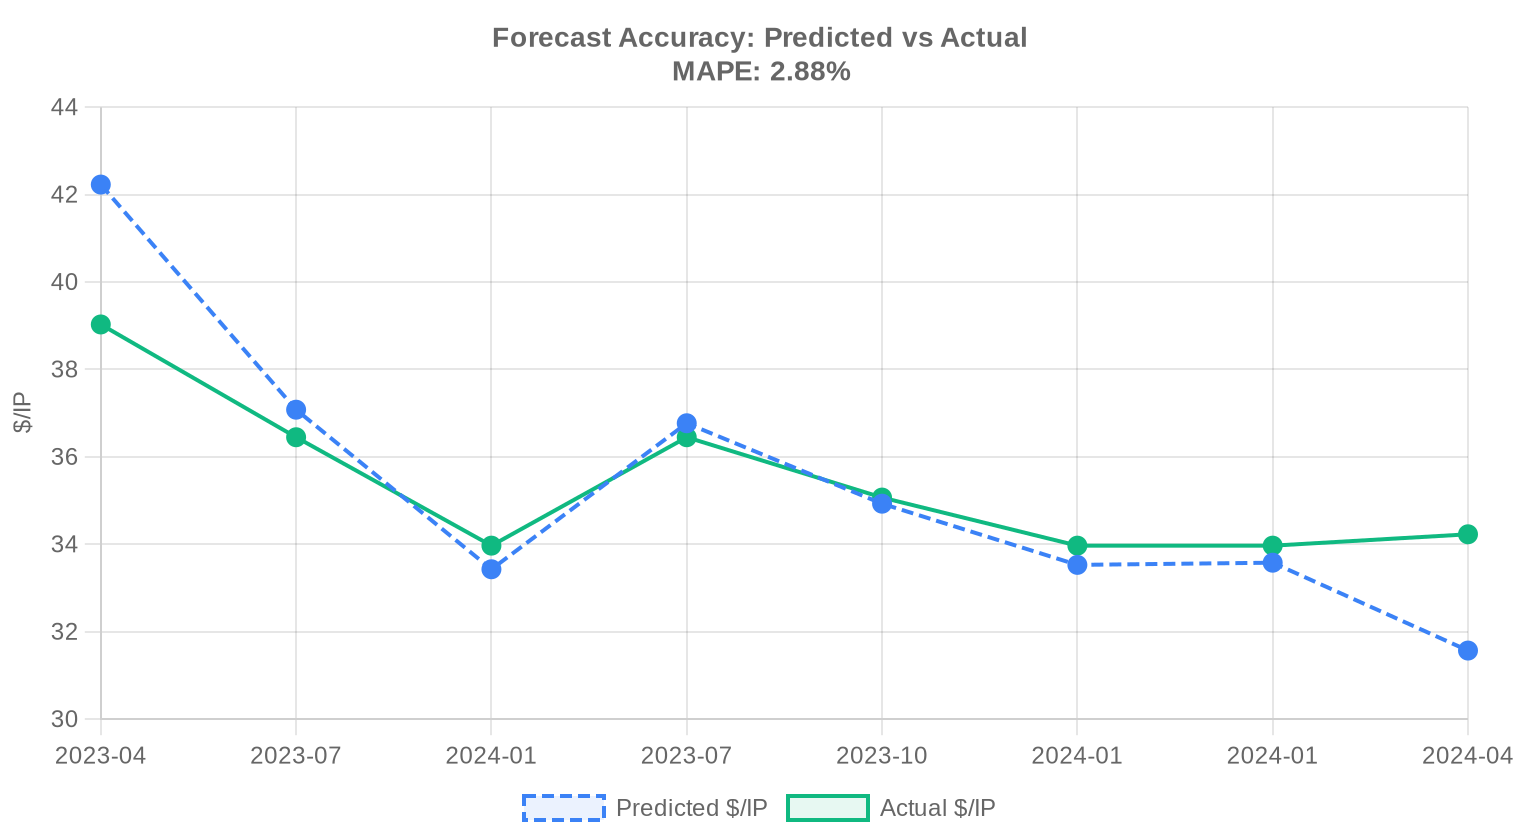
We reviewed our past projections against actual market outcomes and recalibrated the model for this report. The updated model places more weight on recent price movements using exponential decay, dynamically adjusts prediction bands to reflect current market conditions, and corrects for any systematic bias detected in earlier forecasts. The predicted-vs-actual comparison chart below shows how closely our past estimates tracked reality.
| Report Period | Target Month | Predicted | Actual | Deviation |
|---|---|---|---|---|
| 2023 | 2024-01 | $33 | $34 | -2% |
| 2023-Q2 | 2023-07 | $37 | $36 | +1% |
| 2023-Q3 | 2023-10 | $35 | $35 | 0% |
| 2023-H2 | 2024-01 | $34 | $34 | -1% |
| 2023-Q4 | 2024-01 | $34 | $34 | -1% |
| 2024-Q1 | 2024-04 | $32 | $34 | -8% |
Methodology
Figures are based on completed IPv4Center marketplace transactions and RIR transfer statistics. Prices are in US dollars per IP address. Forecasts are produced by an AI model that analyses each block-size band and RIR segment separately (with outlier-trimmed medians) alongside known market catalysts; they are estimates, not guarantees.
Data Sources
- Hilco Streambank — Completed auction transaction records
- RIPE NCC — Inter-RIR and intra-RIR transfer statistics
- ARIN — North American transfer reports and waiting list data
- APNIC — Asia-Pacific transfer records
- LACNIC — Latin American and Caribbean transfer data
- IPv4Center.com — Proprietary marketplace transaction and lease pricing data
This report is generated automatically for informational purposes only and does not constitute financial advice.
Frequently Asked Questions
What was the average price per IPv4 address in Q3 2024?
The global weighted average landed at .22 per address, with a median of .50. The spread between floor () and ceiling () — roughly 70 % — reflects persistent segmentation by RIR, block size, and buyer urgency.
How many transactions closed in Q3 2024 and what was the total dollar volume?
We tracked 154 completed sale transactions encompassing 338,944 addresses for an aggregate consideration of approximately .2 million. The average deal size worked out to about 2,201 addresses, though the distribution is heavily right-skewed by a handful of large ARIN blocks.
Which RIR commanded the highest prices during the quarter?
ARIN blocks were the priciest at .66 per IP on average — a roughly 10 % premium to RIPE (.30) and a 20 % premium to APNIC (.75). ARIN's deeper compliance infrastructure and the sheer scale of North American demand continue to support that spread.
Why are APNIC addresses trading at a discount to RIPE and ARIN?
APNIC blocks averaged .75 per IP in Q3 — the lowest among the three active RIRs — on only 27 transactions totaling 14,336 addresses. Thinner liquidity, stricter transfer policies in some APNIC economies, and a buyer base that skews toward price-sensitive emerging markets all compress the bid.
RIPE led in transaction count — what does that tell us about European demand?
RIPE accounted for 63 of 154 sales (40.9 % by count) and a commanding 63.9 % of all registered inter-RIR transfers (1,375 of 2,279). European cloud, hosting, and telecom buyers remain the most active cohort globally, even as individual deal sizes tend to run smaller than their ARIN counterparts.
How did ARIN dominate in total IP volume despite trailing RIPE in deal count?
ARIN moved 258,560 addresses across 62 transactions — 76 % of all IPs traded — versus RIPE's 65,280 on 63 deals. The implication is straightforward: North American deals are structurally larger, driven by hyperscalers and large ISPs acquiring /16s and bigger.
What was the most popular prefix size in Q3 2024?
/24 blocks accounted for 62 of 154 transactions, roughly 40 % of deal count. This confirms that the long tail of the market is small-lot retail — startups, SMB hosting firms, and email-reputation buyers picking up single /24s at a time.
Were there any AFRINIC transactions this quarter?
Zero. AFRINIC recorded no sales and no registered transfers in Q3 2024. Ongoing governance disputes and policy uncertainty have effectively frozen the region's secondary market for the foreseeable future.
How did LACNIC perform in Q3 2024?
LACNIC contributed just 2 transactions covering 768 addresses at an average of .50 per IP. The Latin American market remains a rounding error — structurally illiquid with limited transfer policy support.
What is the current lease rate for IPv4 addresses?
Based on a sample of 44 lease agreements, the going rate is approximately .59 per IP per month, or about 0 per /24 per month. Annualized, that equates to roughly .03 per address — a meaningful recurring cost for capacity planners.
At current prices, is it cheaper to buy or lease IPv4 space?
Buy. At .22 per IP (purchase) versus .59/month (lease), the breakeven crossover sits at approximately 56.7 months — just under 4.7 years. Any entity confident in a planning horizon beyond five years should be acquiring, not renting. The implied annual yield for sellers who lease instead of selling is 21.2 %, which tells you leasing is a terrific business if you're on the supply side.
What mistakes should be avoided when purchasing IPv4 blocks in the current market?
Three costly errors recur. First, paying ARIN-tier prices (+) for APNIC or RIPE blocks — the RIR premium structure is real and documented. Second, skipping reputation checks on the address space; blacklisted ranges can take months to rehabilitate. Third, underestimating transfer timelines: ARIN and RIPE transfers averaged 4–8 weeks in Q3, and delays can blow up deployment schedules.
What are the risks of buying at + per IP if IPv6 adoption accelerates?
The risk is real but slow-moving. Global IPv6 capability continues to climb, yet enterprise and cloud migration remains patchy. Even aggressive IPv6 scenarios don't eliminate IPv4 demand before 2030. That said, buyers paying top-of-range ( in Q3) should stress-test their models against a 15–20 % price haircut over five years — a plausible downside if carrier-grade NAT and IPv6-only networks gain traction faster than expected.
What risks do buyers face in the AFRINIC region given the freeze?
Counterparty risk is the headline concern. With zero transactions and unresolved governance issues, any off-market AFRINIC deal carries elevated legal and transferability risk. We advise institutional buyers to avoid AFRINIC-registered blocks until policy clarity returns.
What could go wrong if a buyer relies solely on leasing rather than purchasing?
Lease costs compound relentlessly. At .03 per IP annually, a lessee of a /16 is spending roughly 0,000 per year with no asset accumulation. If lease rates tick up — which supply constraints would suggest — the total cost of ownership diverges sharply from a one-time purchase at .22 per IP within the 4.7-year breakeven window.
Where is the price headed for the rest of 2024?
Our model forecasts a weighted-average price of approximately .61 for the near term, drifting to .01 by December 2024. That implies a gentle upward trend — consistent with the 0.26 % quarter-over-quarter appreciation observed — but nothing resembling the double-digit annual gains of 2021–2022. The forecast is rated reliable.
Is the IPv4 market trending up or down as of Q3 2024?
Up, but barely. The trend is positive with a measured quarterly price change of 0.26 %. This is a mature, grinding market — not a momentum trade. Think T-bills, not tech stocks.
How was deal volume distributed by transaction size?
The market is overwhelmingly small-ticket: 131 of 154 deals (85 %) were under K, totaling .3 million. Mid-market (K–0K) contributed 14 deals worth .4 million. The 3 deals exceeding million accounted for .4 million — nearly half the quarter's total value on just 2 % of transactions.
What drove the concentration of value in just three large deals?
Those three transactions — all in the ARIN region based on block-size distribution — represented .4 million of the .2 million quarterly total. Large North American ISPs and cloud operators continue to hoover up sizable allocations when available, and sellers of /16-and-above blocks hold pricing power in a thin market.
How many total transfers were registered across all RIRs in Q3 2024?
A total of 2,279 transfers were registered, with RIPE accounting for 1,375 (60.3 %) and ARIN for 904 (39.7 %). APNIC, LACNIC, and AFRINIC registered zero transfers. Note that registered transfers include non-sale movements (intra-company, policy-based), so the figure exceeds the 154 confirmed market transactions.
What was the price floor in Q3 2024 and where did it occur?
The lowest recorded price was per IP, observed in the APNIC region. By contrast, RIPE's floor was .50 and ARIN's was . Bottom-fishing at these levels typically involves smaller blocks with reputation issues or in less commercially attractive geographies.
What was the highest price paid per IP this quarter?
per address, within the ARIN region. That represents a 32 % premium to the global average and likely reflects a clean, well-routed block in a desirable size — probably a /16 or larger — sold to a buyer with an urgent deployment timeline.
How should a CFO think about the 21.2 % implied annual yield on IPv4 leasing?
That yield is eye-catching but comes with caveats: it assumes full utilization, zero vacancy, and stable lease rates. Still, for organizations sitting on underutilized address space, leasing generates returns that dwarf most fixed-income alternatives. Think of it as infrastructure-as-yield — with the asset itself likely to hold nominal value for the better part of a decade.
Will IPv6 deployment make IPv4 addresses worthless?
Not in any investable time horizon. IPv6 traffic share is growing but enterprise backend systems, legacy IoT, and regulatory infrastructure remain stubbornly IPv4-dependent. Our year-end 2024 forecast of .01 per IP and a reliable upward trend signal sustained demand. The market is pricing in a very long sunset, not an imminent one.
What does the 90-month theoretical breakeven mean for strategic planning?
The 90-month threshold represents the outer bound — if lease rates were the sole consideration with no residual value for the purchased block. In practice, the actual breakeven is closer to 56.7 months (4.7 years) because purchased blocks retain resale value. Any network build-out with a horizon beyond five years should be budgeting for acquisition, not leasing.