12 min read
This report analyzes the IPv4 transfer market for Q1 2023, based on completed IPv4Center marketplace transactions and official RIR transfer records.
Executive Summary
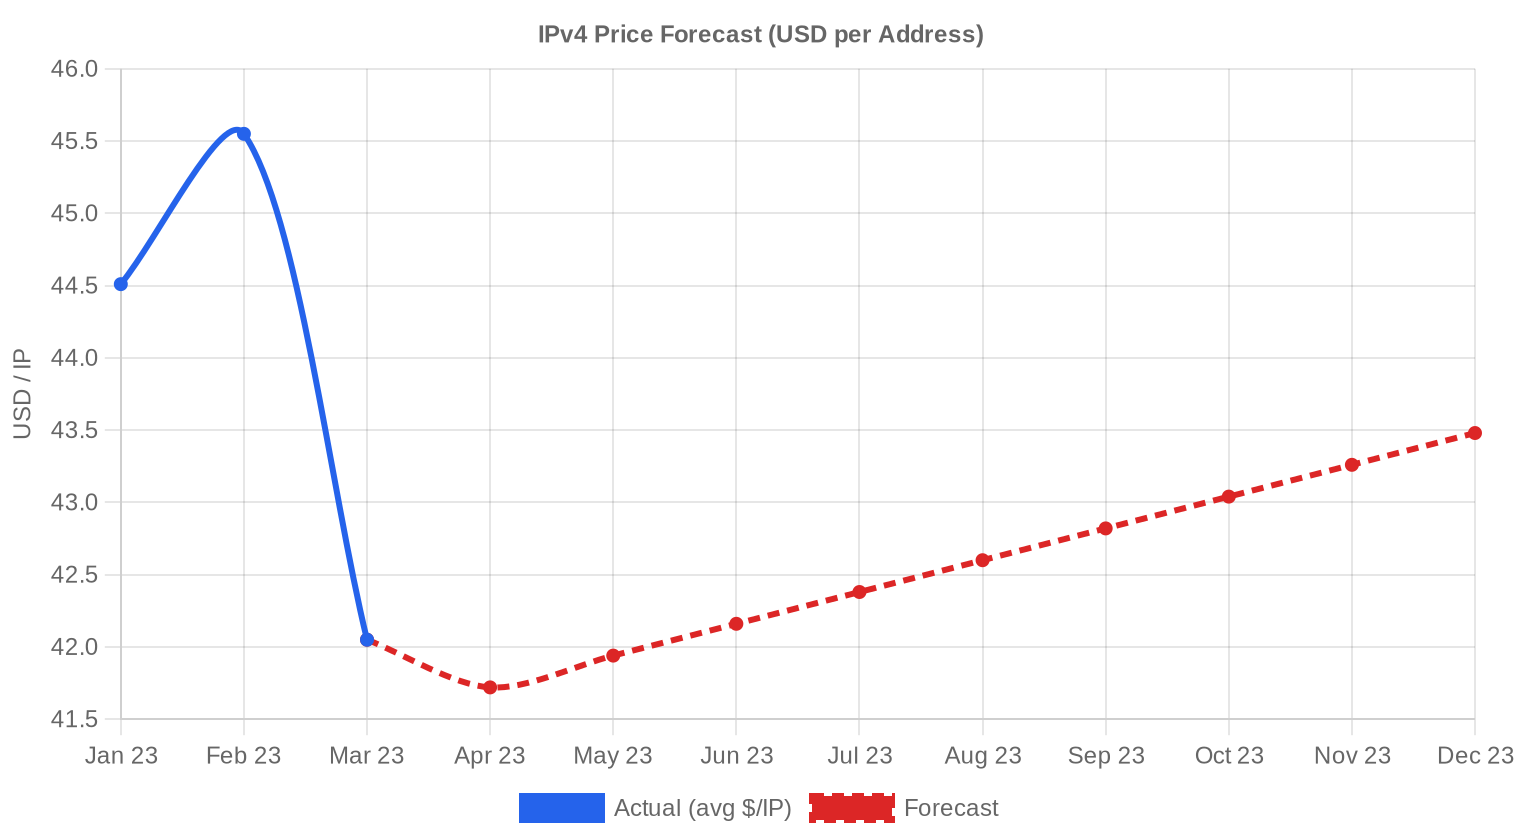
The IPv4 transfer market logged 112 priced transactions in Q1 2023, moving 609,792 addresses at a weighted average of $43.57 per IP. Total market value hit $29.8 million for the quarter. The median transaction price landed at $43.20 — tight to the average, suggesting a well-distributed market rather than one skewed by outlier blocks. The overall trend remains up, with the regression line showing a 0.53% incline across the period. This is a market that has found a floor and is comfortable sitting on it.Market Overview
| Transactions | 112 |
| IP Addresses Traded | 609,792 |
| Estimated Market Value | $29,845,214 |
| Average Price / IP | $43.57 |
| Median Price / IP | $43.20 |
| RIR Transfers | 1,897 |
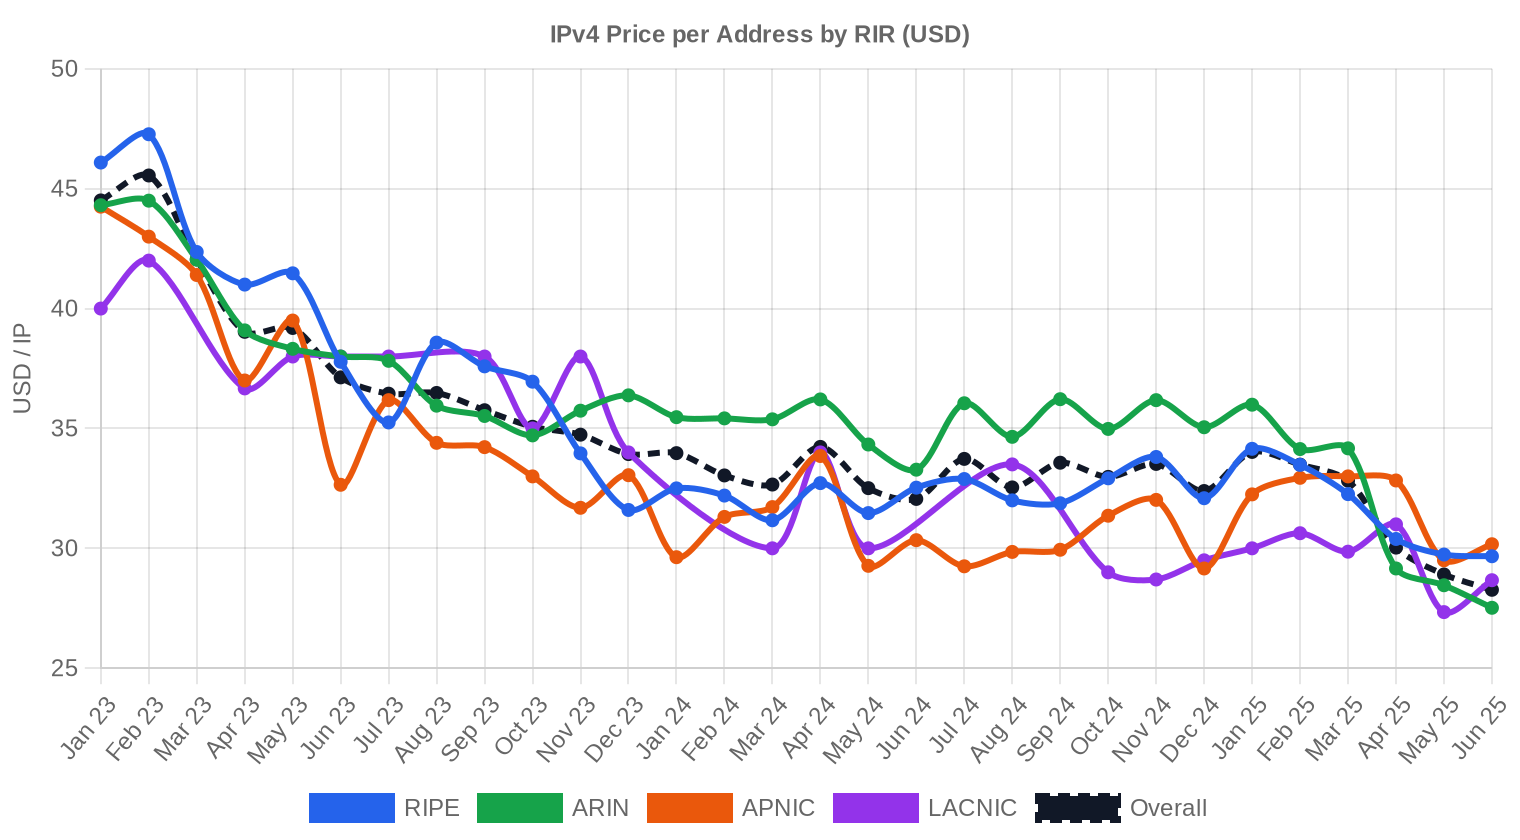
Price Dynamics
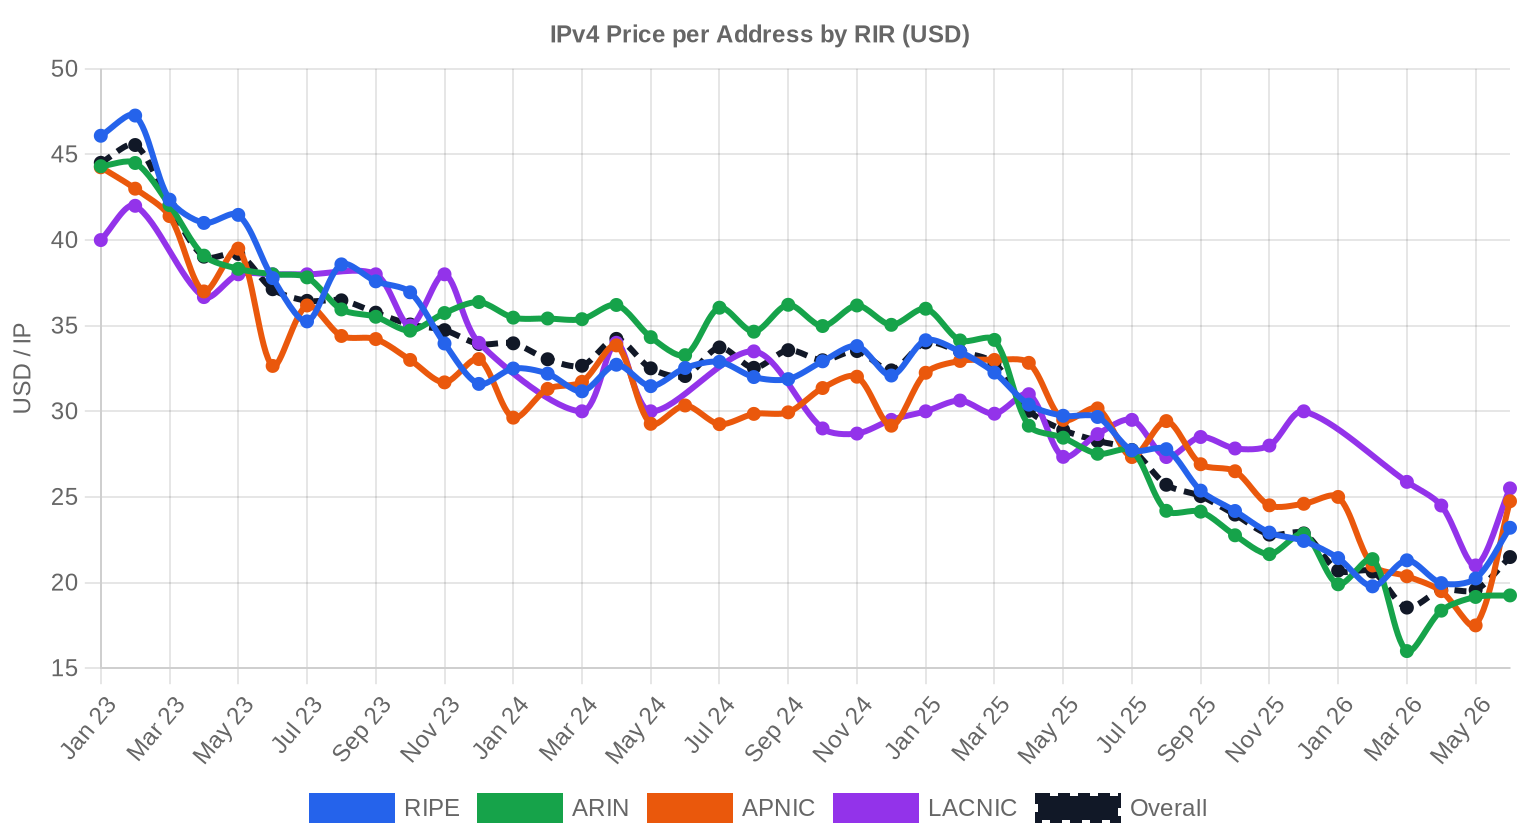
Prices ranged from $35 to $53 per IP in Q1 2023, an $18 spread that reflects block-quality and size differentials more than directional volatility. The $35 floor appeared on LACNIC-region inventory — smaller market, thinner demand, predictable discount. The $53 ceiling came out of ARIN, likely a clean /24 or small block with premium characteristics. The regression trend at +0.53% over the quarter is essentially flat in real terms; buyers and sellers are pricing within a tight consensus band. There's no panic and no euphoria — just orderly price discovery around the low-to-mid $40s.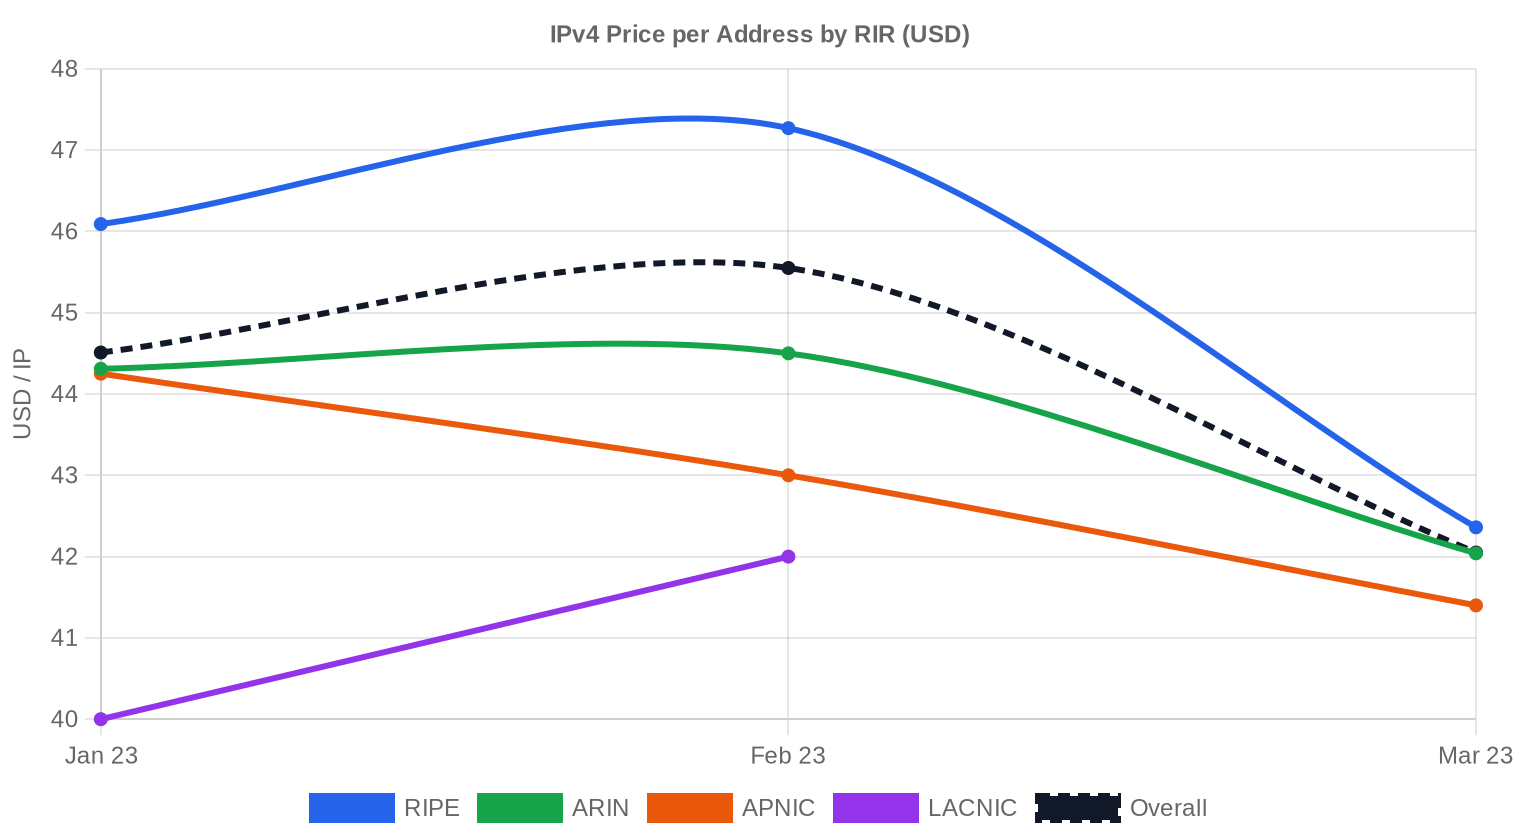
Pricing by RIR
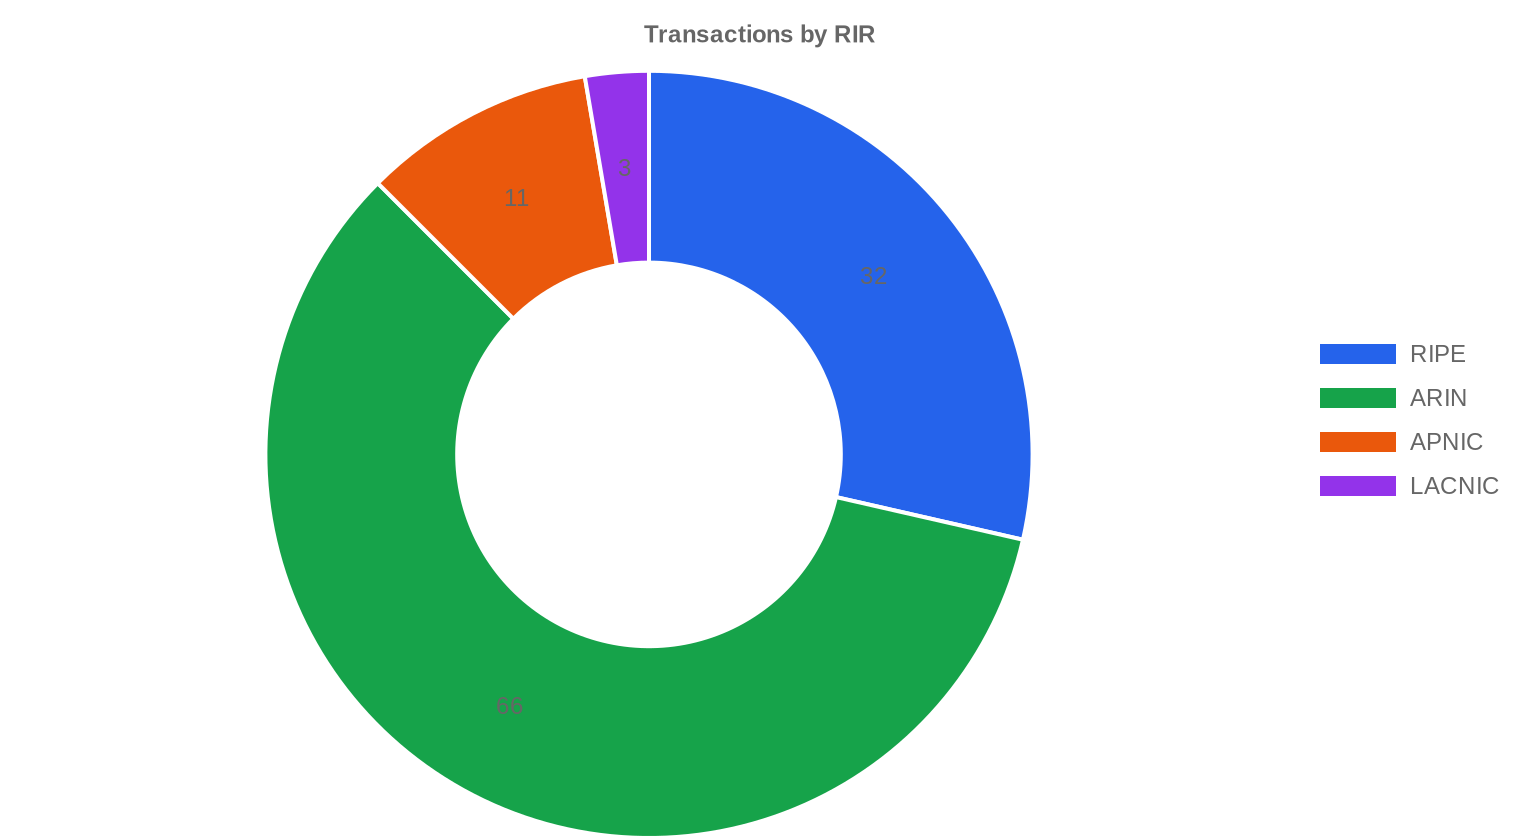
RIPE held the pricing crown this quarter at $45.29 per IP average across 32 transactions, a $2.28 premium over ARIN's $43.01. That gap is meaningful but not wide enough to trigger serious cross-registry arbitrage — transfer friction and policy differences eat most of it. ARIN dominated deal flow with 66 transactions (58.9% of volume), though RIPE moved more raw IPs thanks to several larger blocks totaling 370,944 addresses.RIPE NCC: $45.29 per IP across 32 transactions (60.8% of IP volume).
ARIN: $43.01 per IP across 66 transactions (37.7% of IP volume).
APNIC: $42.73 per IP across 11 transactions (0.6% of IP volume).
LACNIC: $40.67 per IP across 3 transactions (0.9% of IP volume).
AFRINIC: No priced transactions recorded in Q1 2023.
| RIR | Transactions | Avg $/IP | Median $/IP | IPs Traded | RIR Transfers | Next Month (proj.) | Year-End (proj.) |
|---|---|---|---|---|---|---|---|
| RIPE | 32 | $45.29 | $45.50 | 370,944 | 1,299 | $44.00 | $46.00 |
| ARIN | 66 | $43.01 | $42.00 | 229,632 | 598 | $41.00 | $42.00 |
| APNIC | 11 | $42.73 | $43.00 | 3,840 | 0 | $42.00 | $43.00 |
| LACNIC | 3 | $40.67 | $42.00 | 5,376 | 0 | $41.00 | $42.00 |
Transaction Volume

Supply & Block Sizes
/24 blocks dominated with 48 transactions — 42.9% of all deals. This is the retail bread-and-butter of the IPv4 market: small enterprises and hosting companies picking up the minimum routable unit. The concentration at /24 reflects both demand composition (many buyers need just 256 IPs) and supply fragmentation as legacy holders break up larger allocations to maximize per-IP revenue.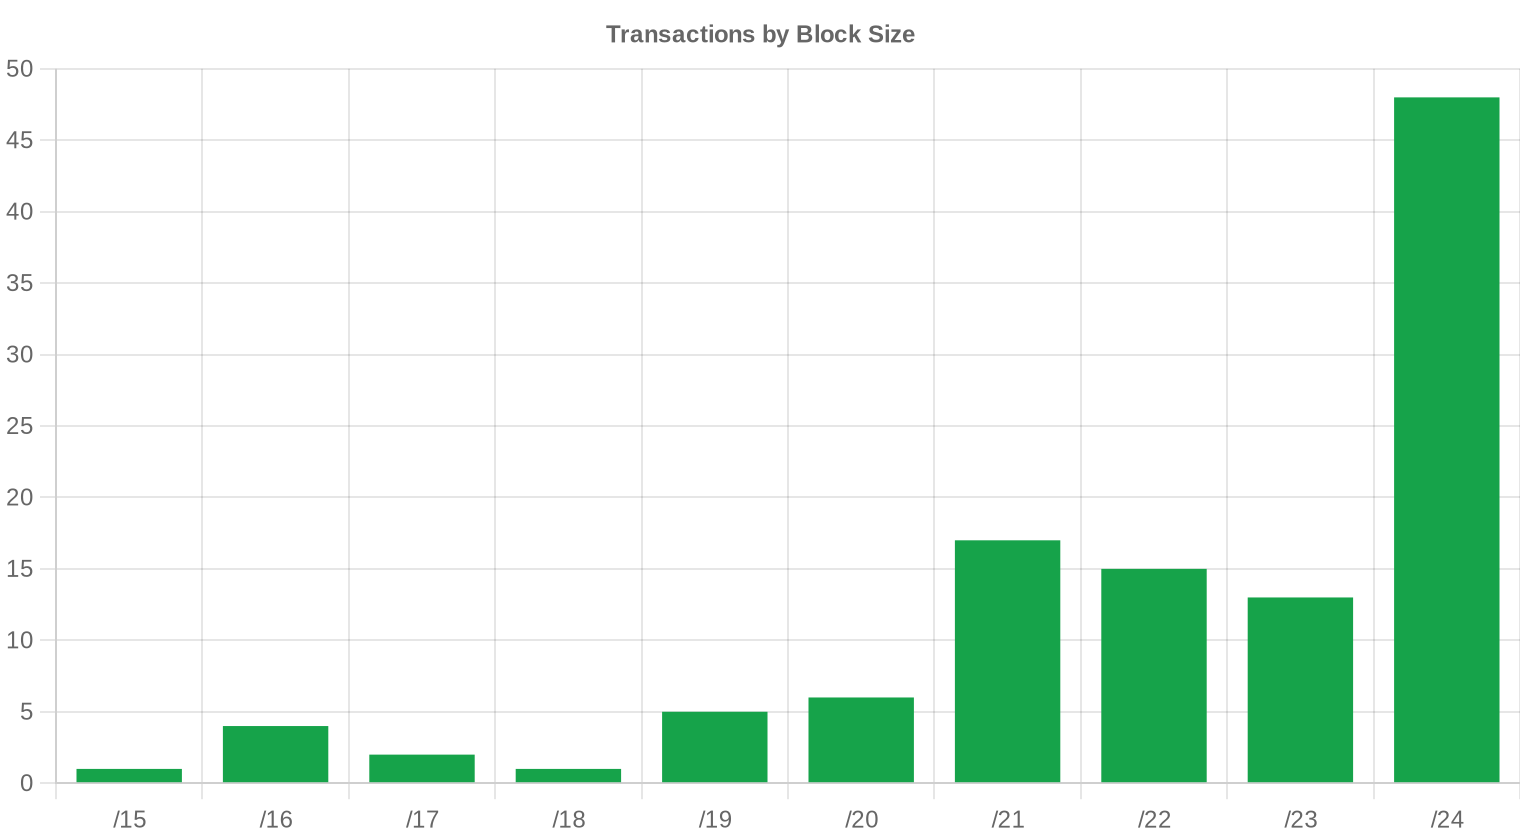
Geographic Activity
Country-level transaction data is not available for Q1 2023. Based on RIR distribution, the transatlantic corridor between North America (ARIN, 58.9% of deals) and Europe (RIPE, 28.6%) continues to account for the vast majority of market activity. APNIC's 11 transactions reflect steady but comparatively thin Asia-Pacific deal flow.Registry Transfer Activity
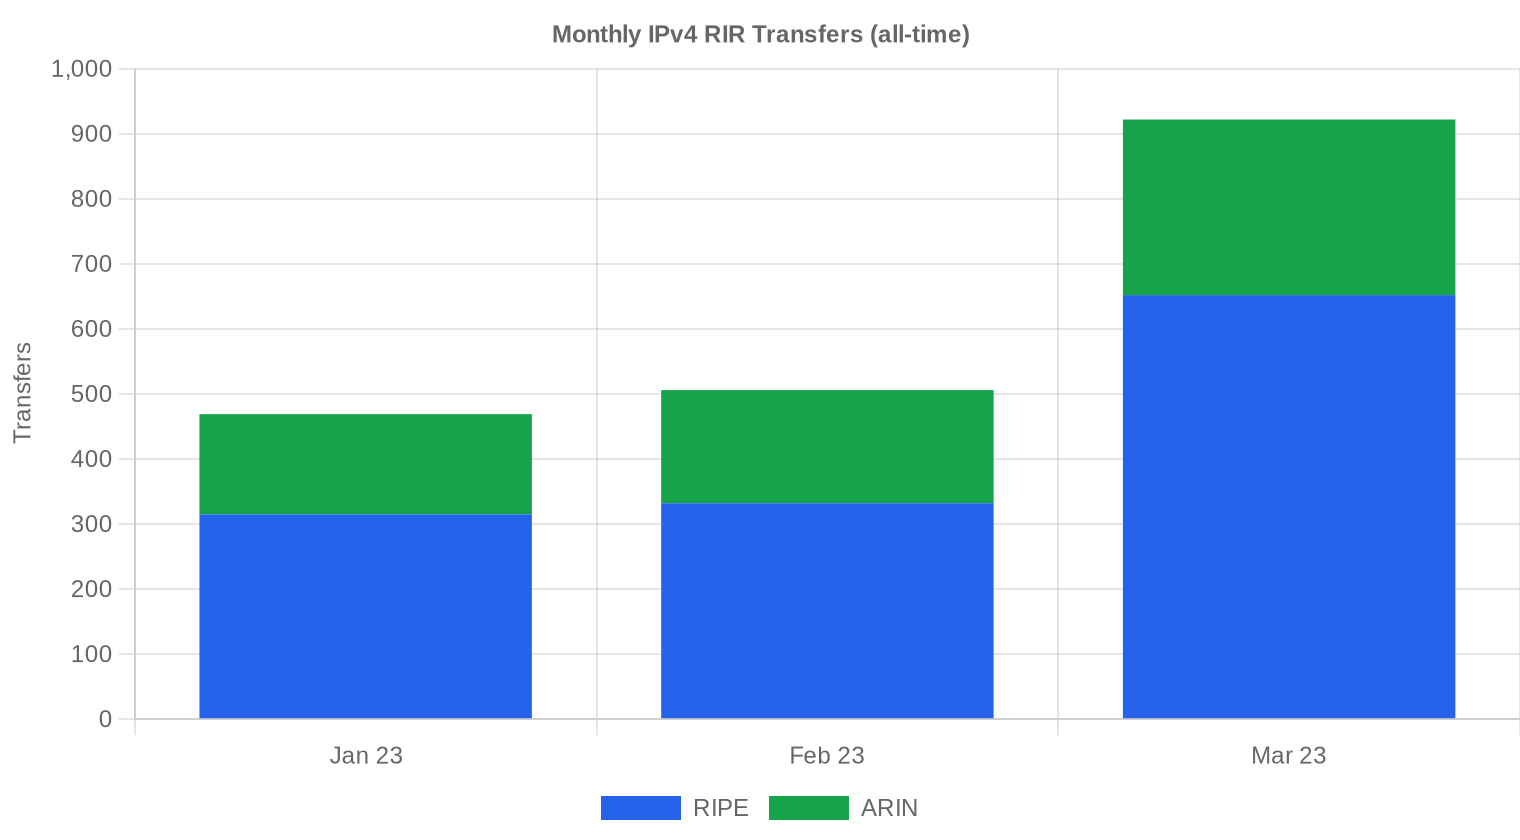
A total of 1,897 inter-RIR and intra-RIR transfers were recorded across registries during Q1 2023. RIPE led with 68.5% of all transfer activity (1,299 transfers), dwarfing ARIN's 598 transfers at 31.5%. The gap between RIPE's transfer count and its transaction count in our pricing dataset underscores how many transfers occur without public price disclosure — or involve intra-organizational moves that don't represent arm's-length sales.Long-Run Transfer Trends
March 2023 was the peak transfer month in Q1, consistent with the typical end-of-quarter push as buyers close deals before budget resets. The 1,897 total transfers across the three-month window represent a healthy clip of registry activity. RIPE's dominance in raw transfer volume — nearly 7 out of every 10 transfers — reflects both the depth of the European market and the relative ease of RIPE's inter-LIR transfer process compared to ARIN's needs-based justification requirements.| RIR | RIR Transfers |
|---|---|
| RIPE | 1,299 |
| ARIN | 598 |
| RIR Transfers | 1,897 |
Outlook & Forecast
Forecasting each block-size band and RIR separately with our AI model:
The overall average price per IP is projected to reach $43.48 by December 2023, with a next-month estimate of $42.23 per IP.
- RIPE: projected at $44.00 per IP next month, trending toward $46.00 by December 2023.
- ARIN: projected at $41.00 per IP next month, trending toward $42.00 by December 2023.
- APNIC: projected at $42.00 per IP next month, trending toward $43.00 by December 2023.
- LACNIC: projected at $41.00 per IP next month, trending toward $42.00 by December 2023.
- AFRINIC: insufficient data for a reliable forecast.
Forecast by Block Size
| Block | Current $/IP | Next Month | Year-End | Confidence |
|---|---|---|---|---|
| /24 | $42.00 | $42.00 (0.0%) | $43.00 (+2.4%) | medium |
| /23 | $45.00 | $45.00 (0.0%) | $46.00 (+2.2%) | low |
| /22 | $39.00 | $40.00 (+2.6%) | $42.00 (+7.7%) | low |
| /21 | $40.00 | $40.00 (0.0%) | $41.00 (+2.5%) | low |
| /20 | $40.00 | $40.00 (0.0%) | $42.00 (+5.0%) | low |
| /19 | $47.00 | $46.00 (-2.1%) | $47.00 (0.0%) | low |
| /18-/16 | $51.50 | $50.00 (-2.9%) | $52.00 (+1.0%) | low |
| /15-up | $51.50 | $50.00 (-2.9%) | $53.00 (+2.9%) | low |
Editor's Take: Buy vs. Lease
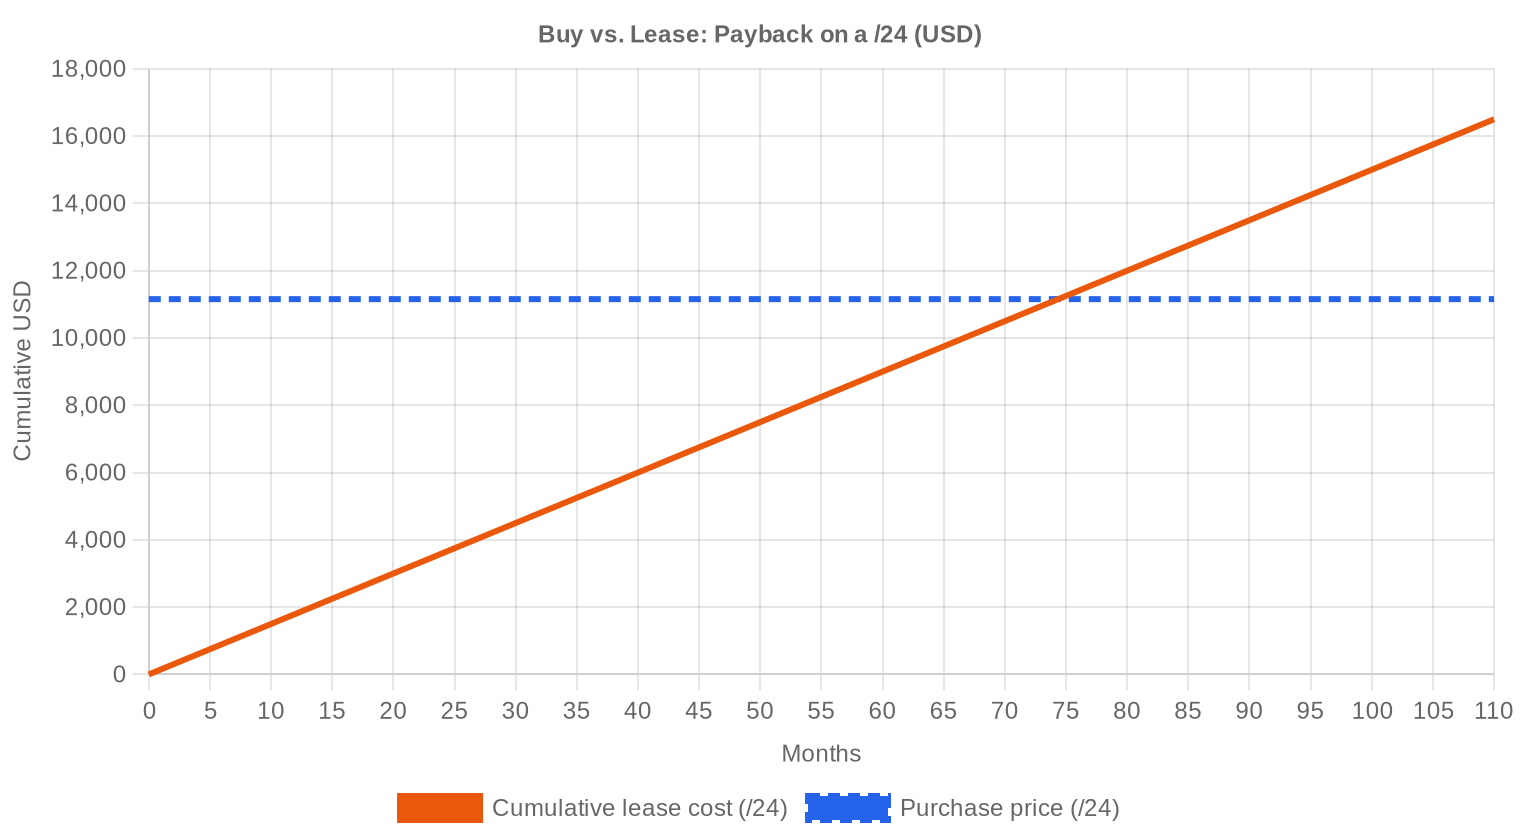
The buy-versus-lease math tilts decisively toward buying at current levels. At $0.59 per IP per month on lease versus $43.57 to purchase outright, the breakeven lands at 74.4 months — just over 6.2 years. Any organization expecting to need IPv4 space beyond that horizon should be buying. The implied annual yield for lessors sits at 16.1%, which is exceptional by any fixed-income standard and explains why institutional capital continues to flow into IPv4 portfolios. For lessees, the $150/month per /24 rate makes sense only as a bridge — you're renting an asset that depreciates your cash flow without building equity. If your planning horizon extends past 2029, the purchase option is the clear winner at today's prices.| /24 Purchase price | $11,154 |
| /24 Lease price | $150 / mo |
| Payback period | 74.4 mo (6.2 yr) |
| Gross annual yield | 16.1% |
What This Means for You
Buyers eyeing ARIN-region space should act while the $43.01 average holds — RIPE pricing at $45.29 suggests where ARIN could drift if supply tightens. Consider a buy IPv4 transaction now rather than waiting for Q2, which our model projects will see a brief dip to $42.23 before reverting. Sellers holding clean blocks should note the RIPE premium: if you can transfer within the RIPE service region, you're looking at a $2+ per IP advantage. List your inventory through sell IPv4 to capture that spread. For those not ready to commit capital, the lease IPv4 market offers flexibility at $0.59/IP/month — useful for short-term projects or while evaluating longer-term needs. Holders sitting on underutilized space can generate 16.1% annualized yield by listing through lease out IPv4.IPv4 Pricing by Block Size
The /24 market — 256 addresses — remains the most liquid segment, accounting for 48 of 112 transactions. Per-IP premiums at /24 are structurally higher than bulk pricing on /20 or /16 blocks because buyers pay for the convenience of a single routable unit without the capital outlay of a larger allocation. The seven deals exceeding $1 million (totaling $20.0 million) demonstrate that large-block transactions still dominate by dollar value, even as small-block deals dominate by count.| Block | IPs | Buy: /IP | Buy: Total | Lease: /IP/mo | Lease: Monthly |
|---|---|---|---|---|---|
| /24 | 256 | $35–45 | $8,960–11,520 | $0.38–0.50 | $97–128 |
| /22 | 1,024 | $28–38 | $28,672–38,912 | $0.33–0.45 | $338–461 |
| /20 | 4,096 | $22–32 | $90,112–131,072 | $0.30–0.40 | $1,229–1,638 |
| /18 | 16,384 | $20–30 | $327,680–491,520 | $0.30–0.38 | $4,915–6,226 |
| /16 | 65,536 | $18–28 | $1,179,648–1,835,008 | $0.30–0.35 | $19,661–22,938 |
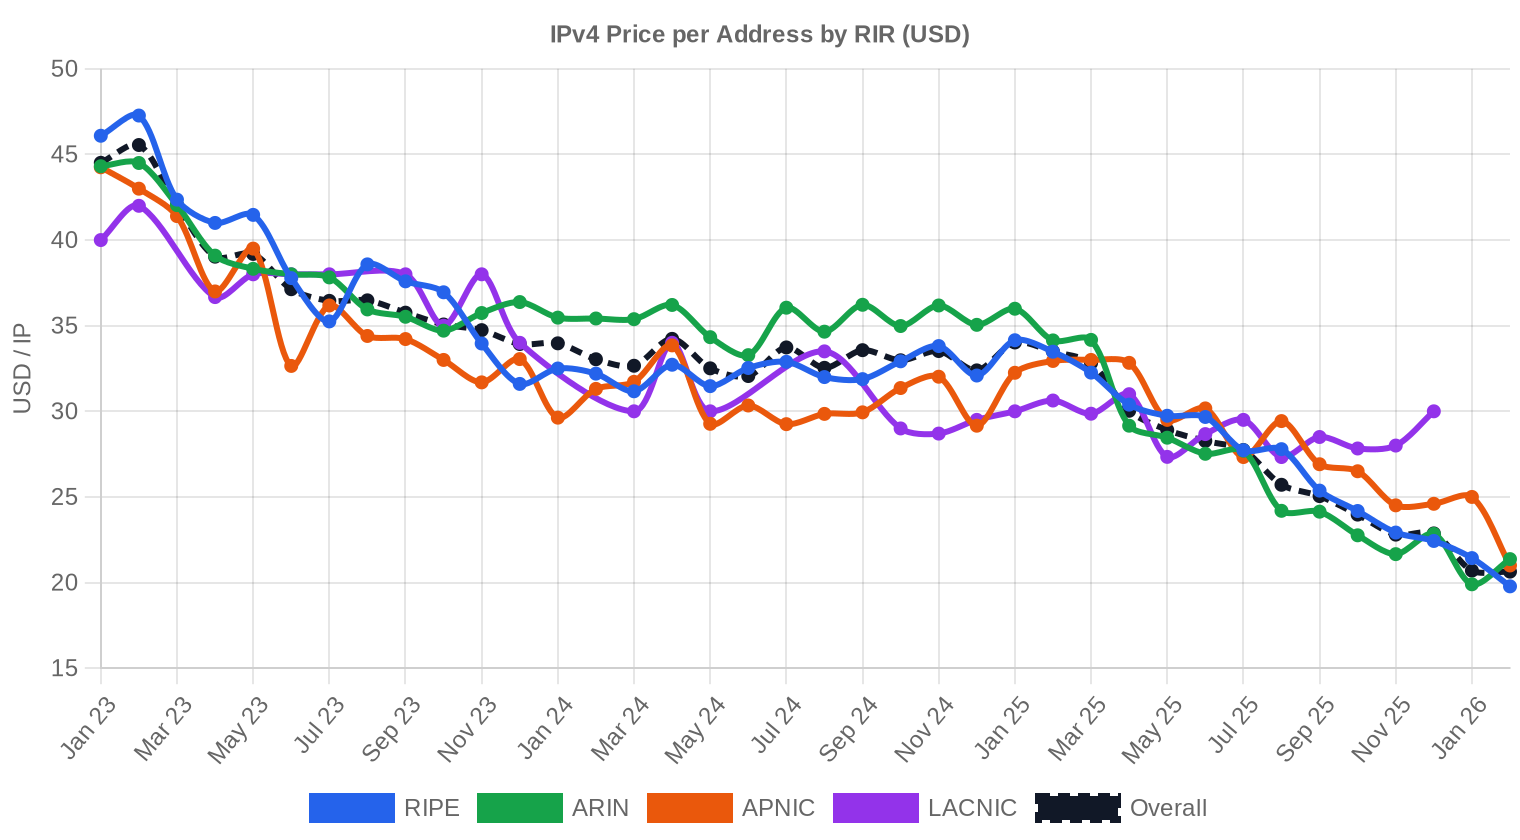
IPv4 Price History: 2011–2026
IPv4 addresses traded near zero before IANA pool exhaustion in February 2011. Prices climbed steadily through the mid-2010s, reaching the mid-$20s by 2019 and accelerating past $50 at peak in 2021-2022. The current $43.57 average represents a retreat from those highs, driven partly by AWS's February 2024 public IP charge announcement pulling forward some demand and partly by macro budget tightening. The market appears to have found a new equilibrium band in the low-to-mid $40s after the speculative froth of 2021-2022 burned off.| Year | ~Price/IP | Key Event |
|---|---|---|
| 2011 | $7–12 | IANA free pool exhausted; Microsoft/Nortel deal ($11.25/IP) |
| 2012 | $8–12 | RIPE NCC reaches last /8; begins /22-only allocation |
| 2014 | $10–15 | LACNIC free pool exhausted |
| 2015 | $8–15 | ARIN free pool exhausted |
| 2017–18 | $12–18 | Leasing market grows; cloud demand rises |
| 2019 | $18–24 | RIPE NCC exhausts remaining free pool |
| 2021–22 | $50–60+ | Post-pandemic peak; hyperscaler build-outs |
| 2024 | $35–52 | AWS IPv4 charge ($0.005/IP/hr); large block correction |
| 2025–26 | $18–45 | Market bifurcation; /16s below $20 for first time since 2019 |
Market Structure: Who Is Buying & Selling
Buyers this quarter skew toward mid-market ISPs and hosting providers picking up /24 blocks, plus a handful of larger transactions from cloud infrastructure operators backfilling capacity. The sell side remains dominated by legacy holders — corporations, universities, and government entities sitting on allocations from the 1990s that far exceed their operational needs. A few bankruptcy-driven liquidations continue to surface blocks at the lower end of the price range.IPv4 vs. Other Asset Classes
At a 16.1% implied annual yield on leased-out IPv4 space, the asset class crushes investment-grade bonds (5-6%), competes favorably with leveraged real estate (8-12%), and approaches venture-style equity returns without the binary risk. The key caveat is liquidity — selling a /16 block takes weeks, not seconds. But for patient capital seeking yield on a finite, non-reproducible digital asset, IPv4 remains one of the more attractive corners of alternative investments.| Asset Class | Typical Yield | Liquidity | Primary Risk |
|---|---|---|---|
| IPv4 | 16.1% | Moderate | IPv6 adoption, block quality |
| Commercial Real Estate | 5–8% | Low | Vacancy, rate cycle |
| Investment-Grade Bonds | 4–5% | High | Duration, credit risk |
| S&P 500 | ~1,3% | High | Market volatility |
| Money Market / T-Bills | ~4–5% | High | Rate cycle changes |
IPv6 Adoption & Why IPv4 Remains Essential
IPv6 deployment continues to expand at the eyeball-network level, with Google reporting roughly 40% of traffic arriving over IPv6 by early 2023. The enterprise and infrastructure side tells a different story — the vast majority of B2B connectivity, hosting, and legacy application stacks still require IPv4. Dual-stack will remain the operational reality for at least another decade, which means IPv4 exhaustion economics persist regardless of IPv6 progress.AI & Cloud Infrastructure Demand
The AI infrastructure buildout is beginning to register in IPv4 demand patterns. GPU training clusters and inference endpoints require public-facing addresses for API access, model serving, and data ingestion pipelines. While the direct volume impact is still small relative to traditional hosting and ISP demand, the trajectory is clear — every new AI-as-a-service deployment adds incremental pressure to an already exhausted pool.What Determines IPv4 Block Value
Block valuation depends on several concrete factors beyond raw size. Blacklist status is the single largest discount driver — a block appearing on Spamhaus or similar databases can trade 15-25% below clean equivalents. Allocation age, RIR region, and historical usage patterns also matter; RIPE blocks command premiums for transferability, while very old ARIN legacy blocks sometimes carry title ambiguity that spooks institutional buyers.Sell vs. Lease: A Decision Framework
In the current environment, holders with a 5+ year outlook should lean toward leasing at 16.1% annualized yield rather than selling at $43.57 per IP — you'll recoup the sale price in just over six years while retaining the asset. Selling makes sense if you need capital now, if block cleanliness is degrading, or if you believe prices will decline materially from here. Our year-end forecast of $43.48 suggests no near-term price catalyst for sellers to rush.| /24 Purchase price | $11,154 |
| /24 Lease price | $150 / mo |
| Payback period | 74.4 mo (6.2 yr) |
| Gross annual yield | 16.1% |
RIPE NCC 24-Month Transfer Restriction
RIPE NCC's 24-month holding requirement before a block can be transferred again acts as a supply brake on the European market. It discourages speculative flipping and creates a natural supply constraint that partially explains the $2.28 per-IP premium RIPE commands over ARIN. Buyers of RIPE blocks should factor this lock-up into their planning — the address space is usable immediately, but not re-sellable for two years.Deal Size Distribution
The average deal size landed at $266,475, but the distribution is heavily bimodal. Seventy-six transactions (67.9%) fell under $50K — the /24 retail market — while just 7 deals above $1M accounted for $20.0 million, or 66.9% of total market value. The middle tiers ($50K-$250K at 23 deals, $250K-$1M at 6 deals) are relatively thin, confirming the barbell shape of IPv4 demand: lots of small buyers, a few very large ones, and not much in between.Top Trading Countries
Country-level granularity is unavailable for Q1 2023 transactions. RIR-based proxies suggest the United States and Western Europe (Germany, Netherlands, UK) remain the primary trading hubs. APNIC's 11 deals likely concentrate in Australia, Singapore, and Japan — the Asia-Pacific markets with the most active secondary trading infrastructure.BEAD Broadband Program Impact
The $42.5 billion BEAD broadband program is still in its planning and allocation phase as of Q1 2023, with state-level grants not yet flowing to ISP recipients. When disbursements begin, expect a meaningful demand spike for /20 to /22 blocks as rural ISPs and fixed wireless providers build out subscriber networks. This program alone could absorb several million addresses over the next 3-5 years, tightening mid-size block supply considerably.Hyperscaler IPv4 Holdings
Amazon, Microsoft, and Google collectively hold tens of millions of IPv4 addresses — Amazon alone controls an estimated 100+ million through acquisitions over the past decade. These holdings are strategic reserves, not trading inventory; none of the hyperscalers are net sellers. AWS's decision to charge $0.005/hour for public IPv4 addresses (effective February 2024, announced mid-2023) will reshape demand patterns by forcing customers to rationalize their address usage, potentially freeing up some supply at the margin while reinforcing the scarcity premium for owned blocks.Macroeconomic Conditions & Market Impact
Central banks maintained elevated interest rates through Q1 2023, compressing enterprise IT budgets and pushing some buyers to lease rather than purchase. The effect shows up in transaction count rather than price — 112 deals is a reasonable quarter, but the average deal size of $266K suggests mid-market dominance rather than headline-grabbing mega-deals. If rate cuts materialize in late 2023 or 2024, expect pent-up demand from budget-constrained buyers to release.Methodology
Figures are based on completed IPv4Center marketplace transactions and RIR transfer statistics. Prices are in US dollars per IP address. Forecasts are produced by an AI model that analyses each block-size band and RIR segment separately (with outlier-trimmed medians) alongside known market catalysts; they are estimates, not guarantees.
Source: IPv4Center.com market data and RIR transfer statistics.
This report is generated automatically for informational purposes only and does not constitute financial advice.
Frequently Asked Questions
What was the average price per IPv4 address in Q1 2023?
The market-wide average landed at .57 per address, with a median of .20. The spread between the two is narrow, suggesting a reasonably efficient price-discovery process across the 112 transactions recorded this quarter.
How wide was the pricing range across deals in Q1 2023?
Prices ranged from at the floor to at the ceiling — a spread, or roughly 41% of the average. That dispersion reflects block-size premiums, RIR jurisdiction, and buyer urgency more than any fundamental disagreement on value.
Which RIR commanded the highest per-IP prices this quarter?
RIPE NCC blocks fetched a premium, averaging .29 per IP versus ARIN's .01 and APNIC's .73. RIPE's median of .50 was the highest across all registries. European address space continues to trade at a structural premium driven by tighter supply and regulatory familiarity among EU-based buyers.
ARIN accounted for most transactions — what does that mean for liquidity?
ARIN represented 58.9% of all transactions (66 of 112), making it the most liquid marketplace by deal count. However, RIPE dominated by total IPs transferred — 370,944 addresses versus ARIN's 229,632 — indicating that RIPE deals skewed larger on average.
Why did RIPE blocks account for more total IPs than ARIN despite fewer transactions?
RIPE logged only 32 priced transactions but moved 370,944 addresses, implying an average deal size north of 11,500 IPs. ARIN's 66 deals moved 229,632 addresses — roughly 3,479 per deal. Institutional European buyers tend to consolidate demand into fewer, larger acquisitions.
How active was the APNIC market in Q1 2023?
Modest at best. APNIC recorded 11 transactions covering just 3,840 addresses at an average of .73 per IP. Total value was 3,840 — a rounding error relative to the quarter's .8 million in aggregate volume. Asia-Pacific supply remains constrained.
Were there any AFRINIC transfers this quarter?
Zero. AFRINIC recorded no priced transactions and no registered transfers in Q1 2023. The registry's ongoing governance challenges and transfer-policy ambiguity continue to render its address space effectively illiquid.
What was the total dollar volume of the IPv4 market in Q1 2023?
Approximately .85 million across 112 priced transactions and 609,792 addresses. The seven deals exceeding million accounted for .99 million — fully 67% of total value — underscoring the market's concentration at the top end.
What was the most common block size traded?
The /24 block (256 addresses) was the most frequently transacted prefix, appearing in 48 of 112 deals — 43% of all transactions. This is consistent with the /24 being the smallest universally routable block and the entry point for most buyers.
How did deal sizes break down by value band?
Seventy-six deals (68%) were sub-K, totaling .49 million. Twenty-three deals fell in the K–0K range at .59 million. Six deals hit 0K–M for .50 million. And seven blockbuster deals above M generated .99 million. The long tail is small; the head is heavy.
What is the current cost of leasing versus buying IPv4 space?
Leasing runs approximately .59 per IP per month, or about 0 per /24 per month. Buying a /24 outright costs roughly ,154 at the current average. The buy-versus-lease breakeven sits at 74.4 months — just over 6.2 years — after which ownership is the cheaper path.
Should operators buy or lease IPv4 addresses at current Q1 2023 prices?
For operators with a planning horizon beyond 6.2 years, buying is the rational choice. At an implied annual yield of 16.1% for lessors, the economics favor ownership for long-term holders. Leasing makes sense only for short-term projects or organizations uncertain about future address needs.
What mistakes should buyers avoid in the current market?
Three common errors: overpaying for small blocks without benchmarking the .57 average; neglecting RIR-specific transfer timelines (ARIN and RIPE have materially different approval processes); and failing to verify block cleanliness — blacklisted or spam-tainted space can trade at the same headline price but carry hidden remediation costs.
What are the risks of buying IPv4 addresses at + per IP?
The primary risk is secular demand erosion from IPv6 adoption, though the timeline remains measured in years, not quarters. A secondary risk is regulatory — RIRs could tighten transfer policies. At .57, you're paying near the top of the historical range, so any demand shock would compress valuations before sellers adjust.
What are the dangers of relying exclusively on leased IPv4 space?
Leasing exposes operators to repricing risk and supply withdrawal. At .59/IP/month, the annualized cost is .03 per address — a 16.1% implied yield for the lessor. If market lease rates rise even modestly, long-term lessees face compounding cost escalation with no asset to show for it.
What risks do sellers face if they wait to liquidate IPv4 holdings?
The trend indicator points upward with a modest 0.53% gain, and the year-end forecast is .48 — essentially flat. Sellers sitting on inventory hoping for a spike may find that the market has plateaued. Meanwhile, carrying costs and the slow march of IPv6 deployment erode the option value of waiting.
How many total inter-RIR and intra-RIR transfers were recorded in Q1 2023?
A total of 1,897 transfers were registered across all RIRs during the quarter. RIPE accounted for 68.5% of transfer volume (1,299 transfers), with ARIN at 31.5% (598 transfers). APNIC, LACNIC, and AFRINIC recorded zero registered transfers.
What does the Q1 2023 price forecast suggest for the rest of the year?
Our model projects a near-term price of .23 per IP, with a year-end 2023 target of .48. The forecast is flagged as reliable. In practical terms, this implies a flat-to-marginally-softer market through mid-year before stabilizing near current levels by December.
Is the IPv4 market trending up or down as of Q1 2023?
The quarter registers an upward trend with a 0.53% price gain. That's positive but hardly exuberant — more of a plateau than a rally. The market appears to be in a consolidation phase after the aggressive price appreciation seen in prior years.
Why is LACNIC activity so thin?
LACNIC recorded just 3 transactions totaling 5,376 addresses at an average of .67 per IP — the lowest regional average this quarter. Latin American transfer volumes have historically been suppressed by more restrictive transfer policies and a smaller installed base of monetizable legacy holdings.
How does the /24 premium work in practice?
A /24 (256 IPs) at the Q1 average costs ,154. Smaller allocations below /24 are not globally routable and thus functionally worthless for independent use. This creates a hard floor on minimum viable purchase size and gives /24 blocks a liquidity premium relative to their per-IP cost in larger aggregates.
Will IPv6 adoption make IPv4 addresses worthless?
Not in any actionable timeframe. IPv6 has been 'imminent' for over a decade. Meanwhile, .85 million traded hands this quarter alone, and the year-end forecast is essentially flat at .48. The market is pricing in a very gradual transition, not a cliff. IPv4 addresses remain a productive asset for the foreseeable future.
What does the 16.1% implied annual yield on leased IPv4 tell us?
It tells us that IPv4 is an unusually high-yielding infrastructure asset. At .57 per IP purchased and .03 per IP in annual lease revenue, the unlevered yield of 16.1% handily beats most fixed-income alternatives. That yield is attracting financial buyers into the market, which in turn supports pricing.
How concentrated is market value among large deals?
Extremely. Seven transactions above million generated .99 million — 67% of the quarter's .85 million total. The remaining 105 deals split the other .86 million. This is a market where a handful of institutional trades set the tone and small-block activity provides price discovery at the margin.
What was the average deal size in Q1 2023 and what does it imply?
The average deal moved roughly 5,445 addresses (609,792 IPs across 112 transactions) at an implied average deal value of 6,475. That figure is skewed upward by the large RIPE transactions. The median deal was almost certainly a small block — recall that 76 deals were under K — so the average overstates the typical buyer's experience.