14 min read
This report analyzes the IPv4 transfer market for First Half 2023, based on completed IPv4Center marketplace transactions and official RIR transfer records.
Executive Summary
The IPv4 transfer market moved 779,520 addresses across 220 transactions in the first half of 2023, generating $36.4 million in total deal value. Average pricing came in at $41.09 per IP with a median of $40 — a market that has begun leaking air after the frothy peaks of prior periods. The overall trend is down, with regression analysis showing a negative trajectory of roughly 5% over the half. ARIN dominated deal flow with 59.5% of transactions, but RIPE commanded the highest per-IP premiums at $42.98 on average. The price floor held at $30/IP while the ceiling touched $53, a $23 spread that reflects meaningful segmentation by block quality, size, and registry.Market Overview
| Transactions | 220 |
| IP Addresses Traded | 779,520 |
| Estimated Market Value | $36,390,182 |
| Average Price / IP | $41.09 |
| Median Price / IP | $40.00 |
| RIR Transfers | 4,282 |
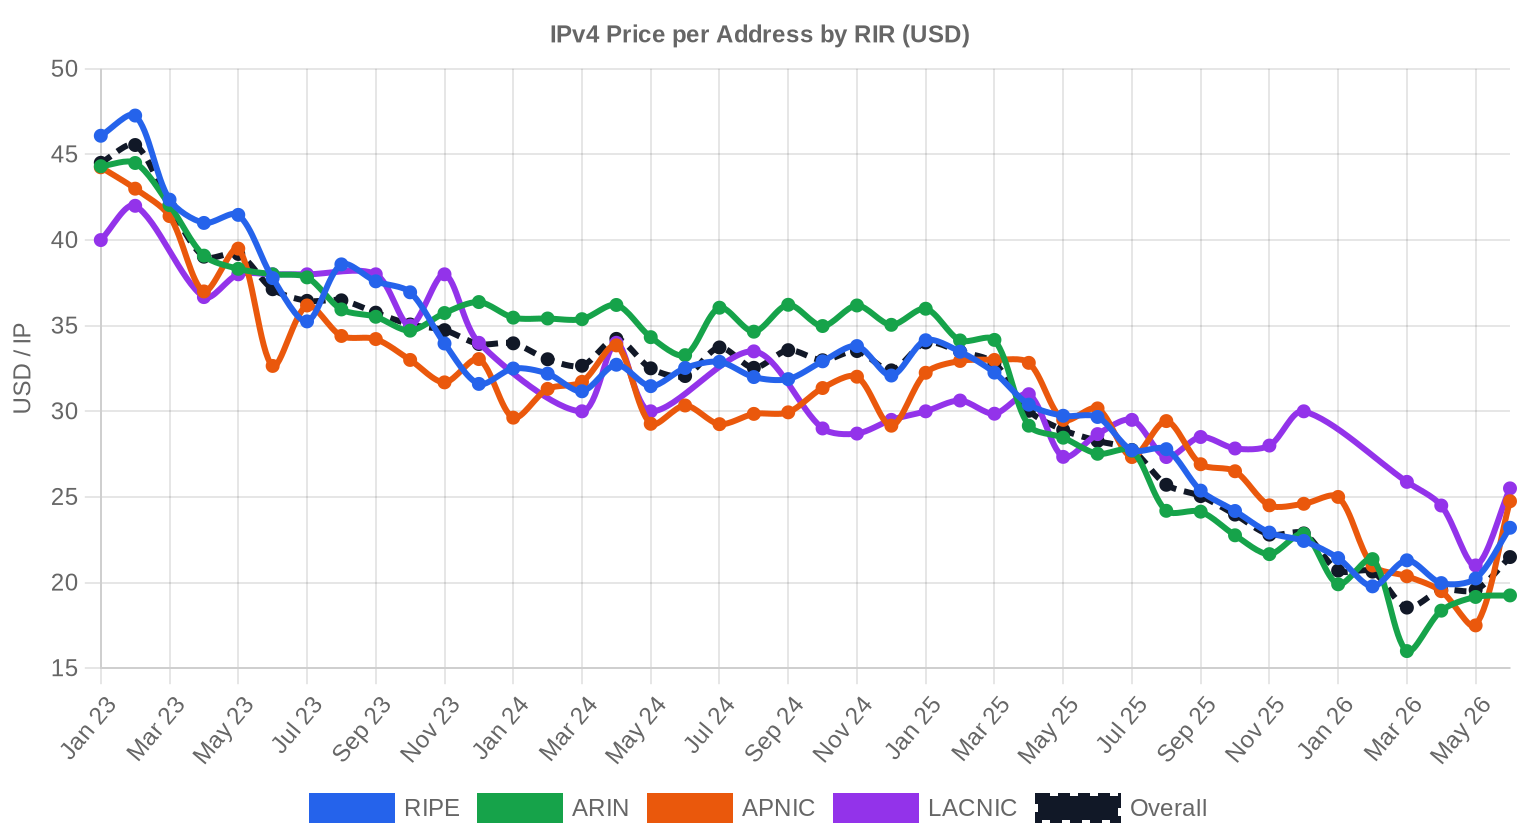
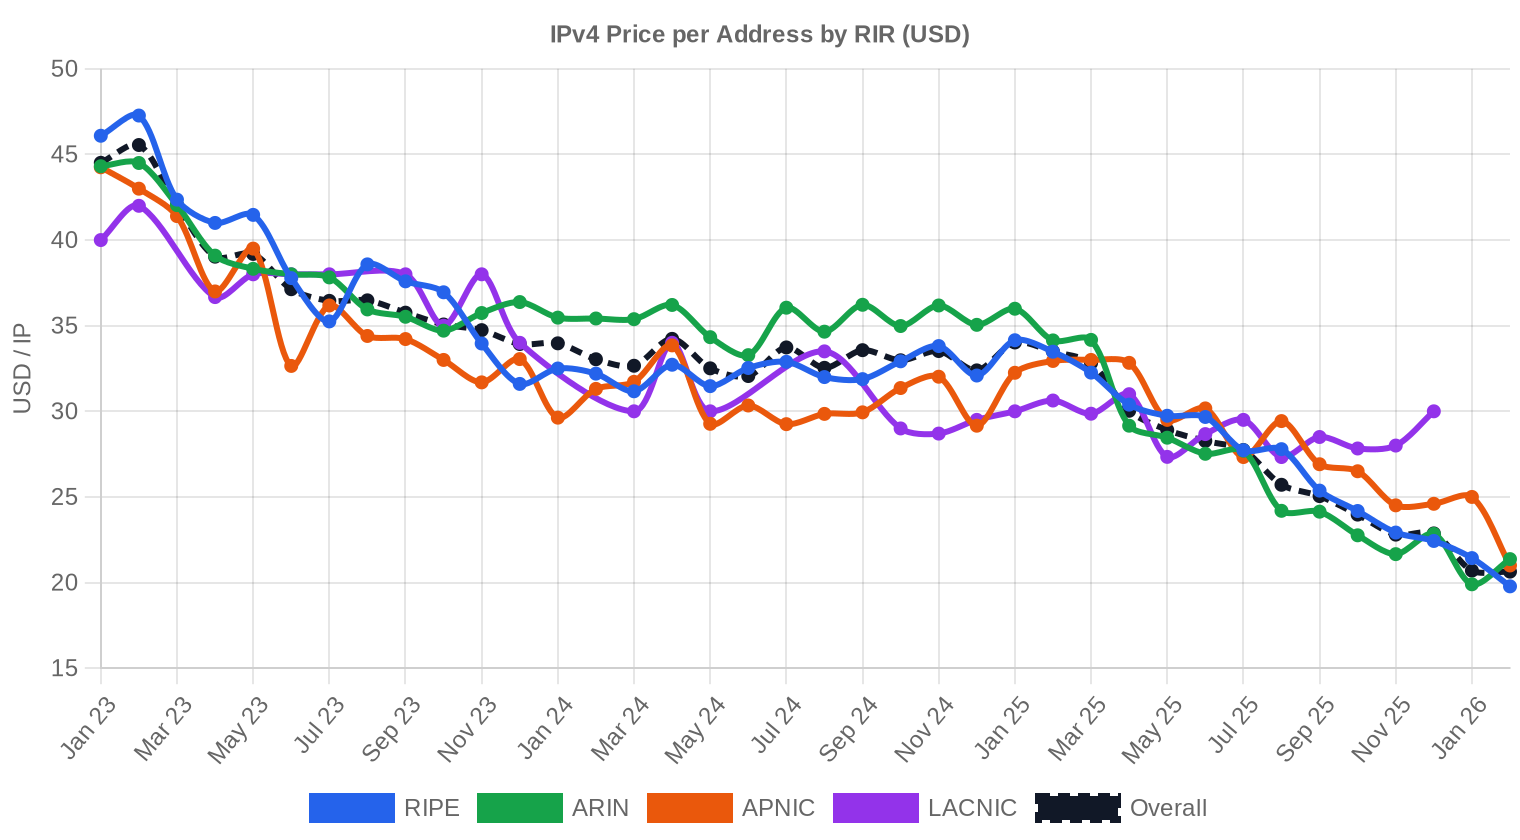
Price Dynamics
Pricing ranged from $30 to $53 per IP during H1 2023, a spread that tells you this market still rewards clean blocks and penalizes anything with baggage. The $41.09 average sits just $1.09 above the $40 median, which signals a reasonably symmetric distribution without heavy outlier distortion — the big-ticket deals aren't pulling the average up the way they did in 2021 and early 2022. The 5% negative trend line is the story here: sellers are meeting buyers lower than they were six months ago, and the handful of transactions clearing above $50 were RIPE and ARIN blocks with specific characteristics (clean reputation, established allocation history, desirable prefix size). The broad direction is downward, and the regression slope suggests this isn't a blip — it's a repricing.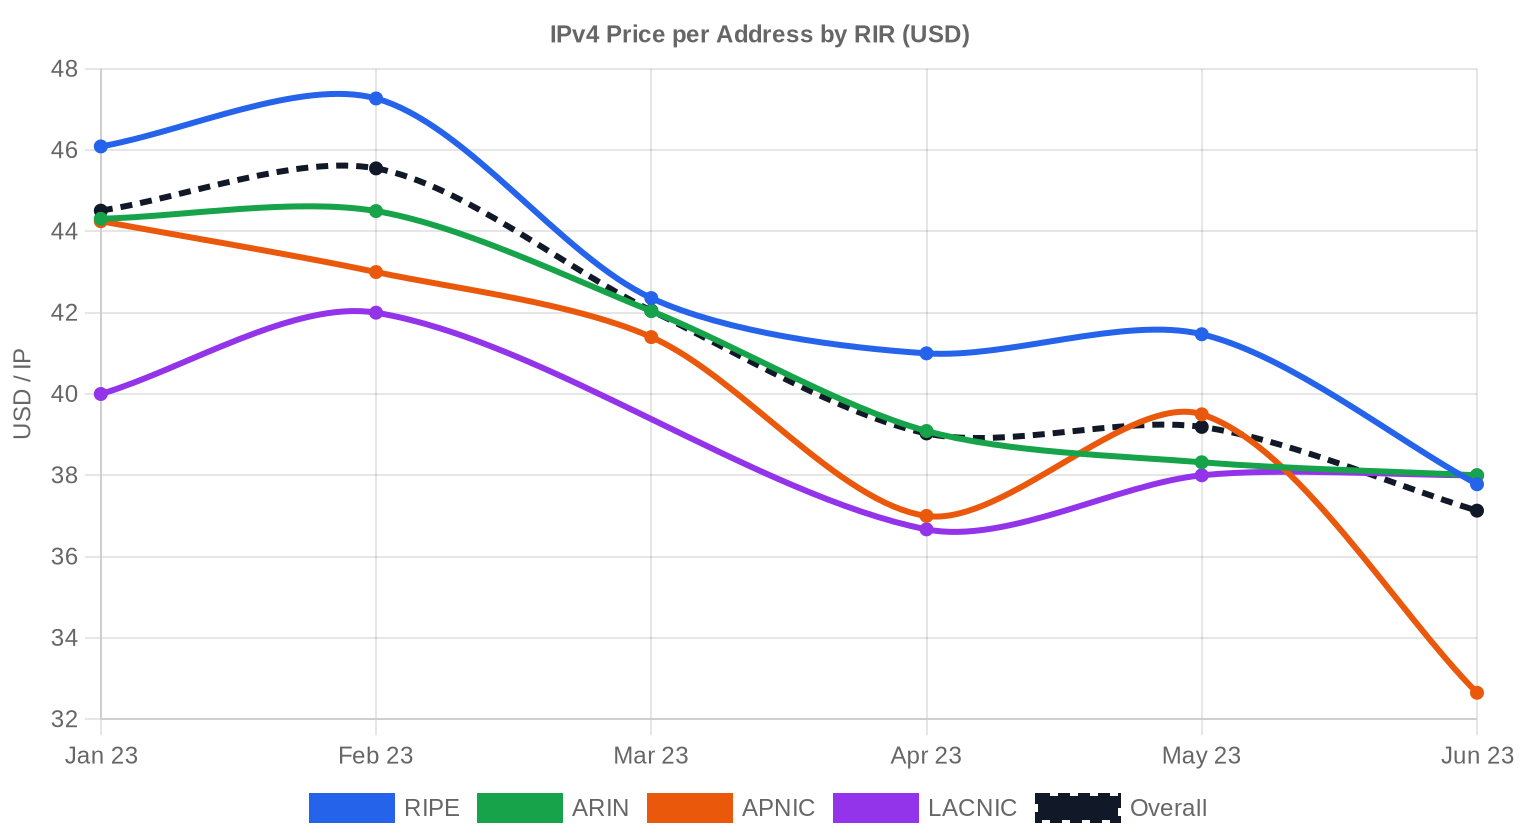
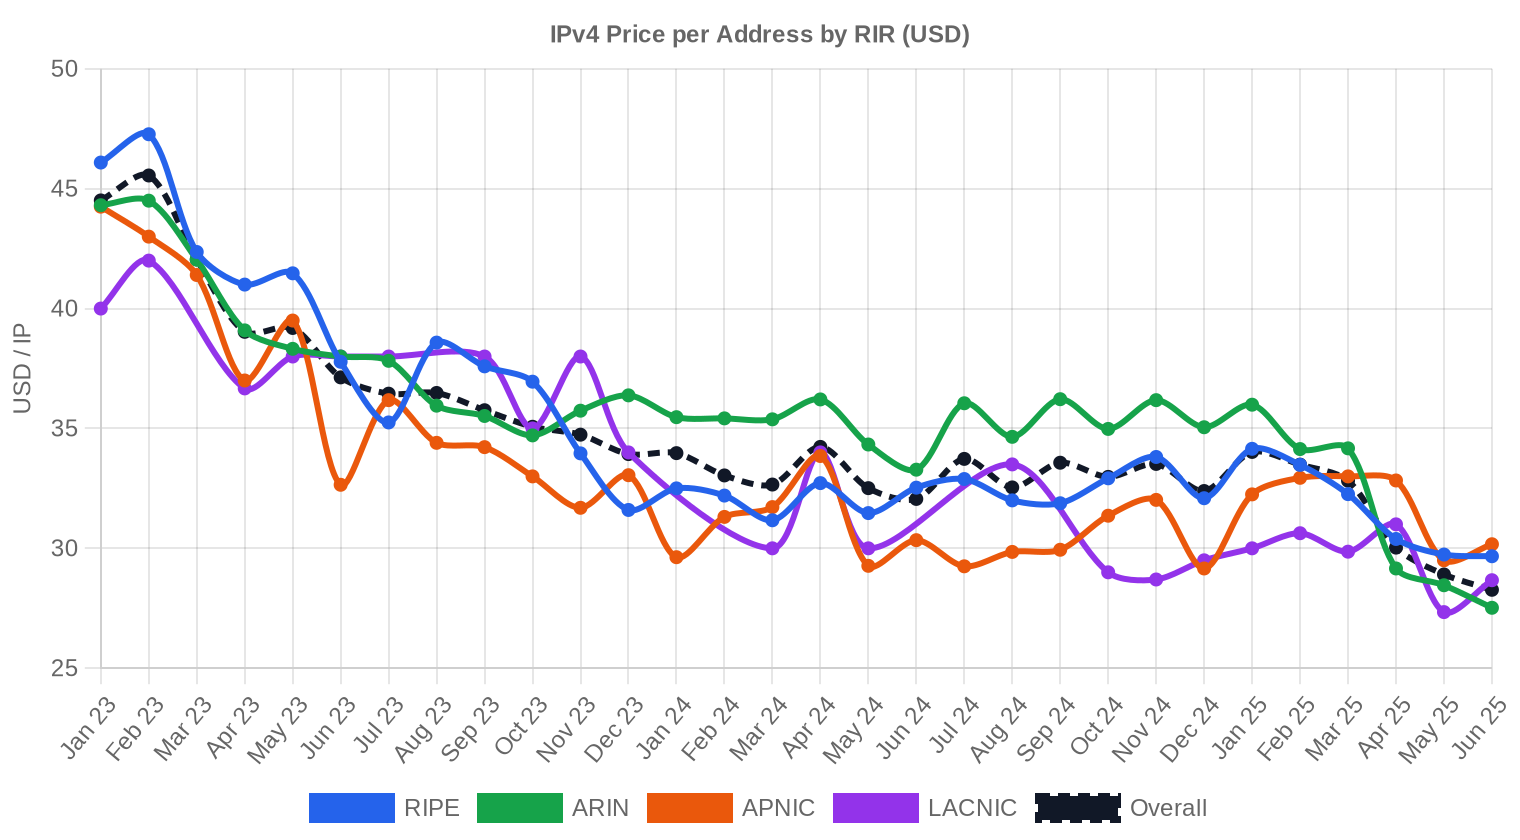
Pricing by RIR
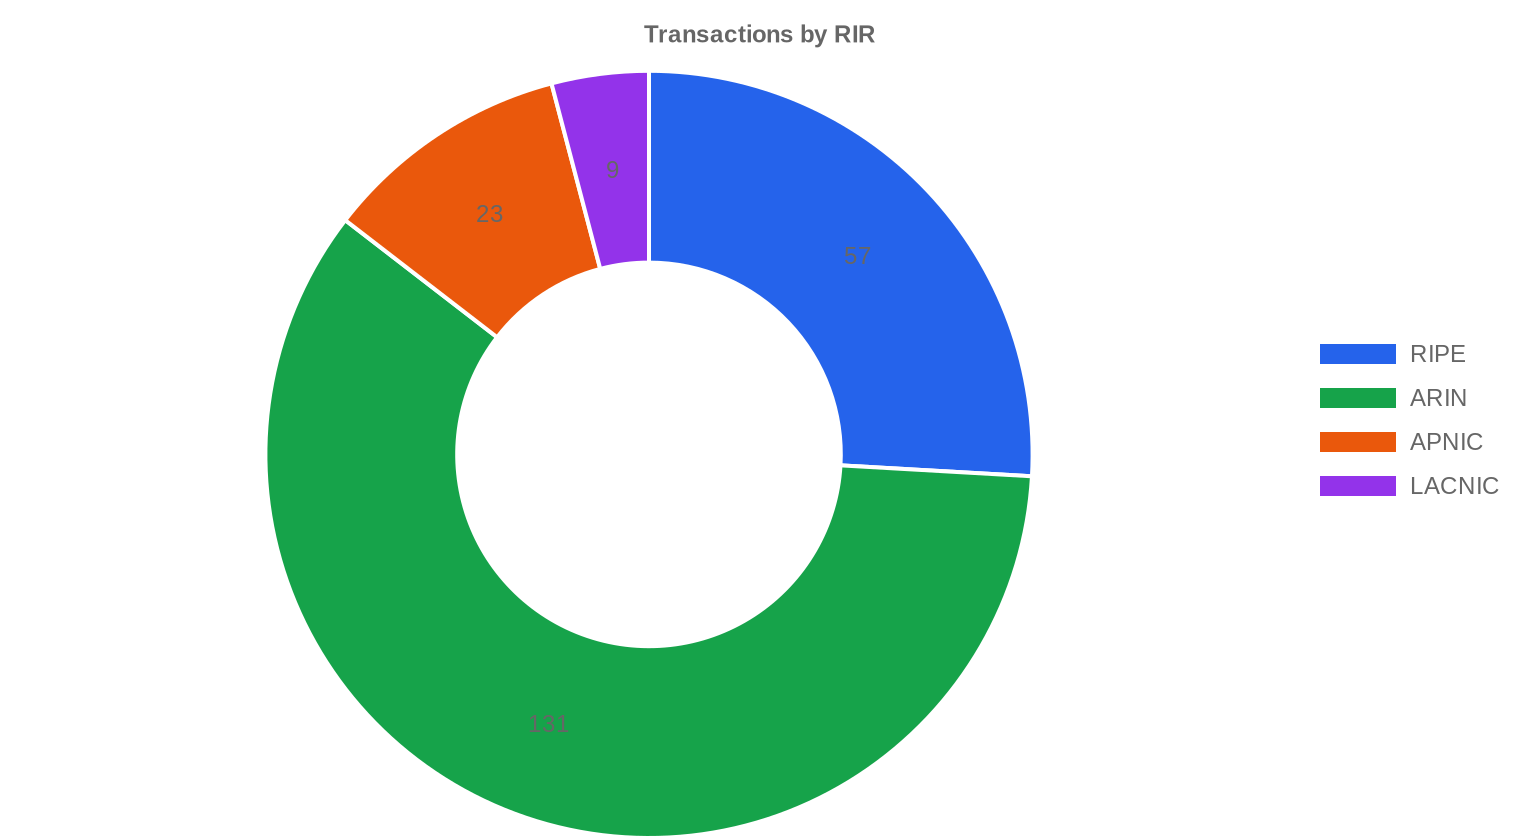
RIPE NCC blocks remain the most expensive addresses on the market, averaging $42.98/IP with a median of $43 across 57 transactions covering 418,816 IPs. That $2.21 premium over ARIN's $40.77 average reflects both the structural demand from European operators and RIPE's 24-month holding rule, which constrains liquid supply. ARIN, as usual, is the volume leader — 131 transactions and 307,968 IPs at a $40 median. APNIC and LACNIC both came in below the global average, with APNIC at $39.23 across 23 deals and LACNIC at $38.44 on just 9 transactions. AFRINIC recorded zero transactions this period, consistent with the ongoing governance uncertainty that has effectively frozen that registry's transfer market.RIPE NCC: $42.98/IP avg across 57 transactions (53.7% of IP volume)
ARIN: $40.77/IP avg across 131 transactions (39.5% of IP volume)
APNIC: $39.23/IP avg across 23 transactions (1.3% of IP volume)
LACNIC: $38.44/IP avg across 9 transactions (5.4% of IP volume)
AFRINIC: No recorded transactions
| RIR | Transactions | Avg $/IP | Median $/IP | IPs Traded | RIR Transfers | Next Month (proj.) | Year-End (proj.) |
|---|---|---|---|---|---|---|---|
| RIPE | 57 | $42.98 | $43.00 | 418,816 | 2,644 | $36.00 | $35.00 |
| ARIN | 131 | $40.77 | $40.00 | 307,968 | 1,638 | $37.00 | $37.00 |
| APNIC | 23 | $39.23 | $39.00 | 10,496 | 0 | $31.00 | $32.00 |
| LACNIC | 9 | $38.44 | $38.00 | 42,240 | 0 | $37.50 | $37.00 |
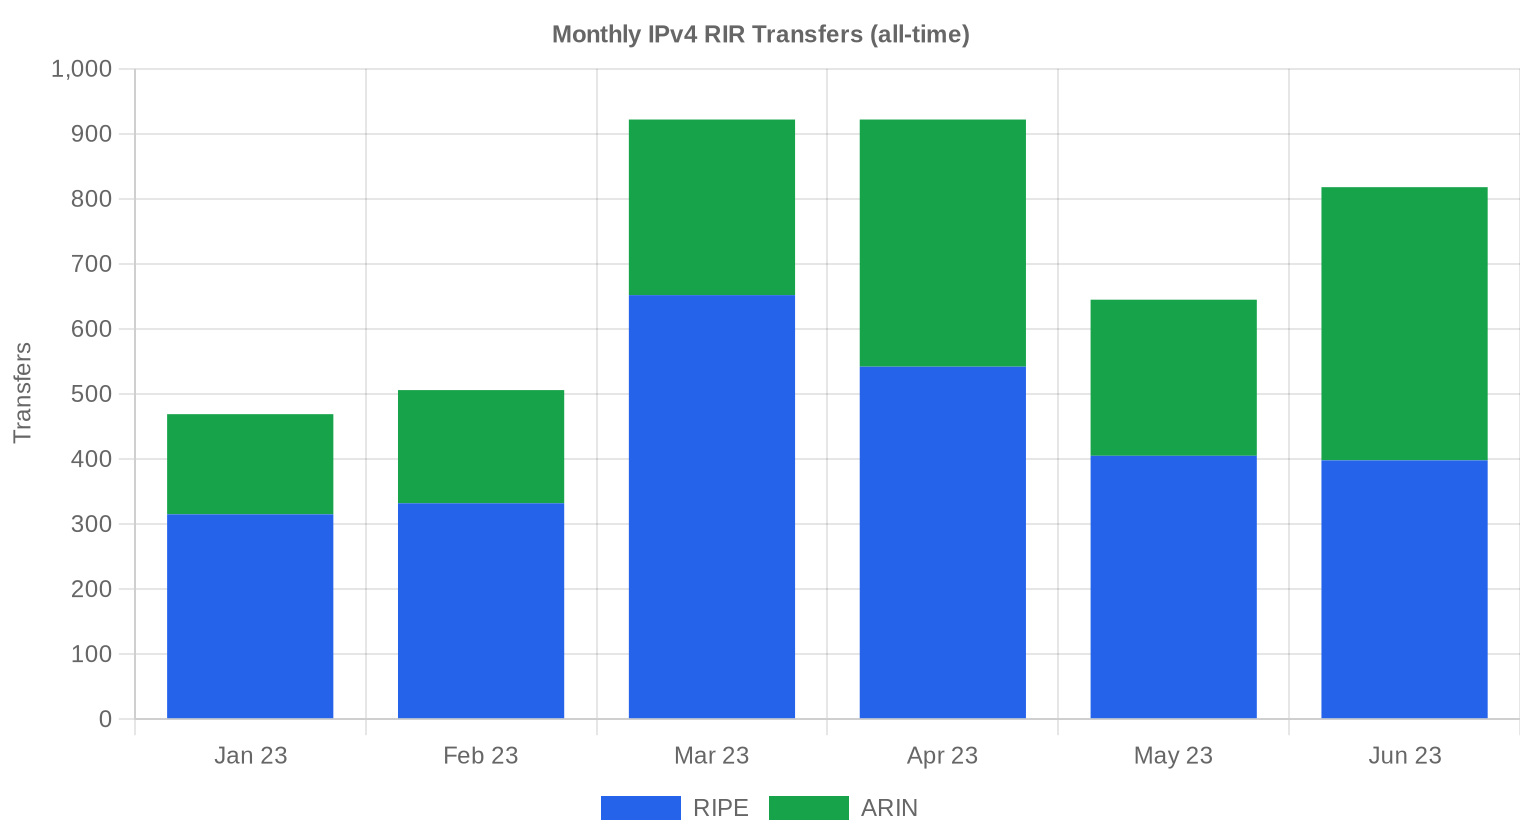
Transaction Volume
Supply & Block Sizes
/24 blocks dominated deal activity with 99 transactions — 45% of the 220 total deals. This is the bread-and-butter block for small ISPs, hosting companies, and enterprises that need a routeable prefix without committing six or seven figures. The concentration in /24s keeps per-IP premiums elevated at the small end of the spectrum; buyers who can absorb /20s or larger get meaningfully better pricing, but the capital outlay screens out most of the market.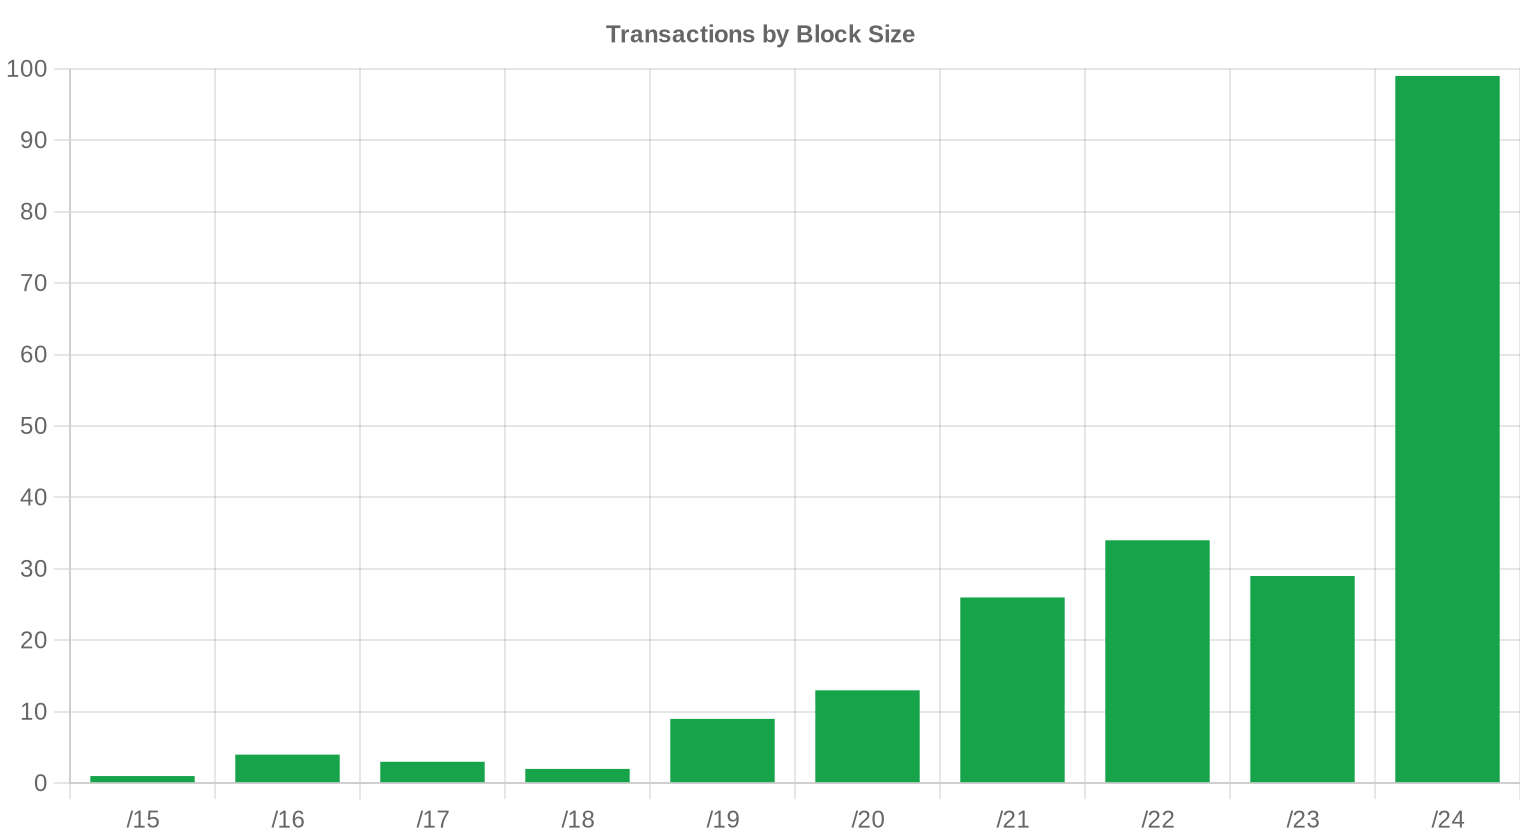
Geographic Activity
Country-level distribution data was not captured in sufficient granularity this period. Based on RIR mix — 59.5% ARIN, 25.9% RIPE by transaction count — the bulk of activity is concentrated in North America and Western Europe, which tracks with every prior half-year we have covered.Registry Transfer Activity
Official RIR transfer registries recorded 4,282 transfers during H1 2023. RIPE led with 61.7% of total transfer volume (2,644 transfers), followed by ARIN at 38.3% (1,638 transfers). APNIC, LACNIC, and AFRINIC recorded zero official transfers, though the 23 APNIC-region transactions in our pricing data suggest some activity flows through inter-RIR or pre-transfer structures not yet reflected in registry statistics.Long-Run Transfer Trends
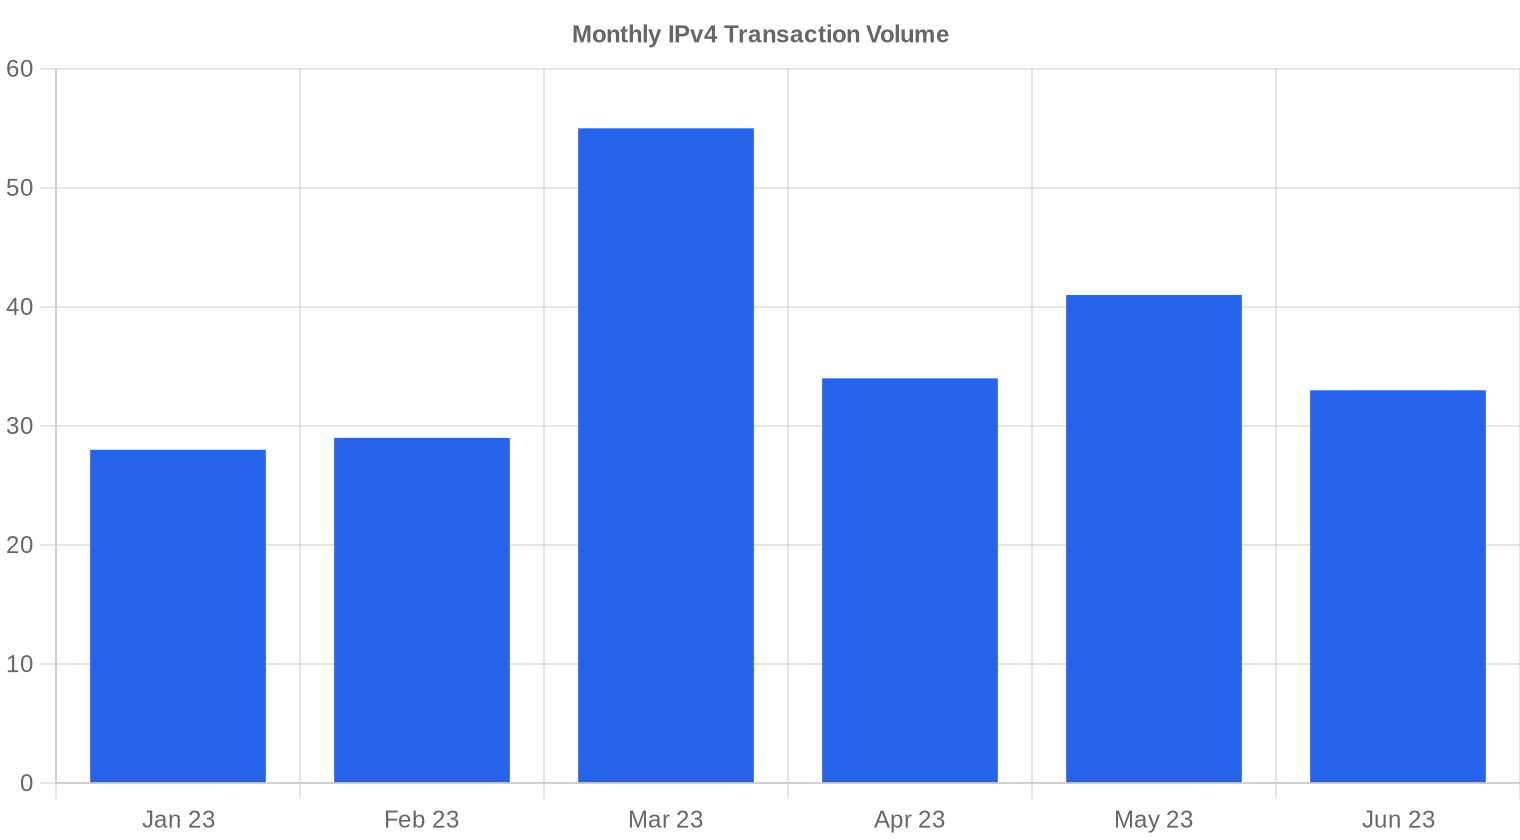
Over the six-month tracking window, March 2023 was the peak month for transfer activity — consistent with the pattern we've seen in prior years where Q1 budget cycles drive a burst of procurement. The 4,282 total transfers across the half is a healthy clip. RIPE's dominance in transfer counts (61.7%) versus its smaller share of priced transactions (25.9%) suggests a significant volume of intra-organizational or policy-driven transfers that don't hit the open market at arms-length pricing.| RIR | RIR Transfers |
|---|---|
| RIPE | 2,644 |
| ARIN | 1,638 |
| RIR Transfers | 4,282 |
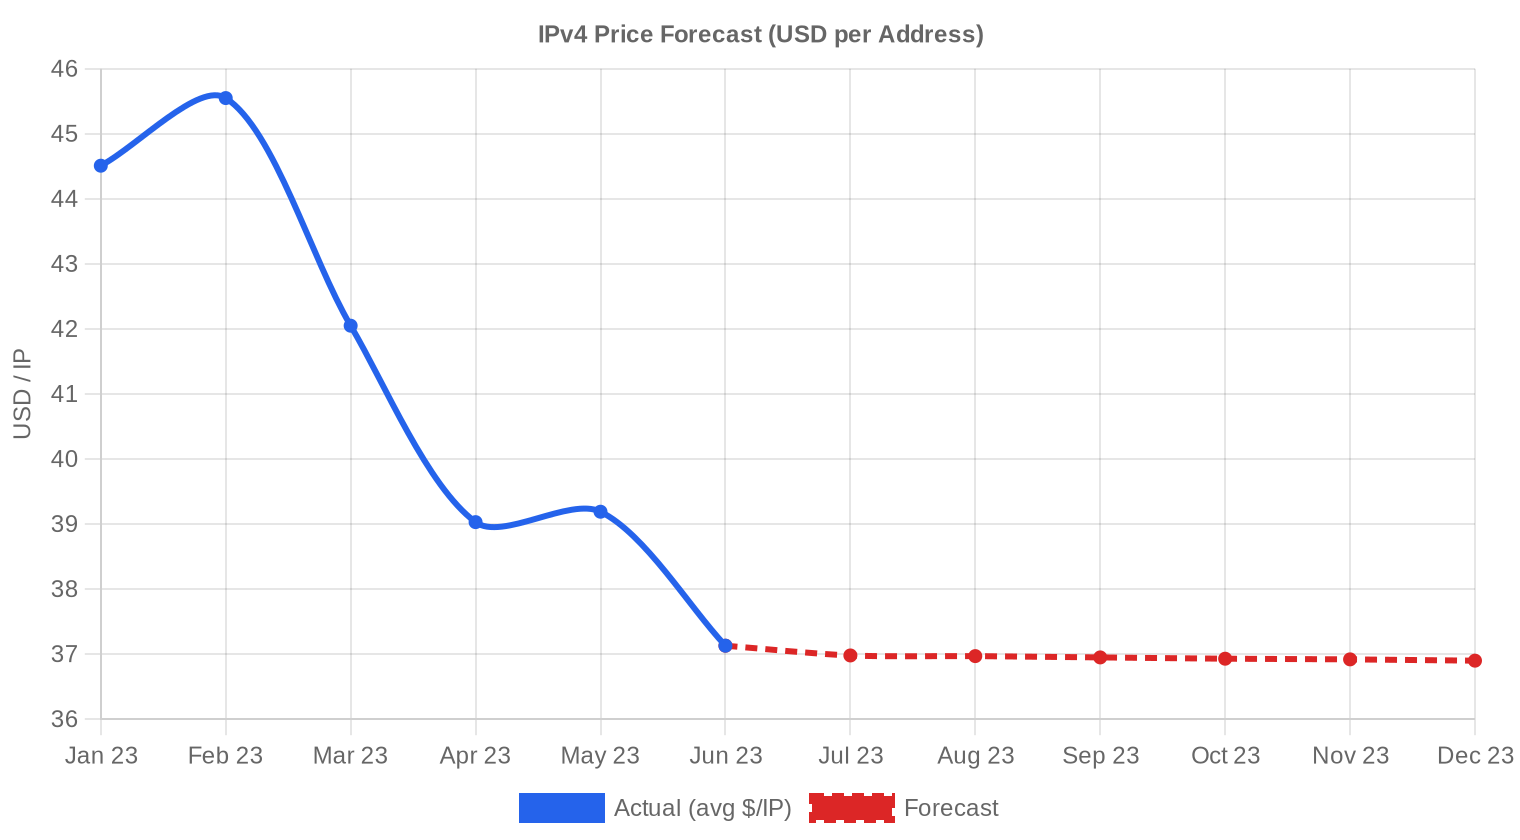
Outlook & Forecast
Forecasting each block-size band and RIR separately with our AI model:
The overall average price per IP is projected to reach $36.90 by December 2023, with a next-month estimate of $37.08 per IP.
- RIPE: projected at $36.00 per IP next month, trending toward $35.00 by December 2023.
- ARIN: projected at $37.00 per IP next month, trending toward $37.00 by December 2023.
- APNIC: projected at $31.00 per IP next month, trending toward $32.00 by December 2023.
- LACNIC: projected at $37.50 per IP next month, trending toward $37.00 by December 2023.
- AFRINIC: insufficient data for a reliable forecast.
Forecast by Block Size
| Block | Current $/IP | Next Month | Year-End | Confidence |
|---|---|---|---|---|
| /24 | $37.00 | $36.50 (-1.4%) | $36.00 (-2.7%) | medium |
| /23 | $38.75 | $38.00 (-1.9%) | $37.00 (-4.5%) | medium |
| /22 | $30.24 | $32.00 (+5.8%) | $34.00 (+12.4%) | low |
| /21 | $45.00 | $44.00 (-2.2%) | $42.00 (-6.7%) | low |
| /20 | $38.50 | $38.00 (-1.3%) | $39.00 (+1.3%) | medium |
| /19 | $37.50 | $37.00 (-1.3%) | $38.00 (+1.3%) | low |
| /18-/16 | $38.50 | $38.00 (-1.3%) | $38.00 (-1.3%) | low |
| /15-up | $51.50 | $48.00 (-6.8%) | $50.00 (-2.9%) | low |
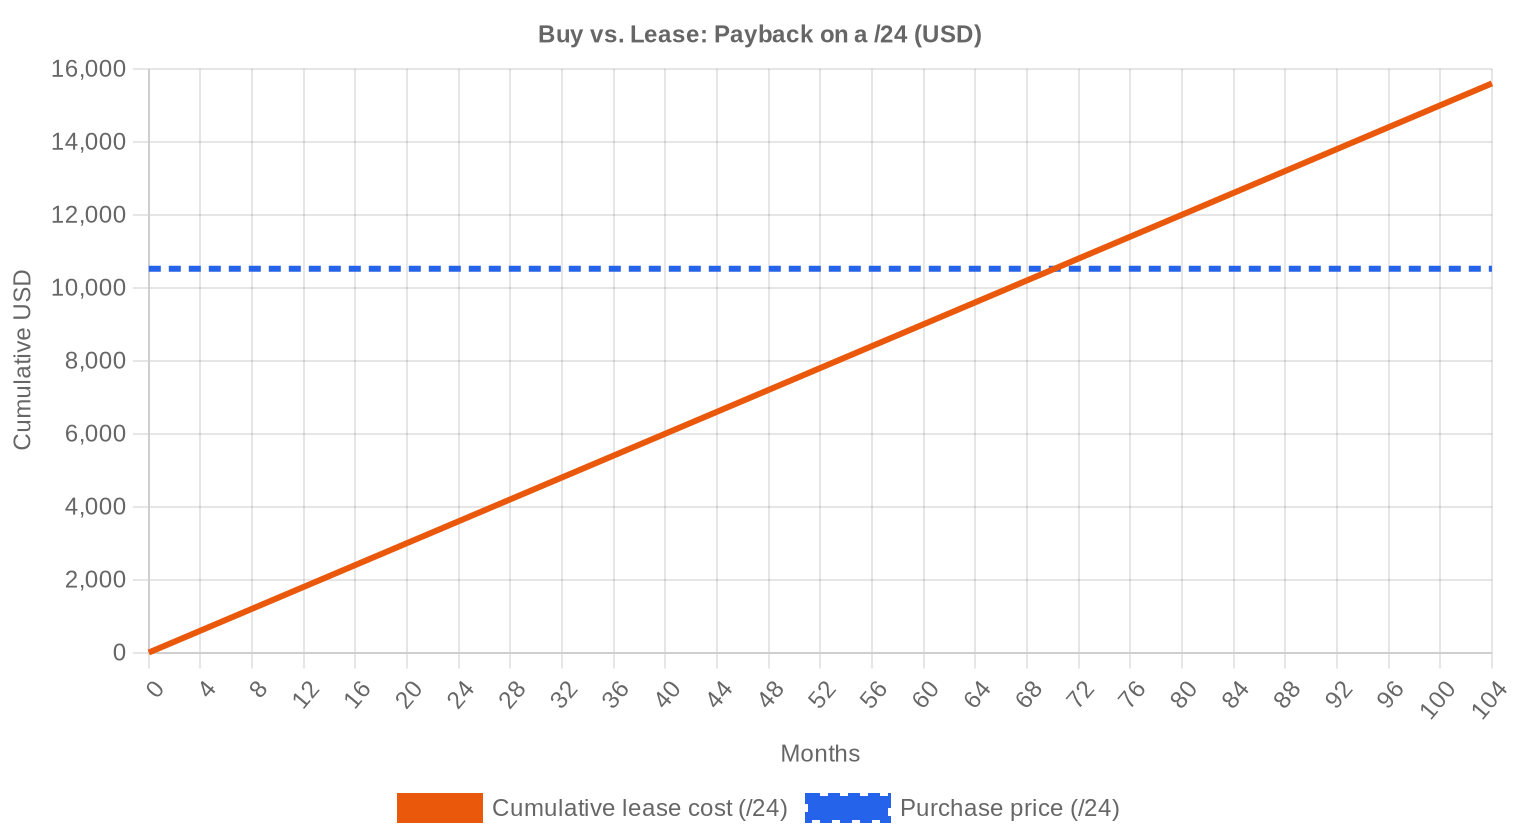
Editor's Take: Buy vs. Lease
At $41.09 per IP on the buy side and $0.5859 per IP monthly on the lease side, the buy-versus-lease math is straightforward: a purchase pays for itself in 70.1 months — roughly 5.8 years. That's a 17.1% implied annual yield for block holders who lease out their addresses instead of selling. For buyers who plan to hold addresses for more than six years, purchasing is the clear winner on a total-cost basis. For anyone with a shorter time horizon or uncertain capacity needs, leasing at $150/month per /24 keeps capital free and avoids the risk of further price deterioration. The fact that prices are trending down at 5% makes the lease option more attractive on the margin than it was a year ago — you're not losing out on appreciation anymore, and the capital you don't deploy today buys more addresses next quarter. Our verdict for H1 2023: buy if you need the addresses for the long haul; lease if there's any ambiguity.| /24 Purchase price | $10,519 |
| /24 Lease price | $150 / mo |
| Payback period | 70.1 mo (5.8 yr) |
| Gross annual yield | 17.1% |
What This Means for You
Buyers: The pricing trend is working in your favor for the first time in years. Average prices fell to $41.09 and the model projects $36.90 by December. If your need isn't urgent, patience pays — but don't wait for $25/IP because the floor has held at $30 across all RIRs and there's no sign of distressed supply flooding the market.Sellers: The window of peak pricing has closed. Every quarter you hold inventory that you intend to liquidate, you're losing roughly 2-3% in realized value. Blocks with clean reputations and RIPE allocation still command premiums above $42, so if you're holding those, you have time. APNIC and LACNIC blocks should be priced to move.
Leasers: At $0.59/IP/month, leasing remains a viable alternative to buying for deployments under six years. The yield for lessors is 17.1% annually — substantially above any fixed-income alternative — so expect continued supply of lease inventory from holders looking to monetize without selling.
Block holders: If you're sitting on allocated space you don't use, leasing at current rates generates a 17.1% annual return on current market value. That's a better risk-adjusted return than selling today and redeploying into most asset classes. Hold and lease unless you need the lump sum.
Browse verified IPv4 blocksSell IPv4 →
List your blocks with managed transferLease IPv4 →
Flexible short-term capacityLease Out IPv4 →
Turn idle blocks into recurring revenue
IPv4 Pricing by Block Size
Per-IP pricing varies sharply by block size. /24 blocks — the most actively traded prefix — carry the highest per-IP premiums, often $5-10 above the market average for clean allocations. As blocks scale up to /20, /18, and /16, per-IP pricing compresses toward $35-38, reflecting the reduced pool of buyers who can write seven-figure checks. The eight deals above $1 million this period accounted for $20.2 million — 55% of total market value — which shows how much capital is concentrated in the large-block segment.| Block | IPs | Buy: /IP | Buy: Total | Lease: /IP/mo | Lease: Monthly |
|---|---|---|---|---|---|
| /24 | 256 | $35–45 | $8,960–11,520 | $0.38–0.50 | $97–128 |
| /22 | 1,024 | $28–38 | $28,672–38,912 | $0.33–0.45 | $338–461 |
| /20 | 4,096 | $22–32 | $90,112–131,072 | $0.30–0.40 | $1,229–1,638 |
| /18 | 16,384 | $20–30 | $327,680–491,520 | $0.30–0.38 | $4,915–6,226 |
| /16 | 65,536 | $18–28 | $1,179,648–1,835,008 | $0.30–0.35 | $19,661–22,938 |
IPv4 Price History: 2011–2026
IPv4 addresses were effectively free until IANA pool exhaustion in 2011, and the secondary market took several years to develop real price discovery. Prices climbed steadily from single digits in 2014-2015 to the mid-$20s by 2019, then accelerated sharply through 2021-2022 as pandemic-driven digitization collided with finite supply. AWS's decision to charge $0.005/hour per public IPv4 address (effective February 2024 but announced in mid-2023) has already begun recalibrating expectations — organizations are reclaiming unused addresses and optimizing allocation, which is adding marginal supply. The H1 2023 average of $41.09 likely represents the post-peak plateau, with our models projecting further softening through year-end.| Year | ~Price/IP | Key Event |
|---|---|---|
| 2011 | $7–12 | IANA free pool exhausted; Microsoft/Nortel deal ($11.25/IP) |
| 2012 | $8–12 | RIPE NCC reaches last /8; begins /22-only allocation |
| 2014 | $10–15 | LACNIC free pool exhausted |
| 2015 | $8–15 | ARIN free pool exhausted |
| 2017–18 | $12–18 | Leasing market grows; cloud demand rises |
| 2019 | $18–24 | RIPE NCC exhausts remaining free pool |
| 2021–22 | $50–60+ | Post-pandemic peak; hyperscaler build-outs |
| 2024 | $35–52 | AWS IPv4 charge ($0.005/IP/hr); large block correction |
| 2025–26 | $18–45 | Market bifurcation; /16s below $20 for first time since 2019 |
Market Structure: Who Is Buying & Selling
The buy side remains a mix of mid-tier cloud providers, regional ISPs expanding footprint, and enterprises with specific compliance or geolocation requirements. The sell side is increasingly populated by legacy holders — universities, government agencies, and pre-commercial internet organizations — finally monetizing allocations they received decades ago. Bankruptcy-driven liquidations contributed a handful of blocks, but the bulk of supply is discretionary.IPv4 vs. Other Asset Classes
At a 17.1% implied annual yield from leasing, IPv4 addresses outperform virtually every traditional asset class on a current-income basis. US 10-year Treasuries yield around 3.8%; investment-grade corporate bonds sit near 5%; and even leveraged real estate rarely clears 10% net. The catch is liquidity — IPv4 blocks take weeks to transfer and the market has no central exchange — but for patient capital with a multi-year horizon, the risk-adjusted return profile is compelling.| Asset Class | Typical Yield | Liquidity | Primary Risk |
|---|---|---|---|
| IPv4 | 17.1% | Moderate | IPv6 adoption, block quality |
| Commercial Real Estate | 5–8% | Low | Vacancy, rate cycle |
| Investment-Grade Bonds | 4–5% | High | Duration, credit risk |
| S&P 500 | ~1,3% | High | Market volatility |
| Money Market / T-Bills | ~4–5% | High | Rate cycle changes |
IPv6 Adoption & Why IPv4 Remains Essential
IPv6 adoption continues its slow grind upward — Google's measurements show roughly 40% of traffic reaching its services over IPv6 as of mid-2023. But the key word is coexistence. Major enterprise networks, legacy applications, IoT devices, and large swaths of developing-world infrastructure remain IPv4-dependent. The practical reality is that dual-stack will persist for at least another decade, and any organization deploying public-facing services still needs routable IPv4 space.AI & Cloud Infrastructure Demand
The AI infrastructure buildout is a net positive for IPv4 demand, though the effect is second-order. Large training clusters themselves consume relatively little public address space — they run on private networks. But the inference layer, API endpoints, edge caching, and the wave of AI-powered SaaS products that need public-facing addresses all contribute incremental demand. Every new AI startup that spins up infrastructure needs a /24 at minimum, and the velocity of company formation in this sector is adding measurable pressure to the small-block segment.What Determines IPv4 Block Value
Not all /24s are created equal. Blocks with clean blacklist history, no prior spam or abuse associations, and stable allocation provenance trade at $3-5 premiums per IP over otherwise identical space. RIR matters: RIPE blocks command $2-3 more than ARIN equivalents, and ARIN trades at a premium to APNIC and LACNIC. Transferability is the baseline requirement — any block with encumbrances, disputed ownership, or unclear chain of custody is effectively illiquid.Sell vs. Lease: A Decision Framework
In a declining price environment, the lease strategy gains relative attractiveness for holders. Selling today at $41/IP locks in current value but forfeits a 17.1% annual income stream. If prices fall to $37 by December as our model projects, a holder who leased for six months at $0.59/IP/month has collected $3.51/IP in income — more than offsetting the $4 decline in asset value. Selling makes sense if you need capital now or believe the decline will accelerate beyond what leasing income can offset.| /24 Purchase price | $10,519 |
| /24 Lease price | $150 / mo |
| Payback period | 70.1 mo (5.8 yr) |
| Gross annual yield | 17.1% |
RIPE NCC 24-Month Transfer Restriction
RIPE's 24-month holding requirement before an address block can be re-transferred acts as a structural supply constraint. Buyers who acquire RIPE space are locked in for two years, which removes blocks from the liquid supply pool and supports pricing — RIPE's $2.21 premium over ARIN is partly a scarcity premium created by this rule. For sellers, it means RIPE blocks that have cleared the holding period carry documented provenance and trade more smoothly, which buyers are willing to pay for.Deal Size Distribution
The average deal size was $165,410, but that figure masks a highly bifurcated market. Of 220 transactions, 162 (73.6%) were under $50,000 — the small-block, small-buyer segment that generates volume but only 8.5% of total value. The 8 deals above $1 million accounted for $20.2 million, or 55.5% of total market value. This concentration means a handful of large institutional trades drive the dollar-weighted metrics, while the /24 market operates on its own micro-dynamics.Top Trading Countries
Granular country-level data was not available for this period. The RIR distribution — ARIN at 59.5% of transactions, RIPE at 25.9% — points to the US, Canada, and Western European markets as the dominant geographies. APNIC's 23 transactions likely skew toward Australia, Japan, and the more developed Southeast Asian economies where address needs outstrip remaining free pool allocations.BEAD Broadband Program Impact
The BEAD program's $42.4 billion in broadband funding is beginning to enter the planning phase, with state-level grant applications ramping through 2023-2024. Rural ISPs and fixed wireless providers building out BEAD-funded networks will need routable IPv4 space — most likely /22 to /20 blocks — and the mid-size segment of the market should feel the demand pressure within 12-18 months. This is a slow-moving but substantial demand driver that hasn't been priced in yet.Hyperscaler IPv4 Holdings
Amazon, Microsoft, and Google collectively hold tens of millions of IPv4 addresses — Amazon alone controls an estimated 100+ million through acquisitions and early allocations. These holdings give hyperscalers strategic optionality: they can absorb growing internal demand without competing in the transfer market, or selectively release blocks when it suits them. AWS's new public IPv4 charge is the first sign that hyperscalers view their address holdings as revenue-generating assets, not just infrastructure plumbing, and that shift in thinking will ripple through market pricing for years.Macroeconomic Conditions & Market Impact
The Fed held rates in the 5-5.25% range through H1 2023, and enterprise IT budgets reflected the broader tightening cycle — procurement teams scrutinized every purchase order more carefully than they did in 2021. Higher discount rates mechanically reduce the present value of long-lived assets like IPv4 blocks, which partially explains the softening in prices. If rate cuts materialize in 2024 as markets expect, the cost-of-capital headwind for IPv4 valuations should ease.Methodology
Figures are based on completed IPv4Center marketplace transactions and RIR transfer statistics. Prices are in US dollars per IP address. Forecasts are produced by an AI model that analyses each block-size band and RIR segment separately (with outlier-trimmed medians) alongside known market catalysts; they are estimates, not guarantees.
Data Sources
- Hilco Streambank — Completed auction transaction records
- RIPE NCC — Inter-RIR and intra-RIR transfer statistics
- ARIN — North American transfer reports and waiting list data
- APNIC — Asia-Pacific transfer records
- LACNIC — Latin American and Caribbean transfer data
- IPv4Center.com — Proprietary marketplace transaction and lease pricing data
This report is generated automatically for informational purposes only and does not constitute financial advice.
Frequently Asked Questions
What was the average price per IPv4 address in 2023-H1?
The global weighted average landed at .09 per address, with a median of . That represents a market in gentle decline — our trend indicator reads 'down' with roughly a 5% softening over the period.
How many transactions were recorded and what was the total market value?
We tracked 220 priced transactions covering 779,520 addresses for an aggregate consideration of .4 million. Average deal size was approximately 3,543 IPs per transaction — a market still dominated by /24 purchases, which accounted for 99 of the 220 deals.
Why is RIPE space trading at a premium to ARIN in this period?
RIPE addresses averaged .98 per IP versus ARIN's .77 — a .21 or roughly 5.4% premium. European regulatory clarity, deeper demand from cloud and hosting operators in the EU, and RIPE's comparatively streamlined transfer policy all sustain that spread. RIPE also accounted for 61.7% of all registered transfers (2,644 of 4,282) despite representing only 26% of priced transactions, suggesting robust institutional activity beyond the brokered market.
Which RIR region offered the cheapest IPv4 addresses?
LACNIC space was the value play at .44 average per IP across 9 transactions totaling 42,240 addresses. APNIC was close behind at .23. Both regions carry thinner liquidity and more complex transfer mechanics, which the discount reflects.
What was the observed price range across the entire market?
The global floor was per IP (seen in both ARIN and APNIC) and the ceiling was , recorded in the ARIN region. RIPE's range was tighter — .18 to .50 — consistent with a more institutionalized market with fewer distressed sellers.
How does the /24 dominate deal flow and why does that matter?
The /24 (256 addresses) was the most-traded prefix size with 99 of 220 transactions — 45% of all deals. This is the minimum independently routable block on most networks. Buyers seeking operational flexibility without capital intensity gravitate here, which keeps /24 pricing firm even as larger blocks see modest softening.
What mistakes should buyers avoid in the current softening market?
The biggest error is overpaying for urgency. With prices trending down roughly 5% and our year-end forecast at .90, a buyer paying per IP today could be underwater within months. Equally dangerous: skipping due diligence on block reputation — blacklisted space is functionally worthless regardless of the per-IP sticker price.
What are the risks of waiting too long to buy despite the downward trend?
A 5% decline is not a collapse. IPv4 remains a finite, depleting asset. Buyers who indefinitely delay on the assumption prices will crater may find liquidity drying up in their preferred prefix size or RIR, particularly in RIPE where transfer volumes are high but saleable inventory is thinning. The forecast points to .90 by year-end — a modest further decline, not a fire sale.
Is it better to buy or lease IPv4 space at current H1 2023 rates?
Buy. At .5859 per IP per month lease cost versus a .09 purchase price, the breakeven is 70.1 months — roughly 5.8 years. Any buyer with a planning horizon beyond six years is better off owning the asset outright. The implied annual yield for lessors is 17.1%, which tells you who benefits from the lease arrangement.
What does the 17.1% annual yield on leased IPv4 space imply for lessors?
It implies that leasing IPv4 is an extraordinarily attractive cash-flow business. A block purchased at .09 per IP generating .03 per IP annually delivers a yield that dwarfs most fixed-income instruments. Lessors with clean, well-maintained blocks are effectively running a toll road on internet infrastructure.
What is the cost of a single /24 block — to buy versus to lease?
A /24 (256 IPs) costs approximately ,519 to purchase outright at the period average. Leasing the same block runs 0 per month or ,800 per year. The purchase pays for itself in about 70 months; after that, ownership is pure upside.
Where does AFRINIC stand in the transfer market?
Nowhere, effectively. Zero priced transactions and zero registered transfers in 2023-H1. AFRINIC's ongoing governance crisis and legal disputes have frozen its transfer market. Institutional buyers should treat AFRINIC space as illiquid and operationally risky until the registry stabilizes.
What risks does AFRINIC instability pose to buyers holding African address space?
Holders face potential routing uncertainty, inability to complete inter-RIR transfers, and reputational risk if AFRINIC's WHOIS data becomes unreliable. We advise extreme caution. Any existing AFRINIC holdings should be evaluated for migration feasibility to other RIR regions where possible.
How did deal-size distribution break down in 2023-H1?
The market was bottom-heavy: 162 of 220 transactions (74%) were under K, generating .1 million in value. At the other extreme, just 8 deals above million accounted for .2 million — 55% of total market value. This bifurcation is typical of a maturing asset class: many small operational buyers, a few large portfolio or M&A-driven trades.
Which month saw the highest transfer activity during 2023-H1?
March 2023 was the peak month for registered transfers across the 4,282 total recorded during the half. Seasonal patterns in enterprise budgeting — fiscal Q1 close for calendar-year companies — likely drove the spike.
What is the year-end 2023 price forecast and how reliable is it?
Our model projects .90 per IP by December 2023, down from the H1 average of .09. The near-term forecast (next month) is .08. Confidence is rated as reliable, supported by a clear downward trend and sufficient transaction volume to anchor the regression.
What is driving the 5% price decline during this period?
Three factors converge: accelerating IPv6 adoption among hyperscalers reducing marginal demand; increased sell-side inventory from companies monetizing underutilized legacy allocations; and a general tightening of enterprise IT budgets in the post-2022 macro environment. None of these are existential — the decline is orderly, not panicked.
How large was the average deal in 2023-H1 by number of addresses?
Average deal size was roughly 3,543 IPs, or approximately a /14 equivalent. However, this average is heavily skewed by the 8 deals above million. The median transaction was almost certainly a /24 given that prefix's dominance in the deal count.
What should a buyer expect to pay for APNIC space specifically?
APNIC addresses averaged .23 per IP across 23 transactions in H1 2023, with a median of and a range of to . Total volume was modest — only 10,496 IPs changed hands — so liquidity is thin. Buyers should expect wider bid-ask spreads and longer closing timelines than in ARIN or RIPE.
Is IPv6 adoption making IPv4 addresses obsolete?
Not in any commercially meaningful timeframe. IPv6 traffic share continues to grow, but the installed base of IPv4-dependent infrastructure, applications, and edge devices ensures demand persists for years. Our forecast model — which incorporates IPv6 trend data — still projects prices above through year-end 2023. Obsolescence is a decade-plus conversation, not a near-term trading thesis.
What does the transfer process look like and how long does it take?
An inter-party transfer within the same RIR typically takes 2–6 weeks: buyer and seller execute a purchase agreement, submit the transfer request to the RIR with supporting documentation, and the registry validates organizational eligibility before updating WHOIS. Inter-RIR transfers are more complex and can stretch to 8–12 weeks. ARIN and RIPE, which handled 100% of registered transfers in H1 2023, have the most predictable timelines.
What are the risks of buying the cheapest available blocks?
Bargain blocks — particularly those at or near the floor — often carry baggage: blacklist history, fragmented routing, or ambiguous legacy title. A per IP block that cannot be cleanly routed is worth . Buyers should budget for professional due diligence including blacklist screening, RIR record verification, and BGP routing history analysis before closing.
How did ARIN dominate transaction count while RIPE dominated transfer registrations?
ARIN accounted for 59.5% of priced transactions (131 of 220) but only 38.3% of total registered transfers (1,638 of 4,282). RIPE, by contrast, drove 61.7% of transfers (2,644) despite only 57 priced deals. The divergence suggests a large volume of RIPE transfers occur at the organizational level — intra-group restructurings, M&A-related reassignments — that never touch the open brokered market.
How should enterprise CFOs think about IPv4 on the balance sheet?
At .09 per IP with a 17.1% implied lease yield and a breakeven of 5.8 years, IPv4 blocks are a performing intangible asset. Purchased blocks should be capitalized and amortized over the organization's expected useful life — typically 7 to 10 years. The asset depreciates on the books but, unlike most intangibles, can be resold into a liquid secondary market.
What happened to LACNIC transfer activity?
LACNIC recorded 9 priced transactions totaling .6 million but zero formally registered transfers in the RIR system during H1 2023. This disconnect reflects LACNIC's historically restrictive transfer framework and slower administrative processing. Buyers targeting Latin American space should prepare for extended closing timelines and may want to consider inter-RIR transfers from ARIN as an alternative sourcing strategy.
Should investors view the 2023-H1 softening as a buying opportunity or a warning?
Both, depending on your horizon. A 5% decline with a year-end target of .90 is not capitulation — it is a repricing in a still-functioning market. For operators with genuine routing needs and a 5+ year horizon, current prices look defensible. For pure speculators expecting a return to + peaks, the data is not encouraging. The trend is down, the forecast is reliable, and the smart money is leasing out existing holdings while selectively adding clean blocks on dips.