14 min read
This report analyzes the IPv4 transfer market for October 2026, based on completed IPv4Center marketplace transactions and official RIR transfer records.
Executive Summary
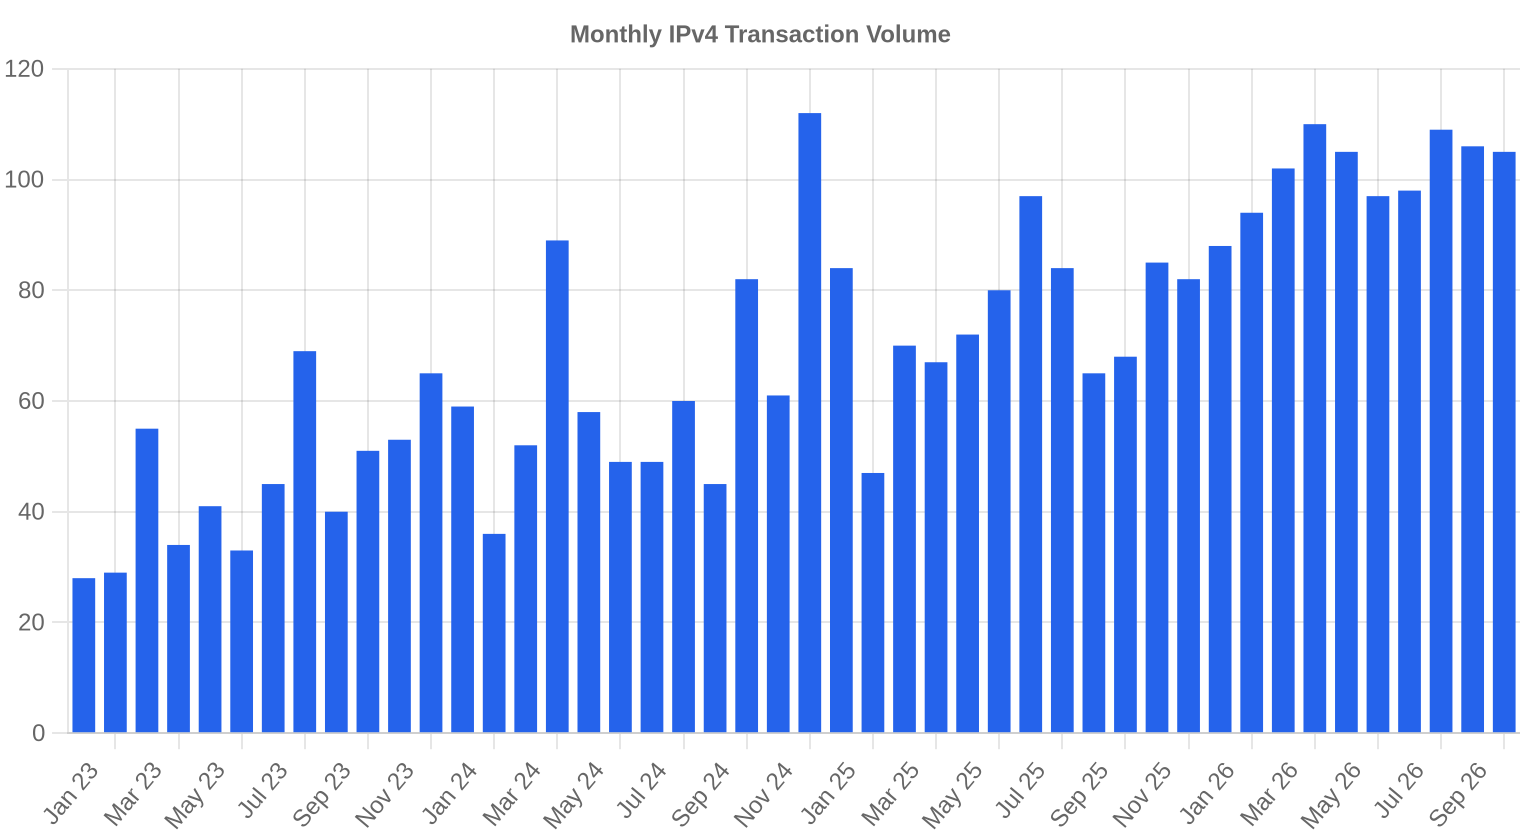
The IPv4 transfer market printed $20.84 per IP in October 2026, up $0.90 (+4.5%) from September's $19.94 average. That monthly pop, however, sits within a broader declining trajectory — year-over-year pricing is down 13.1% from October 2025. A total of 105 transactions moved 269,568 addresses for $4.19 million in aggregate value. The volume-weighted average came in at $15.54, a steep discount to the simple mean, indicating that the month's larger blocks cleared at significantly lower per-IP rates. Deal flow dipped 0.9% versus September, consistent with a market that is liquid but not accelerating.Market Overview
| Transactions | 105 |
| IP Addresses Traded | 269,568 |
| Estimated Market Value | $4,189,119 |
| Average Price / IP | $20.84 |
| Median Price / IP | $21.00 |
| RIR Transfers | 679 |
Year-over-Year Comparison
| Metric | This period | A year earlier (October 2025) | Change |
|---|---|---|---|
| Transactions | 105 | 68 | +54.4% |
| IP Addresses Traded | 269,568 | 909,056 | -70.3% |
| Estimated Market Value | $4,189,119 | $12,230,973 | -65.7% |
| Average Price / IP | $20.84 | $23.97 | -13.1% |
| RIR Transfers | 679 | 733 | -7.4% |
Price Dynamics
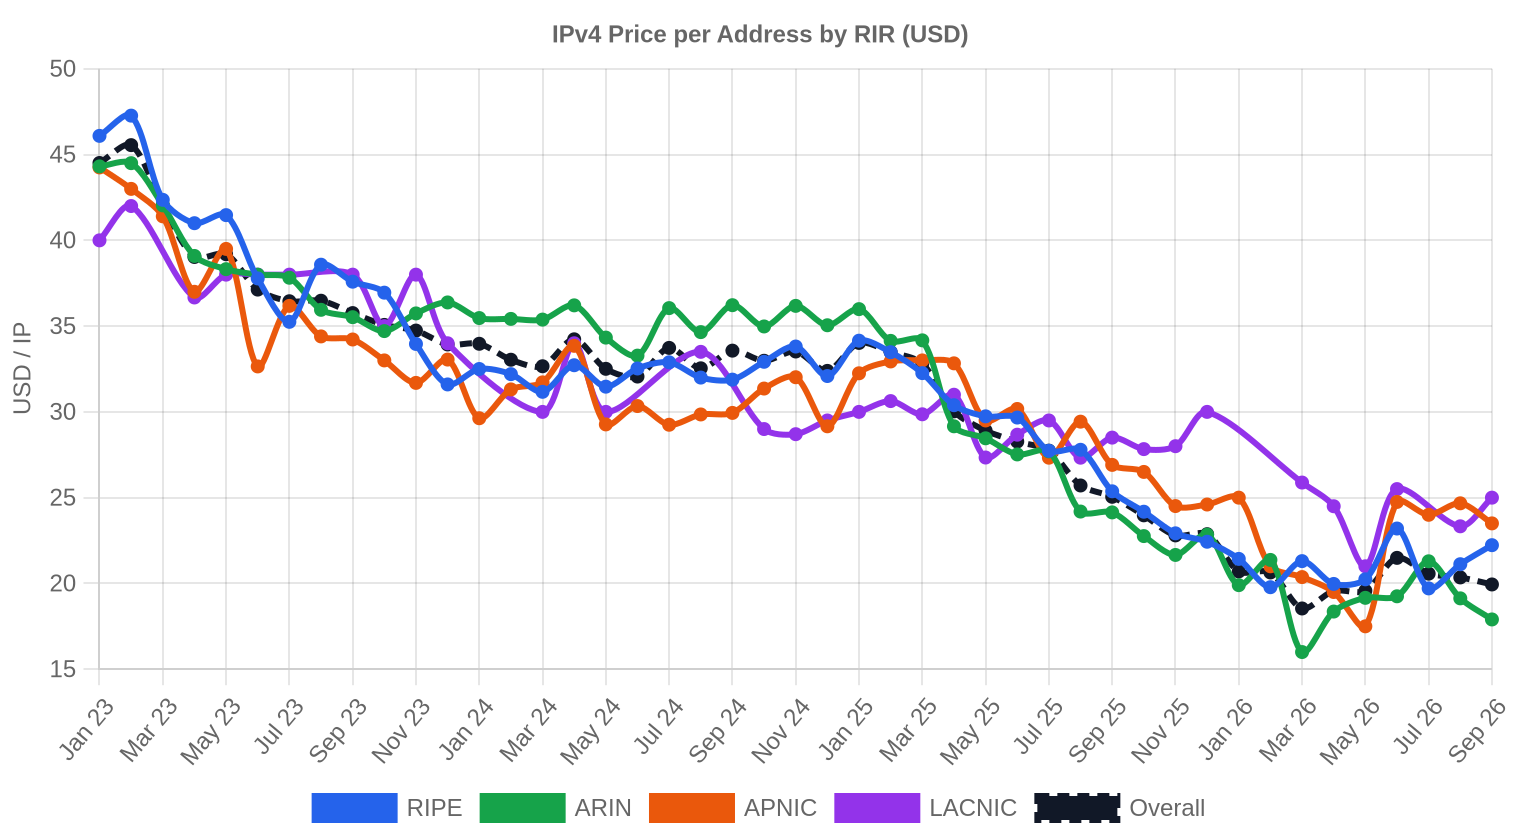
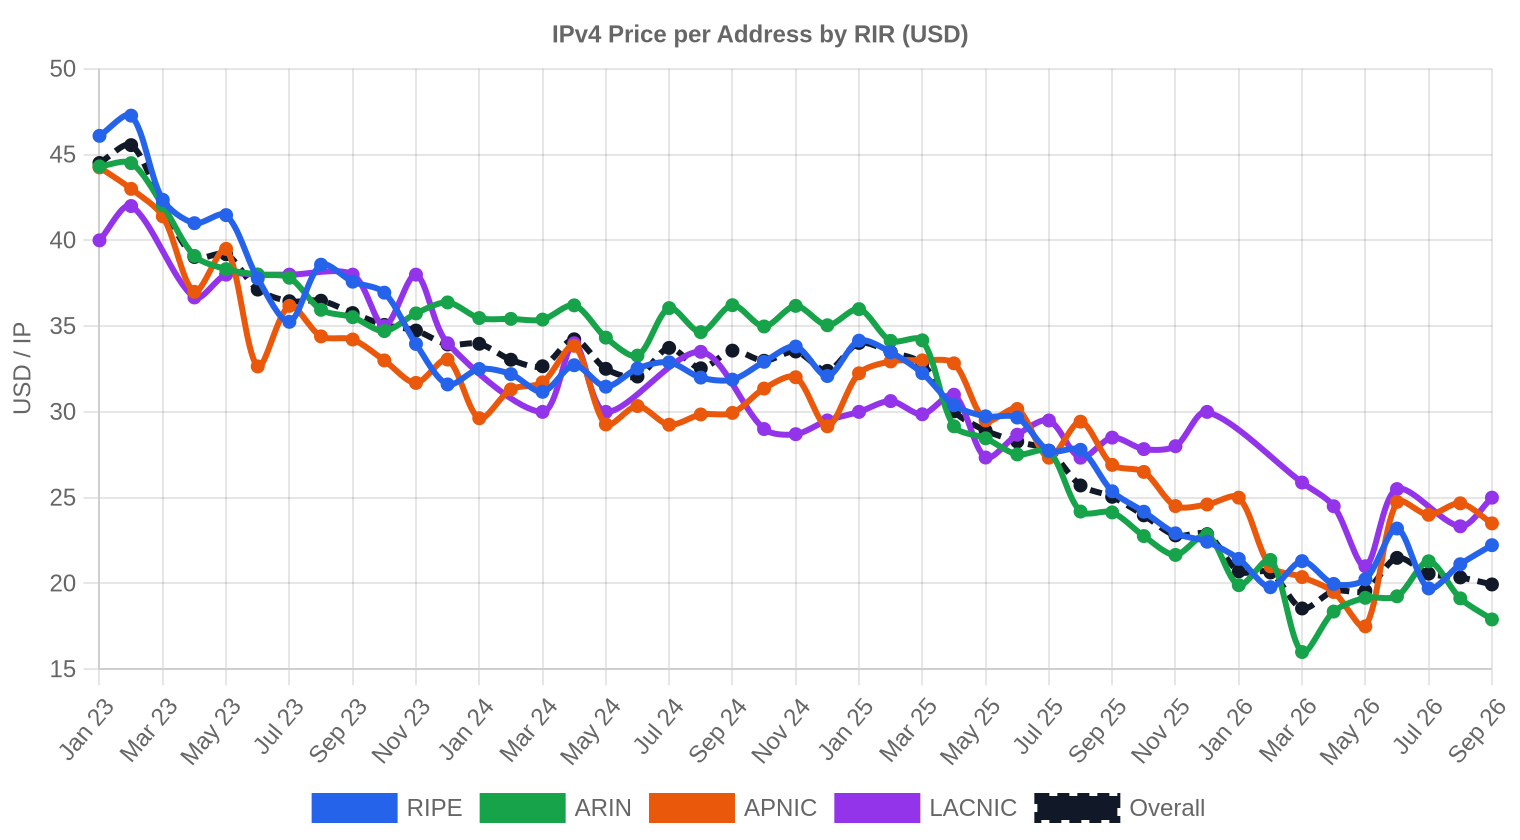
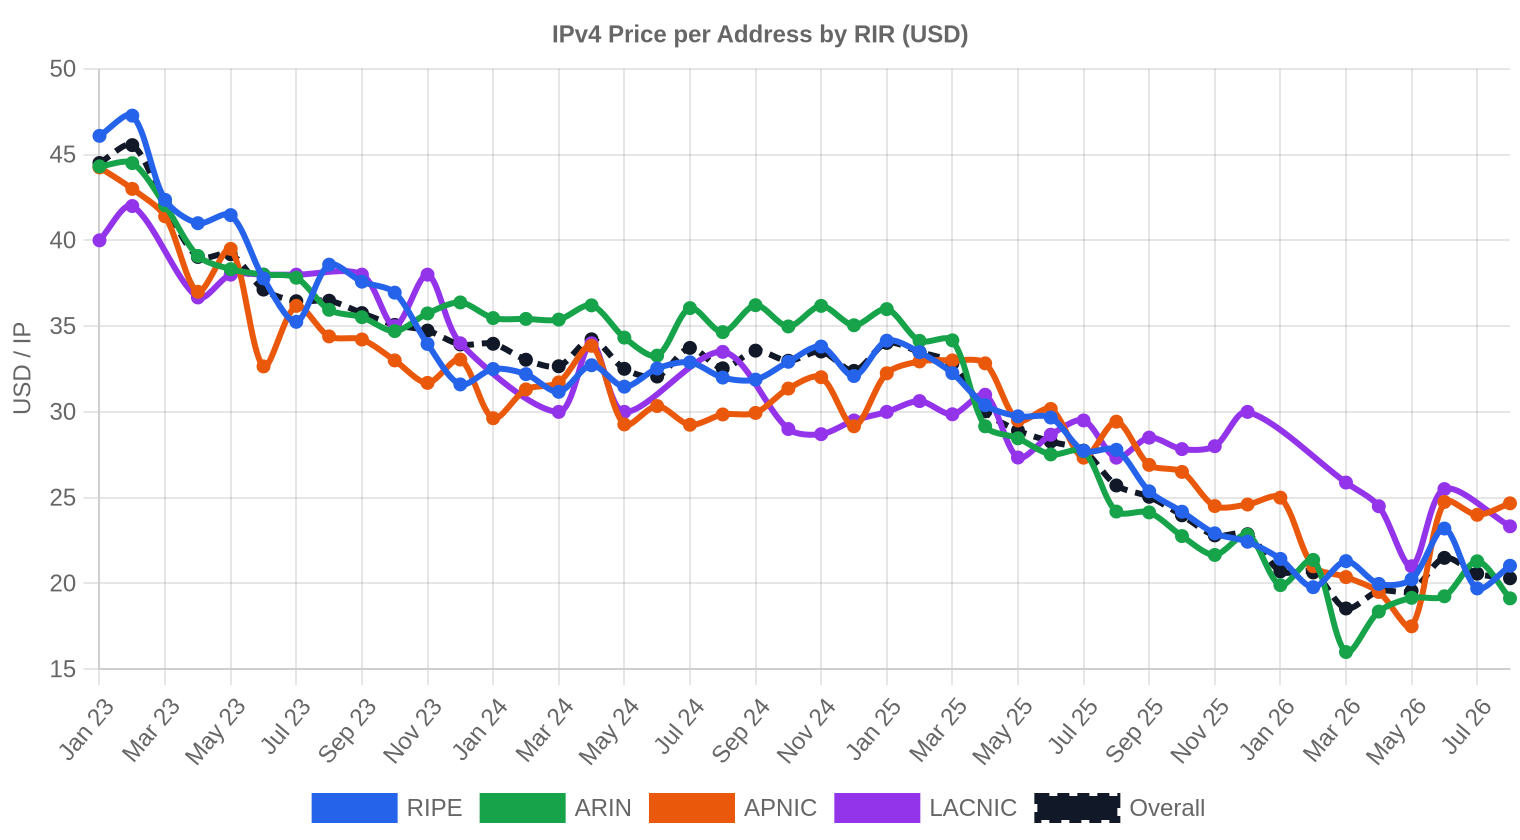
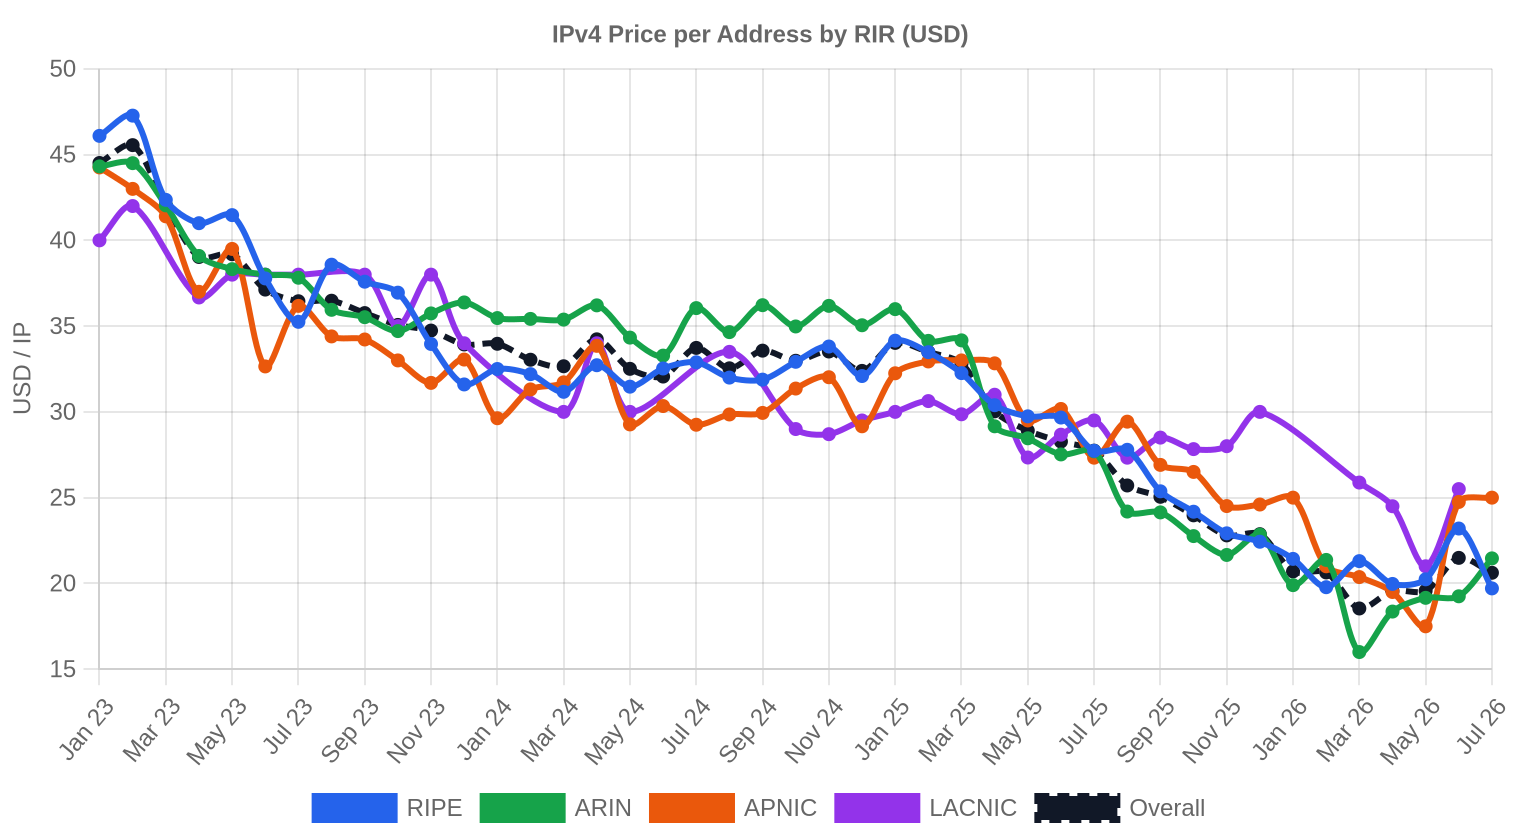
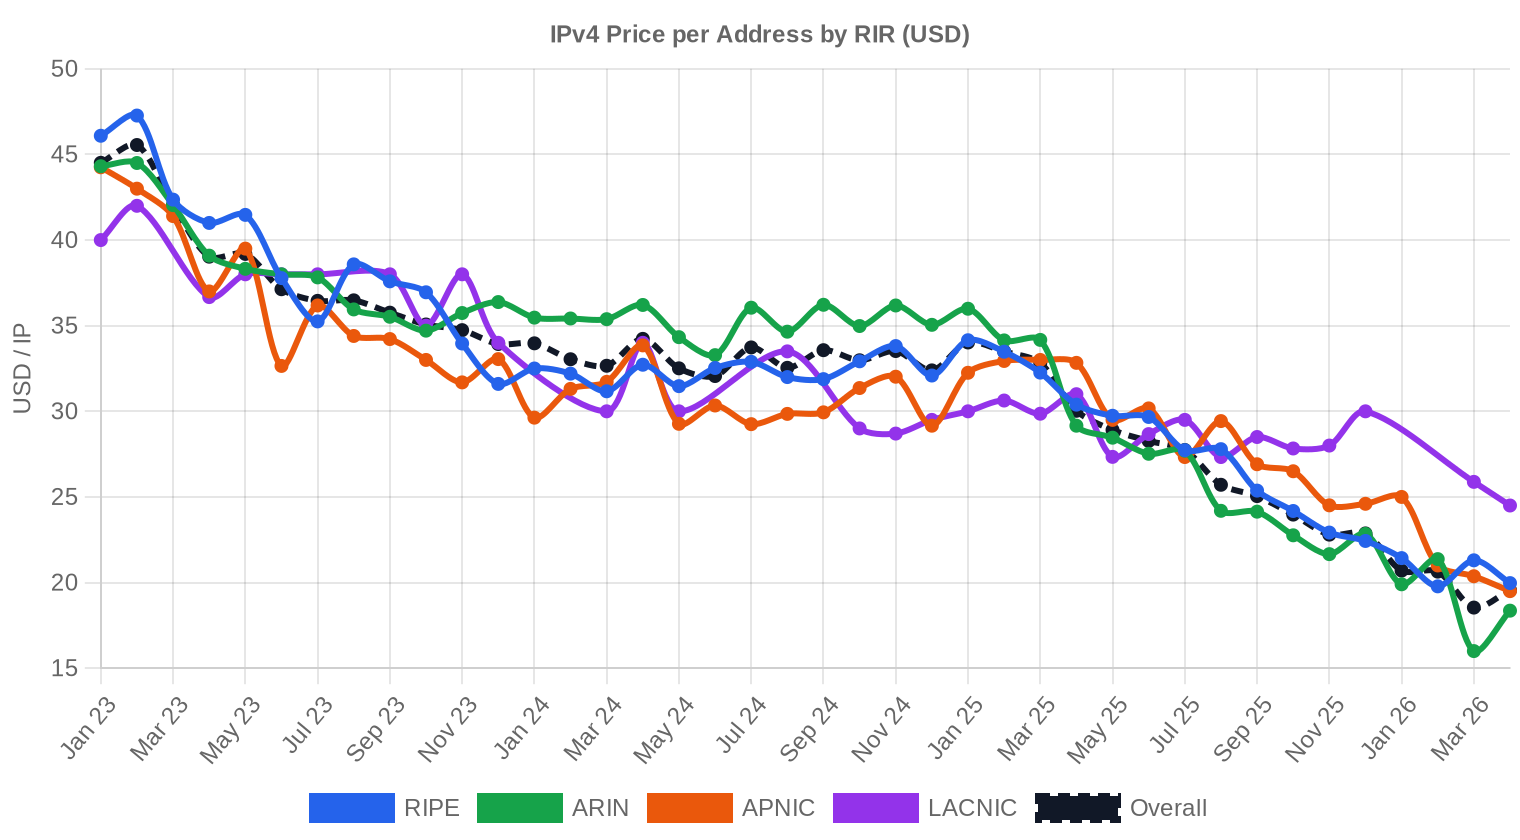
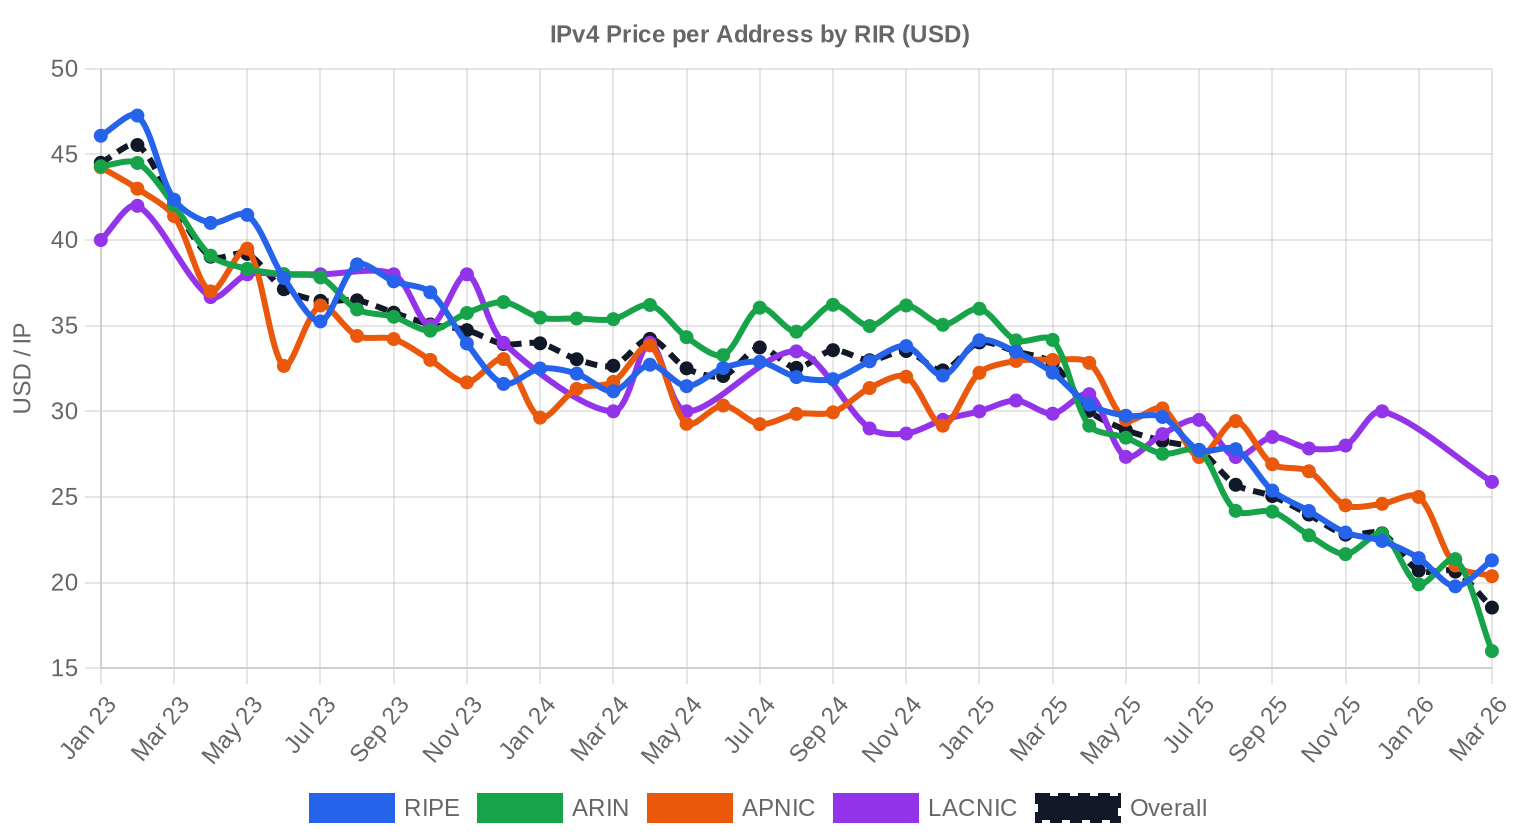
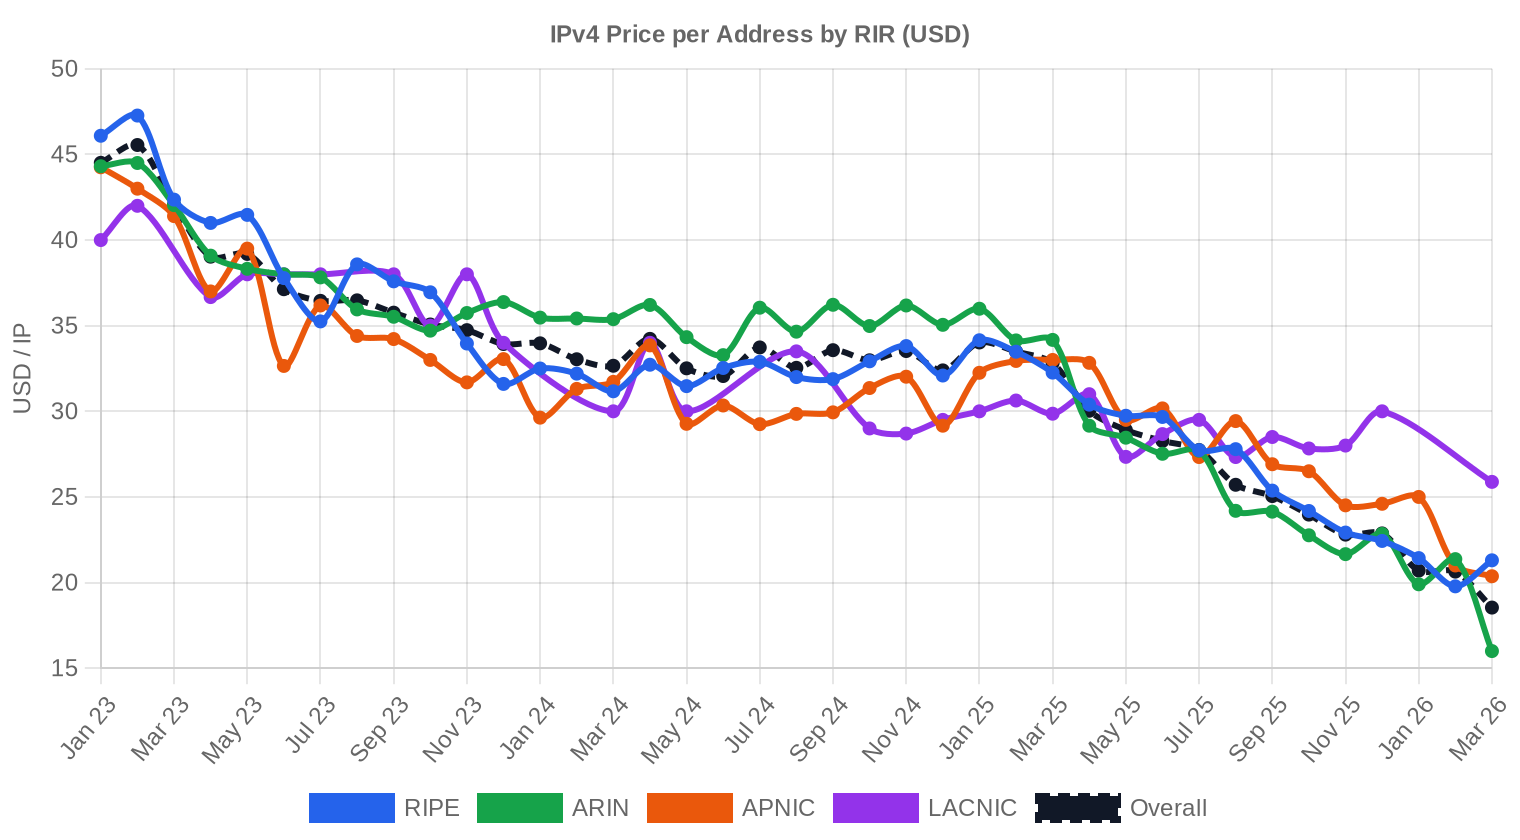
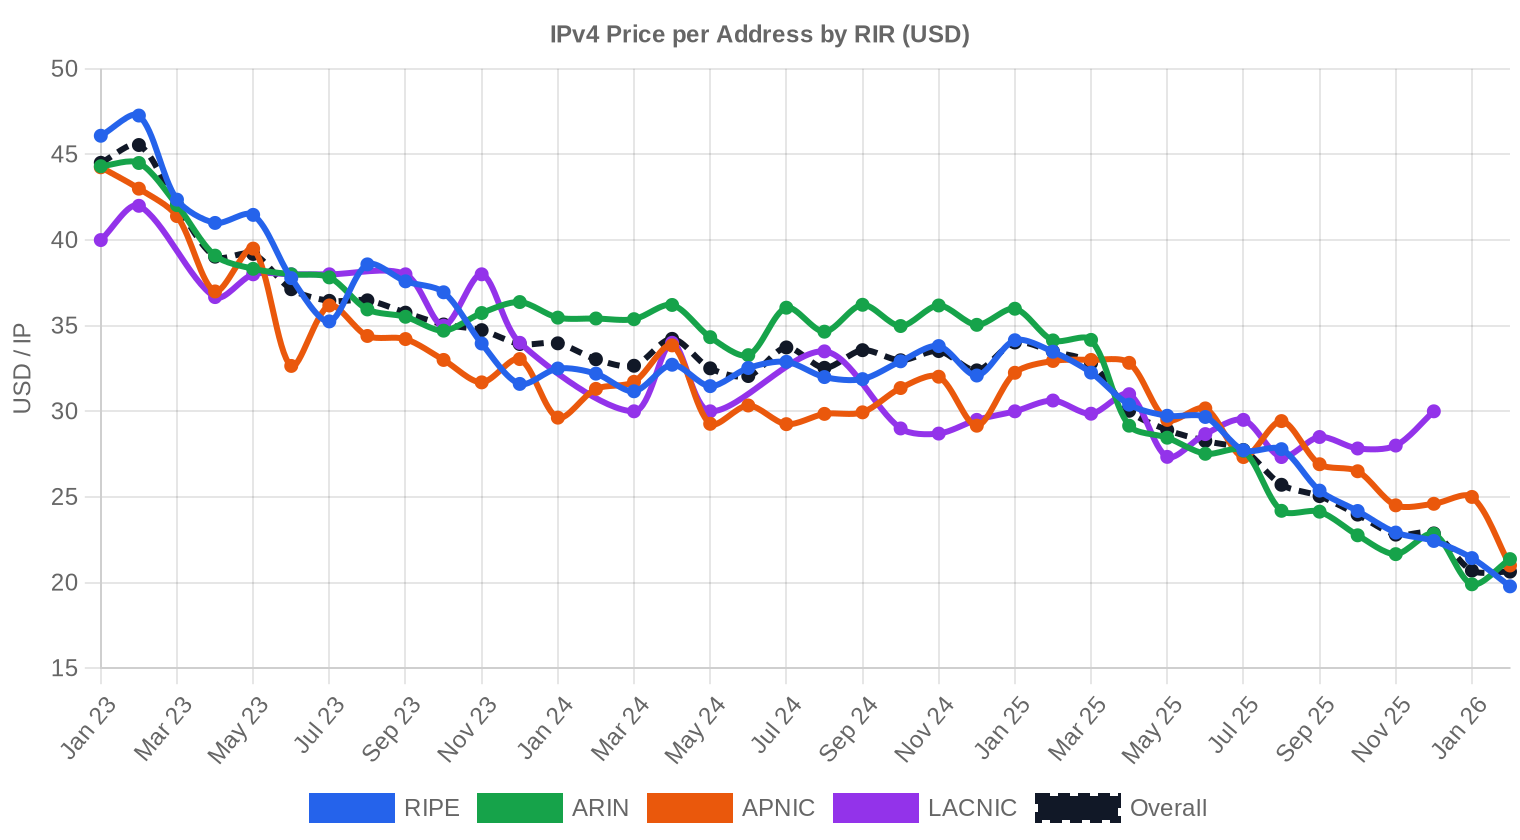
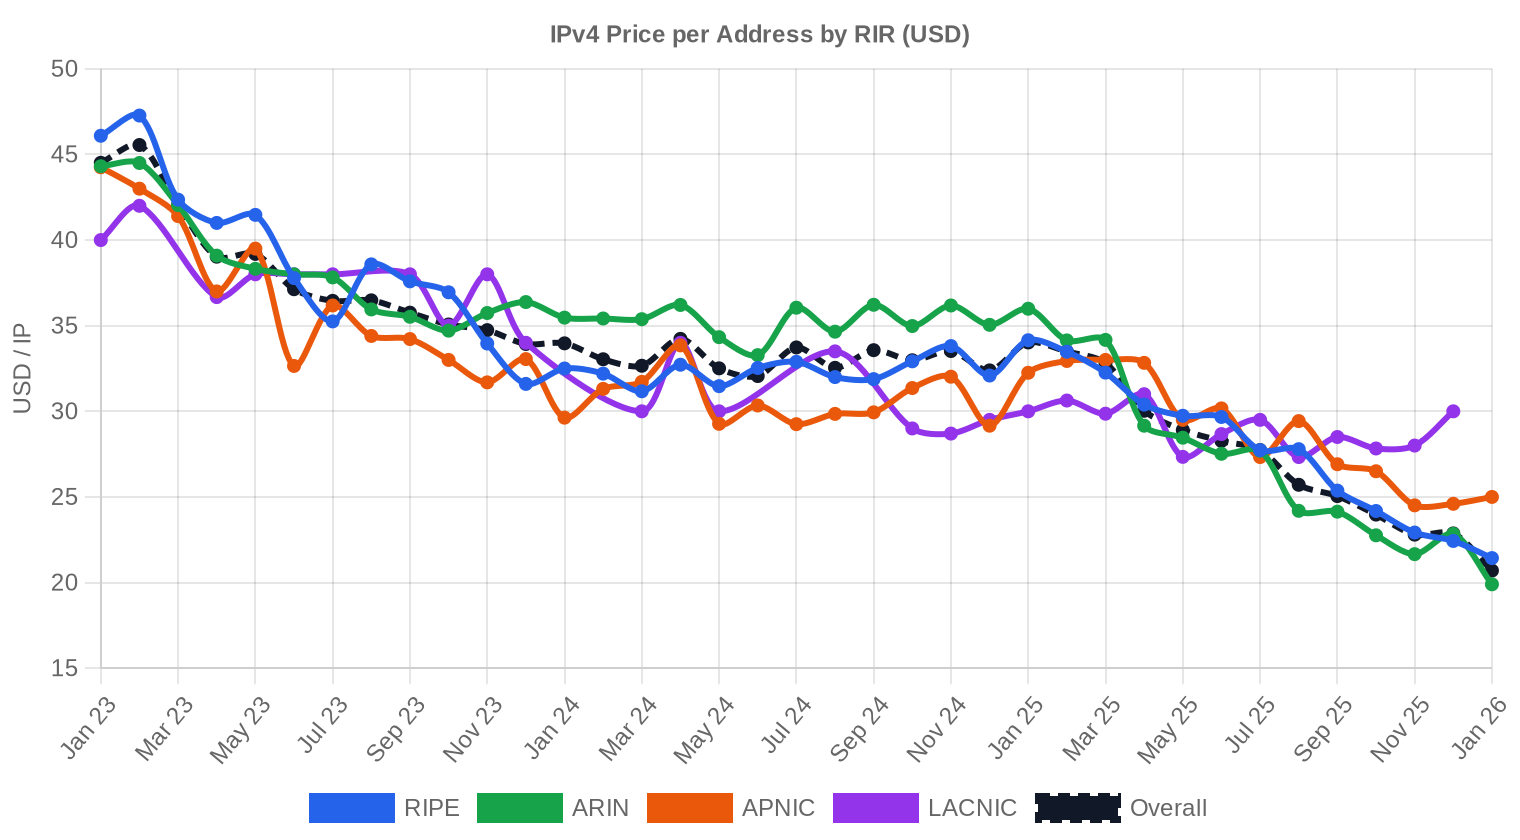
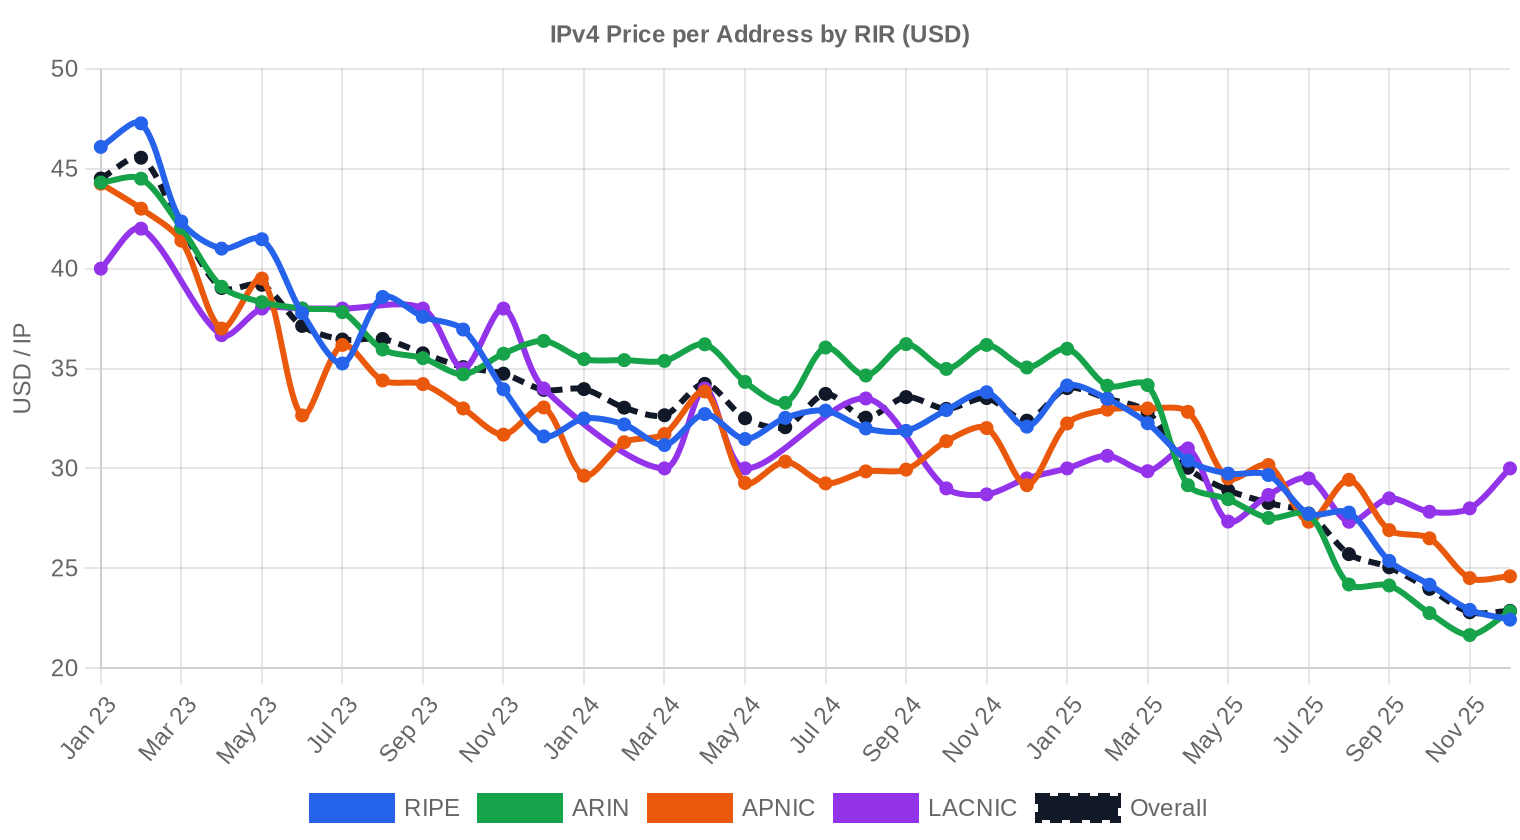
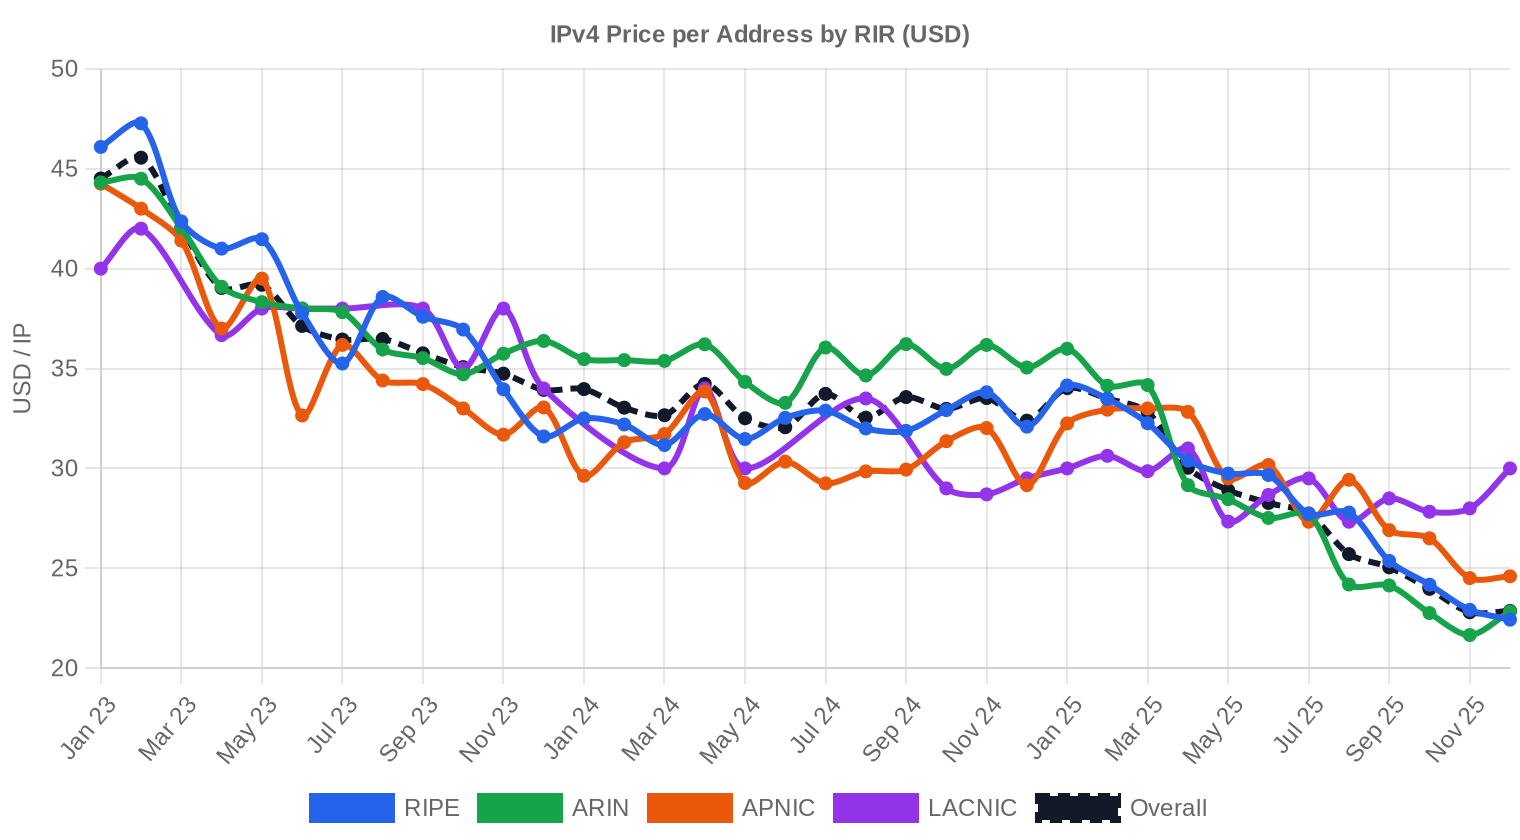
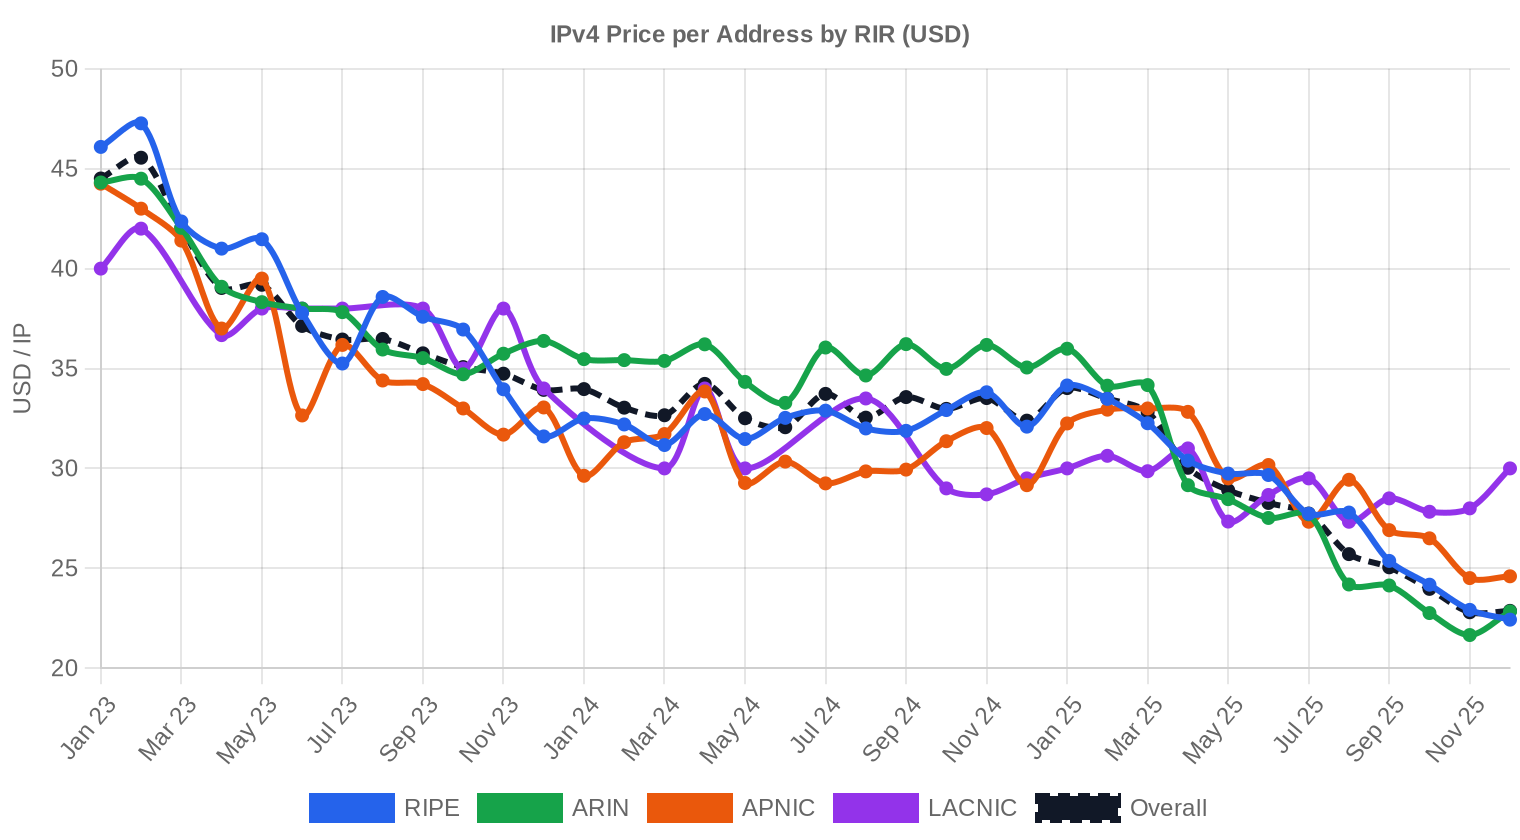
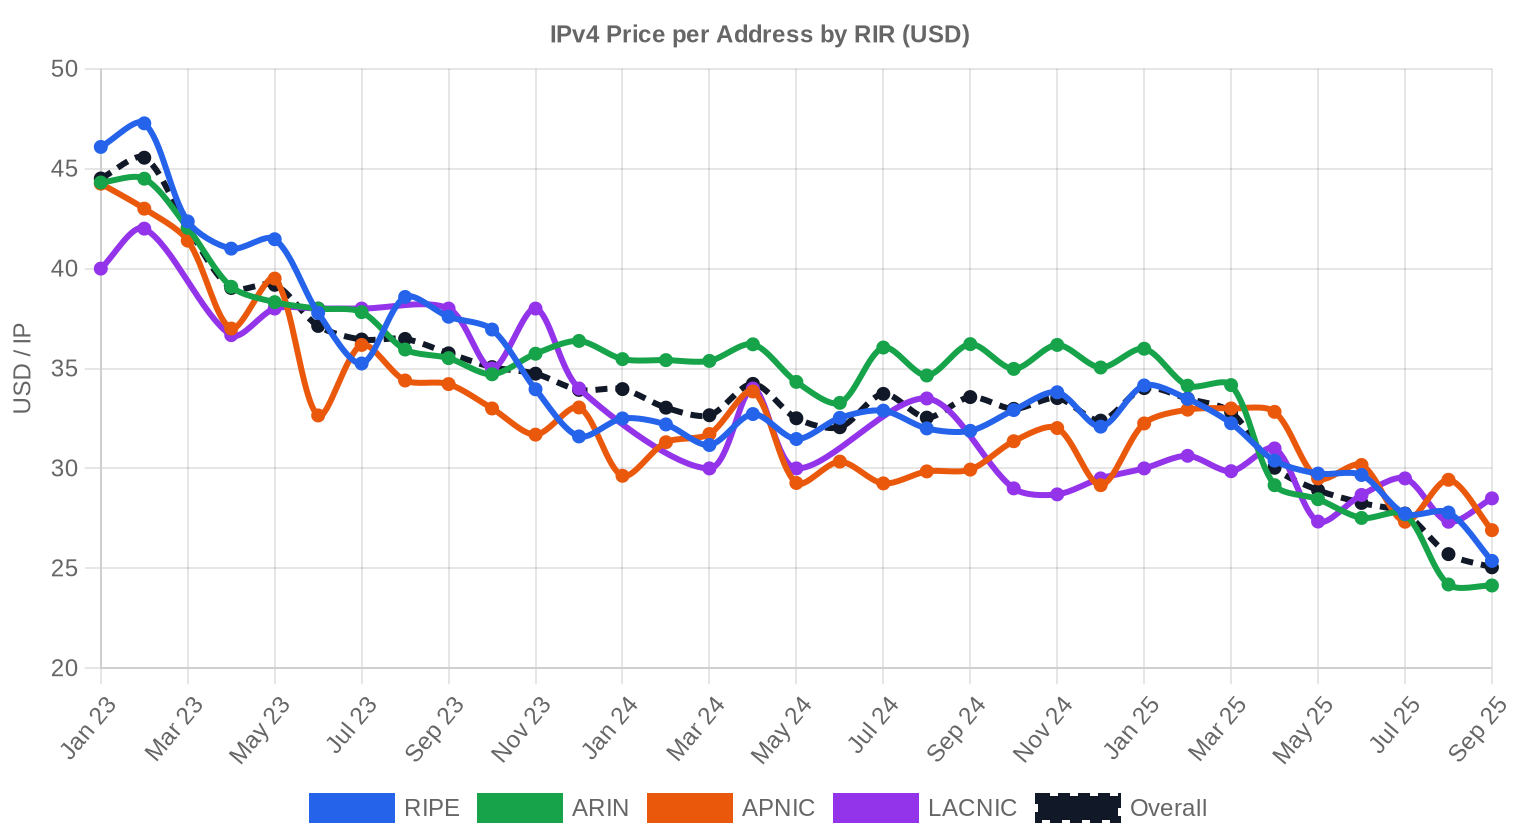
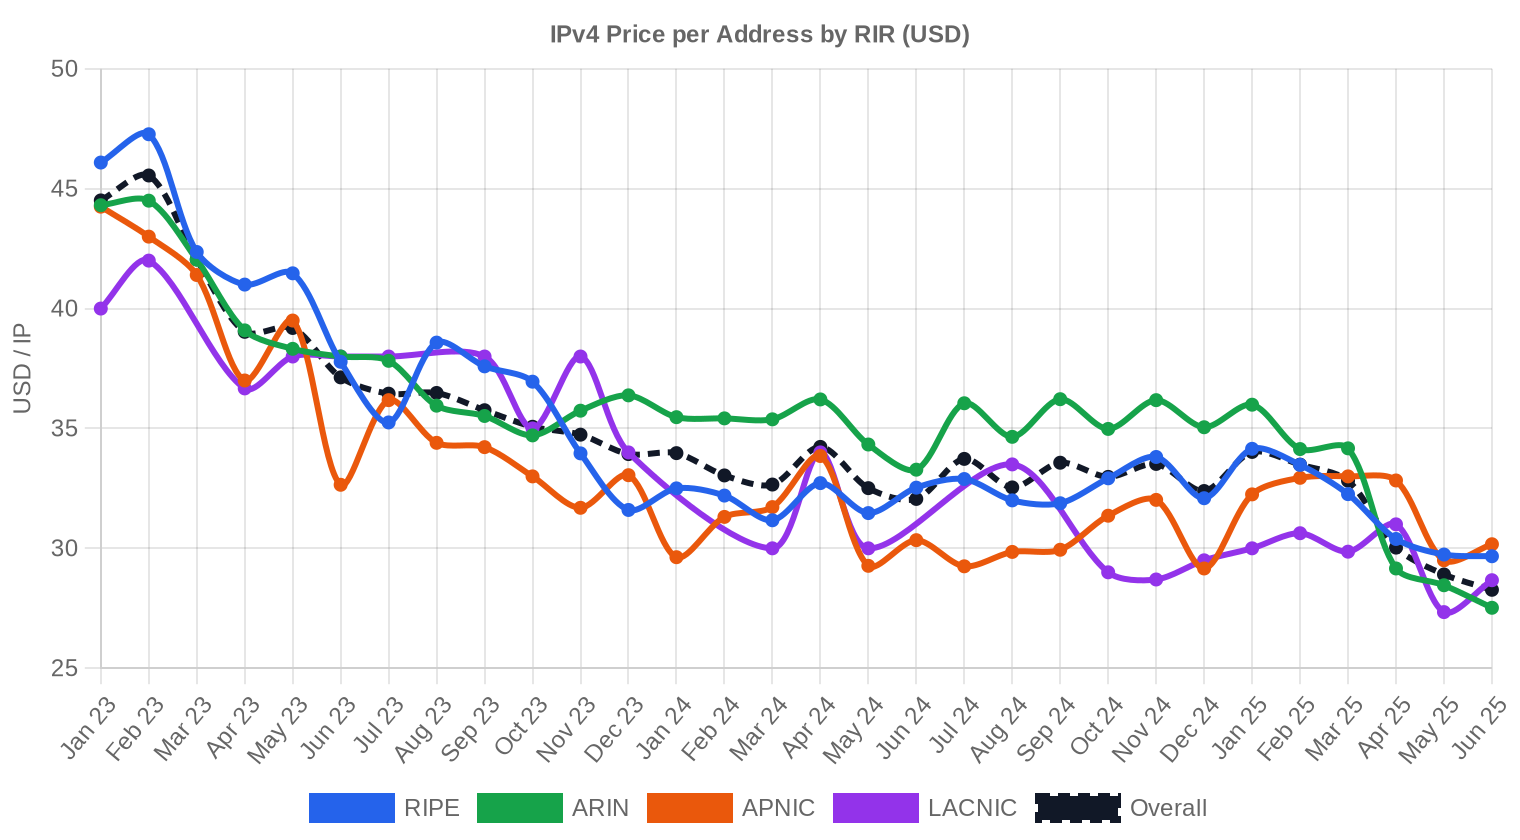
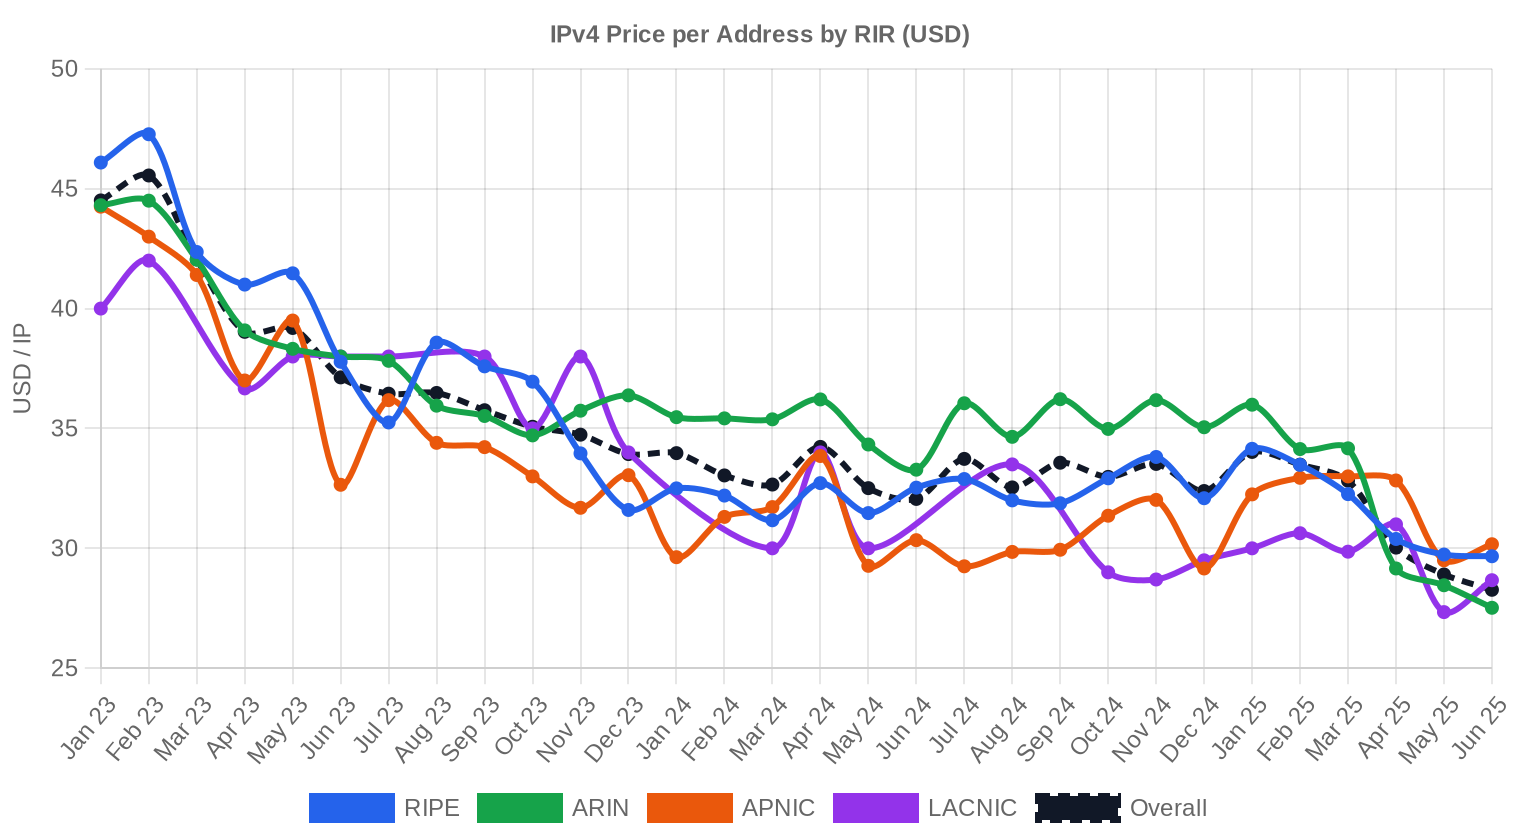
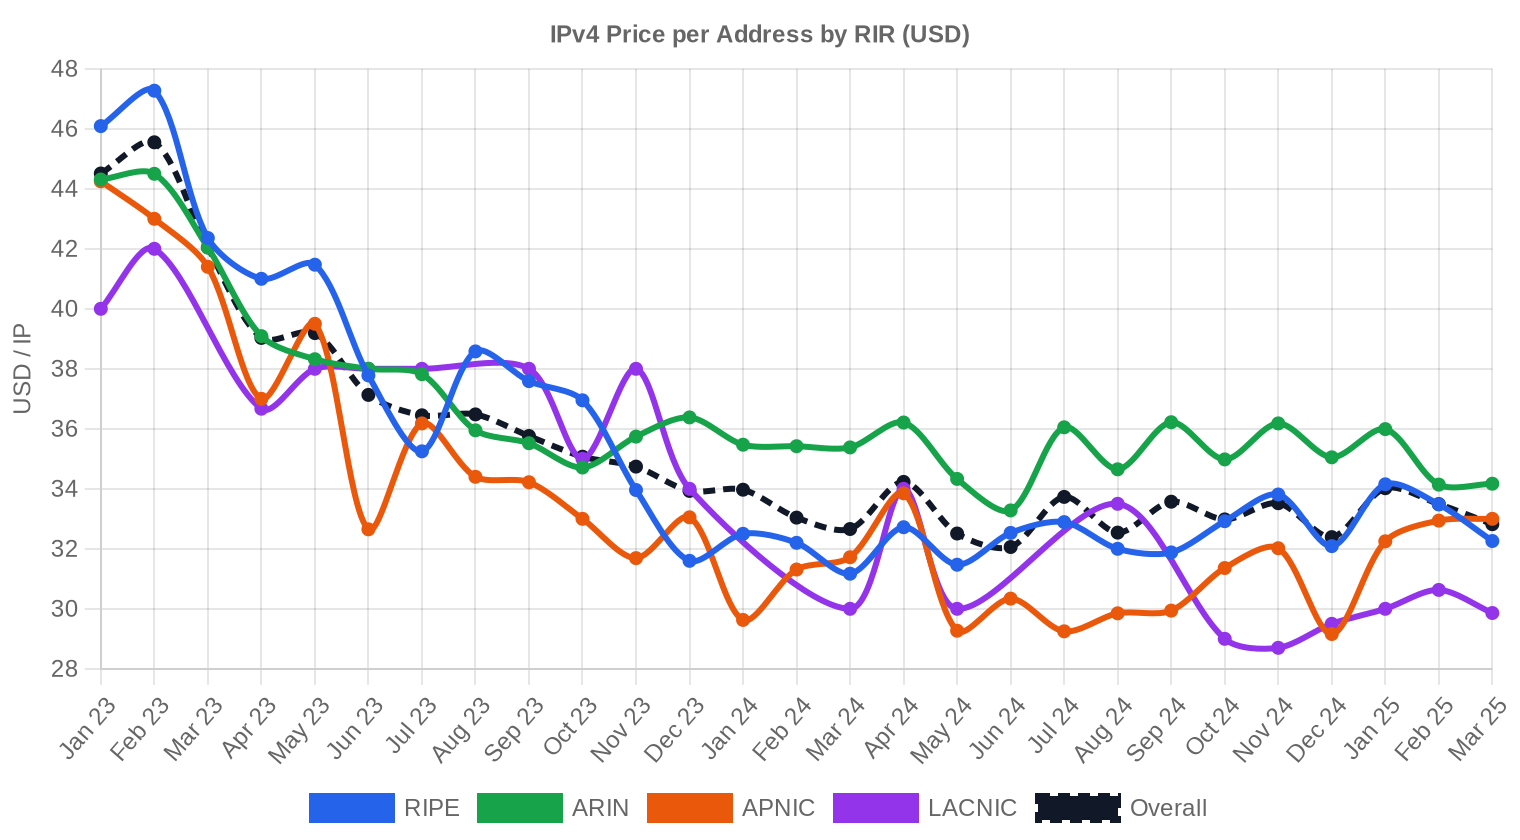
Prices ranged from $13 to $44 per IP in October, a $31 spread that reflects the persistent bifurcation between small APNIC blocks and large LACNIC lots. The $5.30 gap between the simple average ($20.84) and volume-weighted average ($15.54) is one of the widest we have tracked this year and points directly to a handful of large ARIN and LACNIC transactions pulling the volume-weighted figure down. The 3-month regression trend remains negative at -1.36%, and the median held flat at $21, right in line with where it has been since mid-Q3. Against the prior month, the $0.90 absolute increase looks like noise within a softening trend rather than a reversal — especially given the 13.1% annual decline.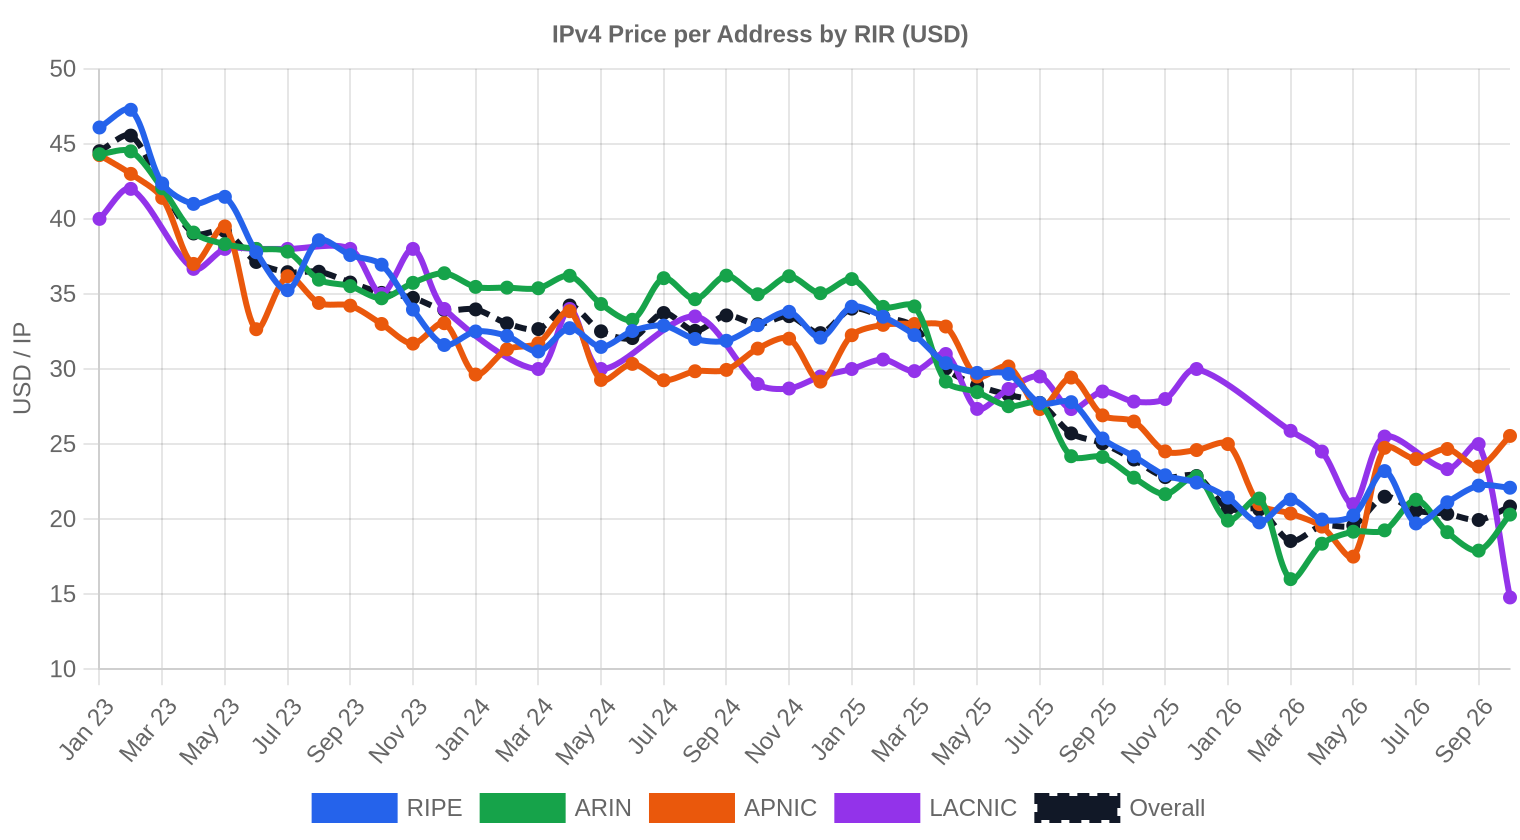
Pricing by RIR
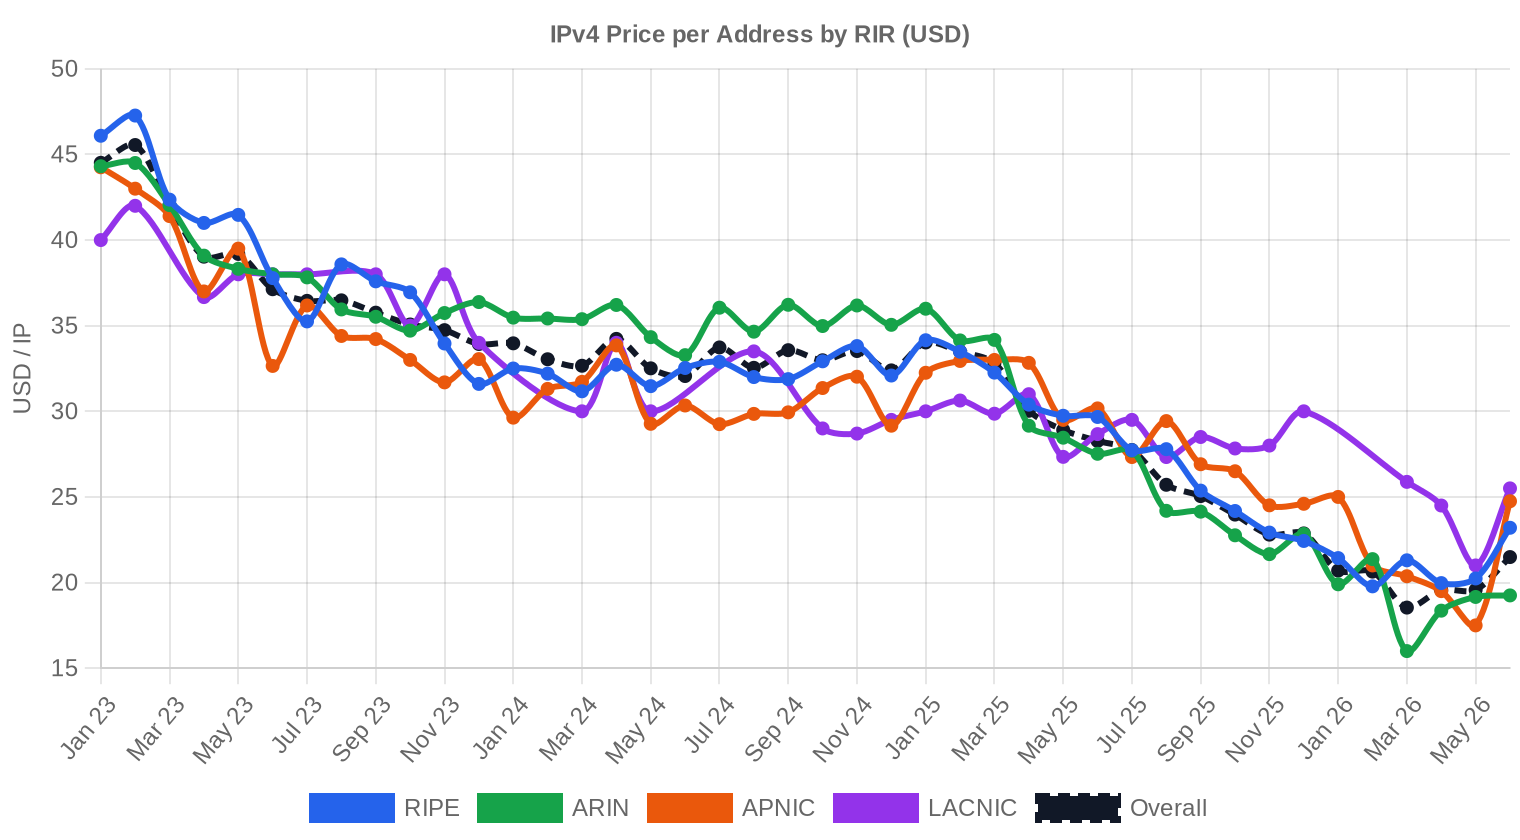
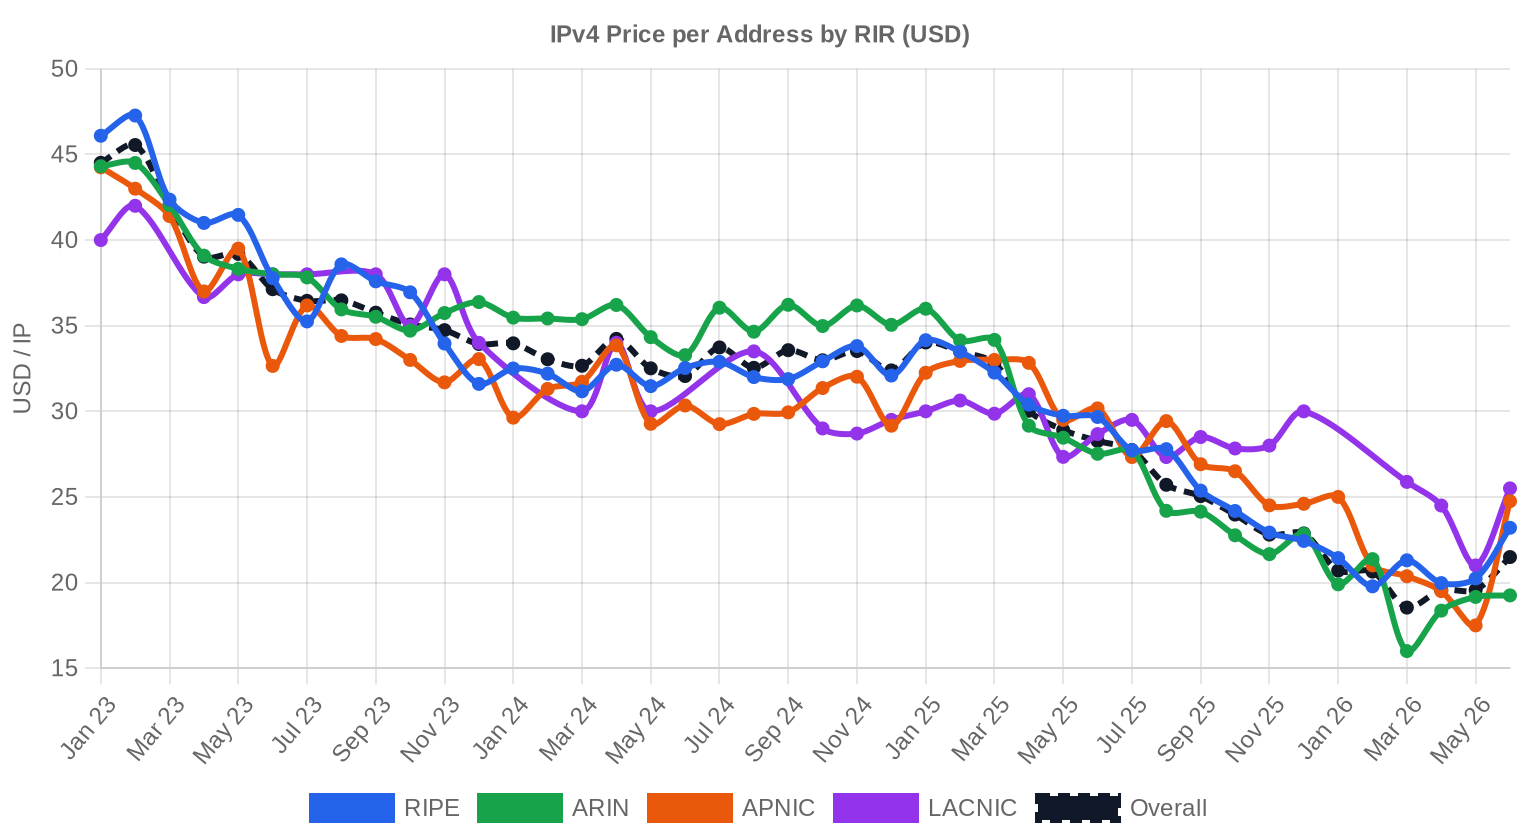
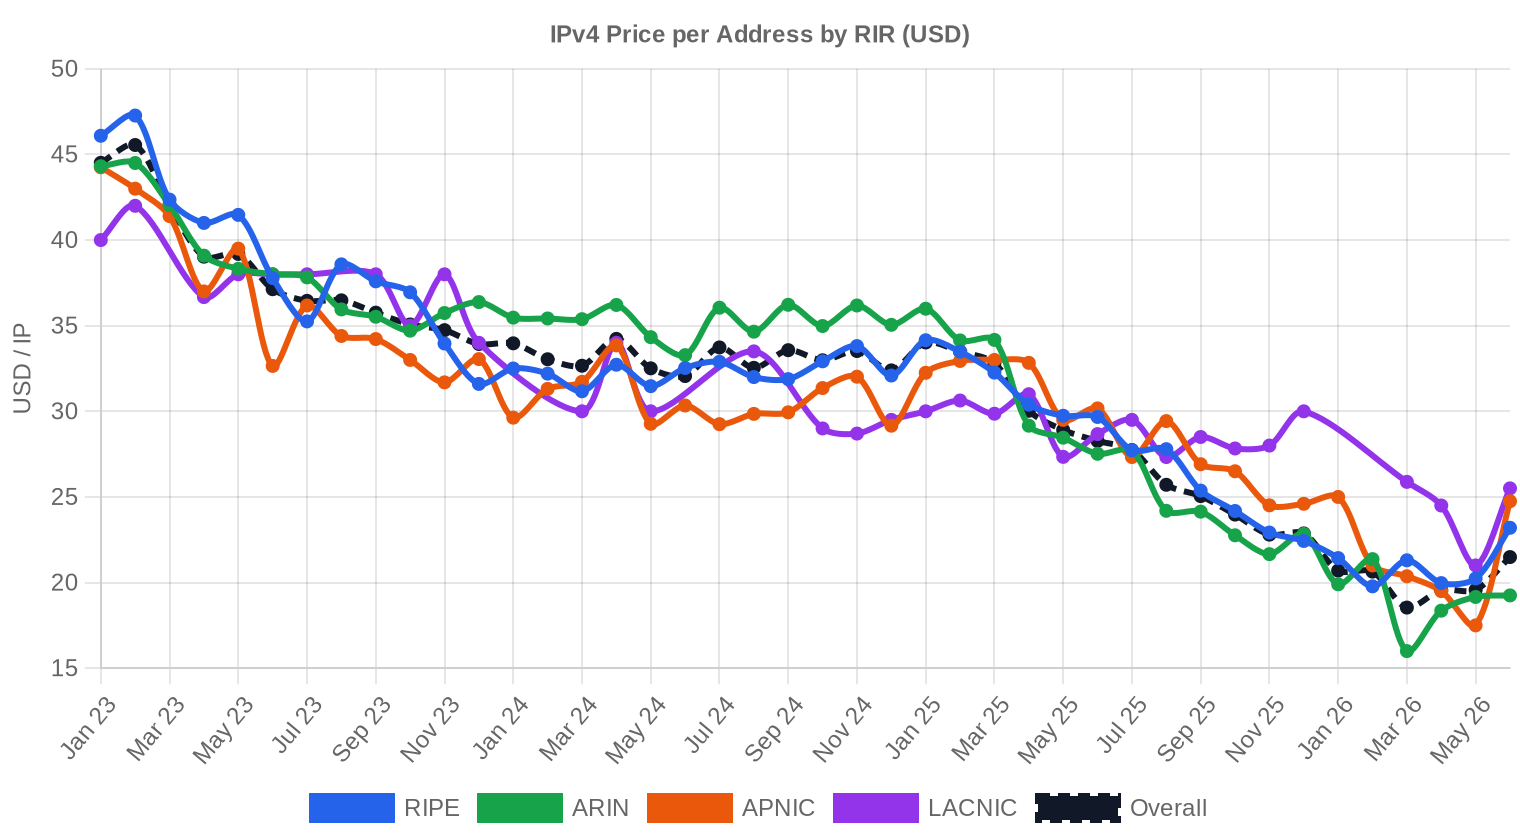
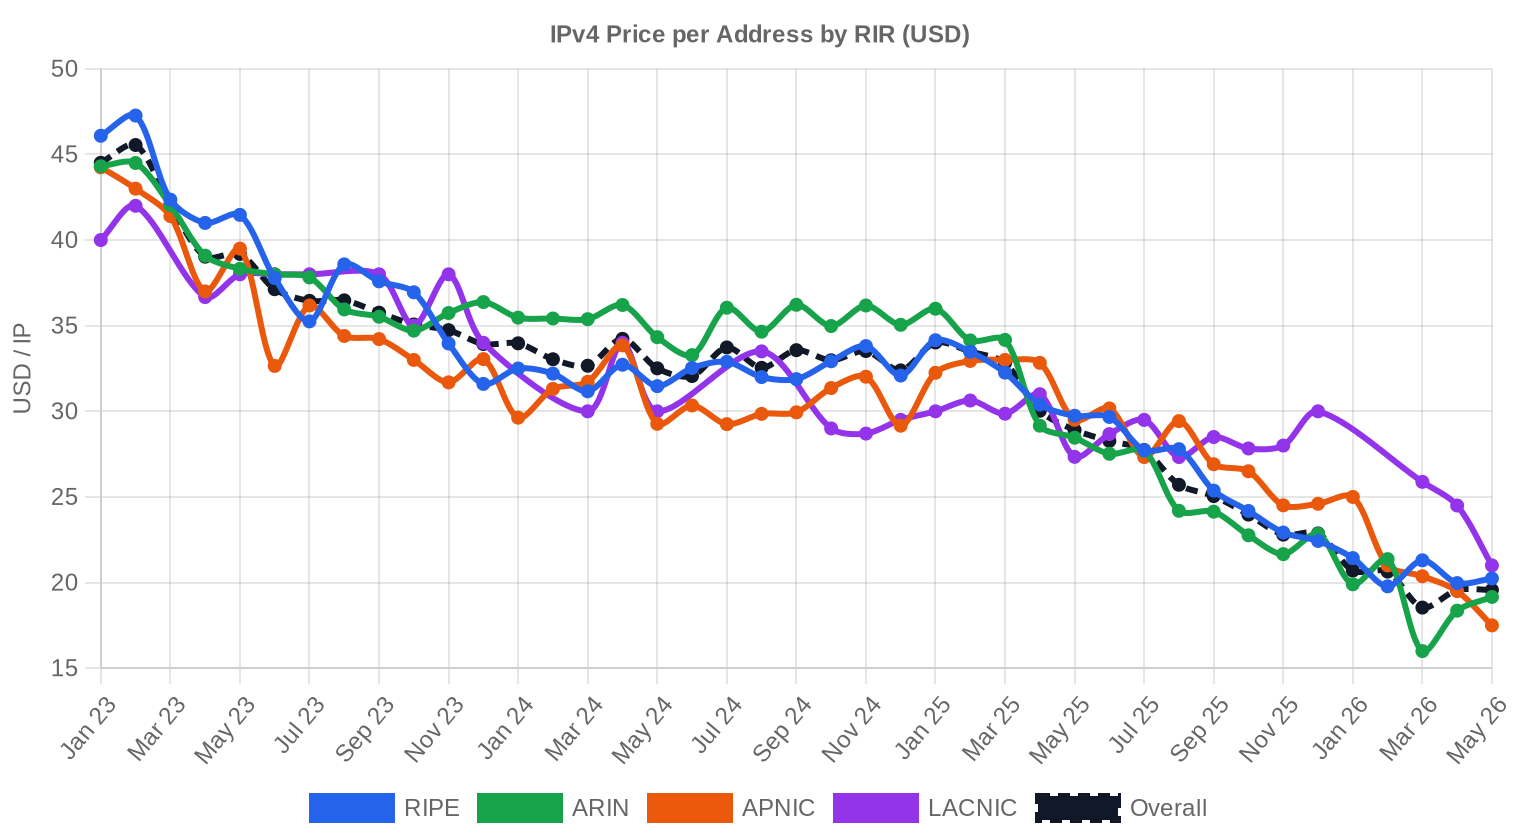
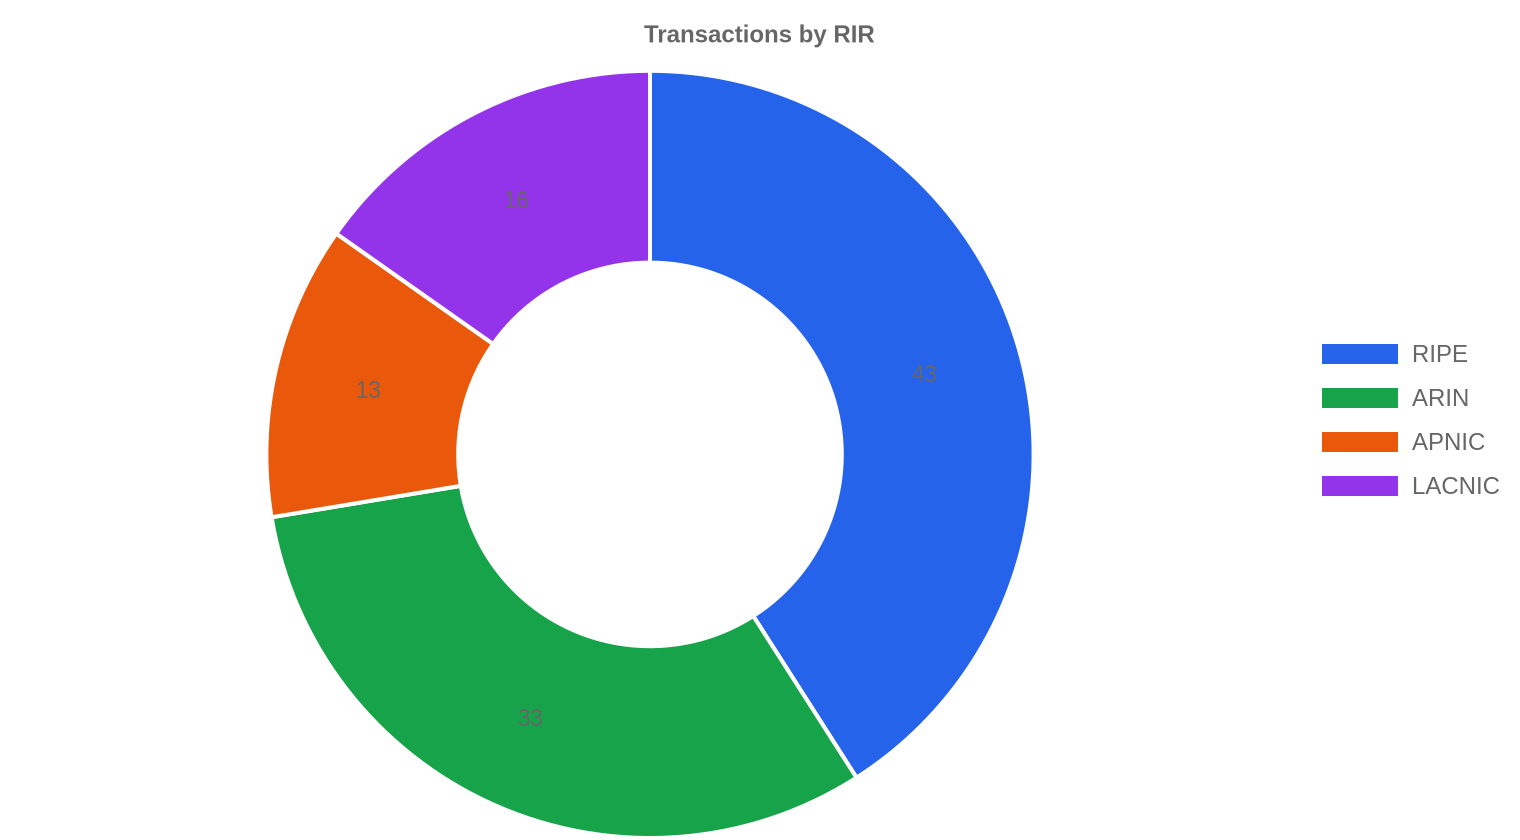
RIPE led on transaction count at 41% of deals (43 transactions) but took second place on IP volume at 34.8% of addresses moved. ARIN dominated volume with 48.9% of IPs transferred across just 33 deals, reflecting its skew toward larger block sizes — the average ARIN deal moved roughly 4,000 addresses. APNIC continues to command the steepest premiums at $25.54 average per IP, with a tight spread between its simple and volume-weighted averages ($25.54 vs. $24.91), evidence that small-block pricing in Asia-Pacific remains firm. LACNIC, at $14.78 average, sits 29.1% below the market-wide mean — but that discount may be compressing. Market observations indicate that 15 or more /16 LACNIC-origin blocks are actively moving toward ARIN, RIPE, and APNIC registries, with the first cross-RIR transfer completing in roughly 60 business days and a target turnaround of 6–8 weeks. If that timeline becomes repeatable, the historical liquidity penalty on LACNIC space should narrow.RIPE: $22.09 per IP across 43 transactions (34.8% of IP volume).
ARIN: $20.30 per IP across 33 transactions (48.9% of IP volume).
APNIC: $25.54 per IP across 13 transactions (2.7% of IP volume).
LACNIC: $14.78 per IP across 16 transactions (13.7% of IP volume).
AFRINIC: No recorded transactions.
| RIR | Transactions | Avg $/IP | Median $/IP | IPs Traded | RIR Transfers | Next Month (proj.) | Year-End (proj.) |
|---|---|---|---|---|---|---|---|
| RIPE | 43 | $22.09 | $22.00 | 93,696 | 538 | $21.50 | $21.50 |
| ARIN | 33 | $20.30 | $19.00 | 131,840 | 141 | $18.50 | $18.50 |
| APNIC | 13 | $25.54 | $24.50 | 7,168 | 0 | $24.50 | $24.50 |
| LACNIC | 16 | $14.78 | $13.00 | 36,864 | 0 | $18.00 | $19.00 |
Transaction Volume
Supply & Block Sizes
/24 blocks dominated with 41 transactions — 39% of all deals — at a median $24.89 per IP. The /24 premium over larger blocks persists: a /21 median of $13 per IP represents a 48% discount to /24 pricing on a per-address basis, rewarding buyers willing to purchase in quantity. The /22 segment showed notable strength, with a 13.7% three-month price increase to a $20.06 median, likely driven by mid-market ISP and enterprise buyers who need more than 256 addresses but cannot absorb a /20.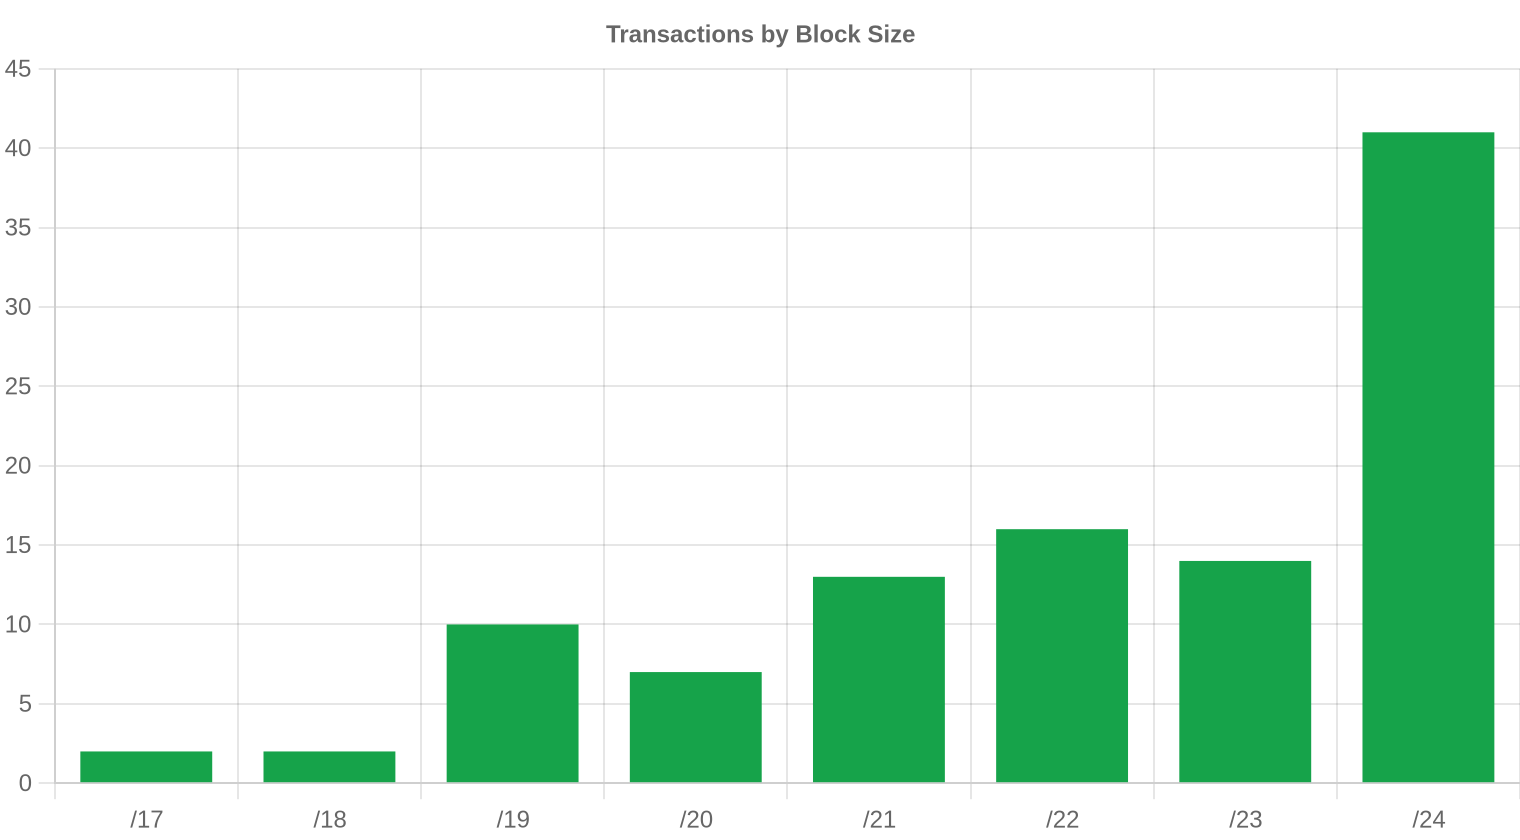
Geographic Activity
The United States accounted for 32 transactions, followed by Brazil with 13 and the United Kingdom with 8. Spain (7) and Finland (5) rounded out the top five. Brazil's strong showing aligns with the LACNIC cross-RIR transfer activity, as holders of Brazilian-origin blocks move inventory to registries with deeper buyer pools.Registry Transfer Activity
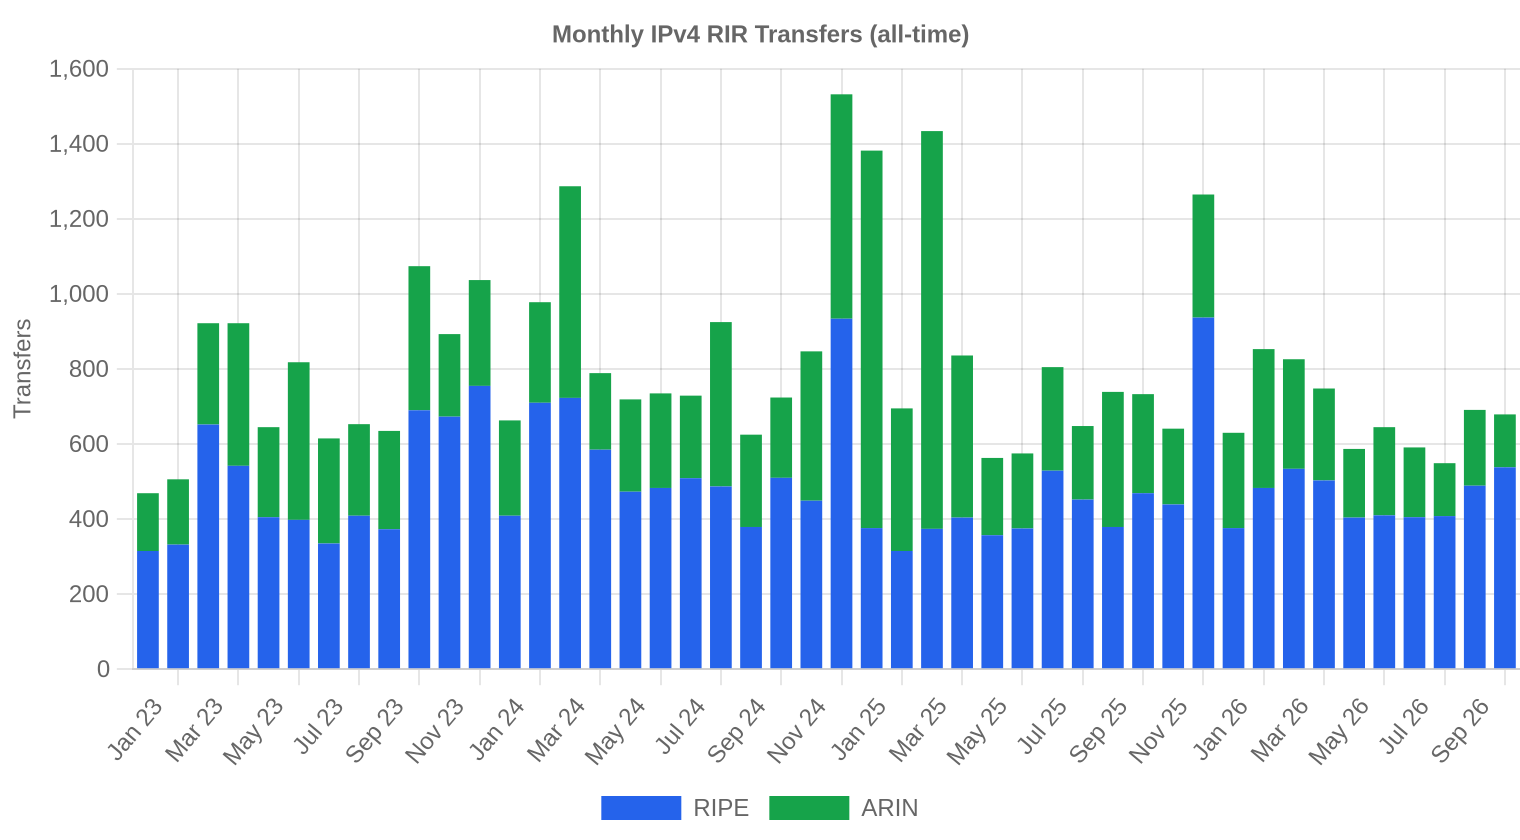
Official RIR transfer records logged 679 transfers in October, with RIPE accounting for the bulk at 538. ARIN recorded 141 transfers. APNIC, LACNIC, and AFRINIC reported zero registered transfers for the period, though commercial transactions in those regions clearly occurred — the gap reflects reporting lags and policy differences across registries.Long-Run Transfer Trends
Over the 46-month tracking window, cumulative RIR-recorded transfers stand at 36,857. RIPE holds 61% of that historical total versus ARIN's 39%. The all-time peak month was December 2024, a period that coincided with year-end balance-sheet optimization and pre-2025 budget deployment. October 2026's 679 transfers sit comfortably within the normal band but well off that peak.| RIR | RIR Transfers |
|---|---|
| RIPE | 22,486 |
| ARIN | 14,371 |
| RIR Transfers | 36,857 |
Outlook & Forecast
Forecasting each block-size band and RIR separately with our AI model:
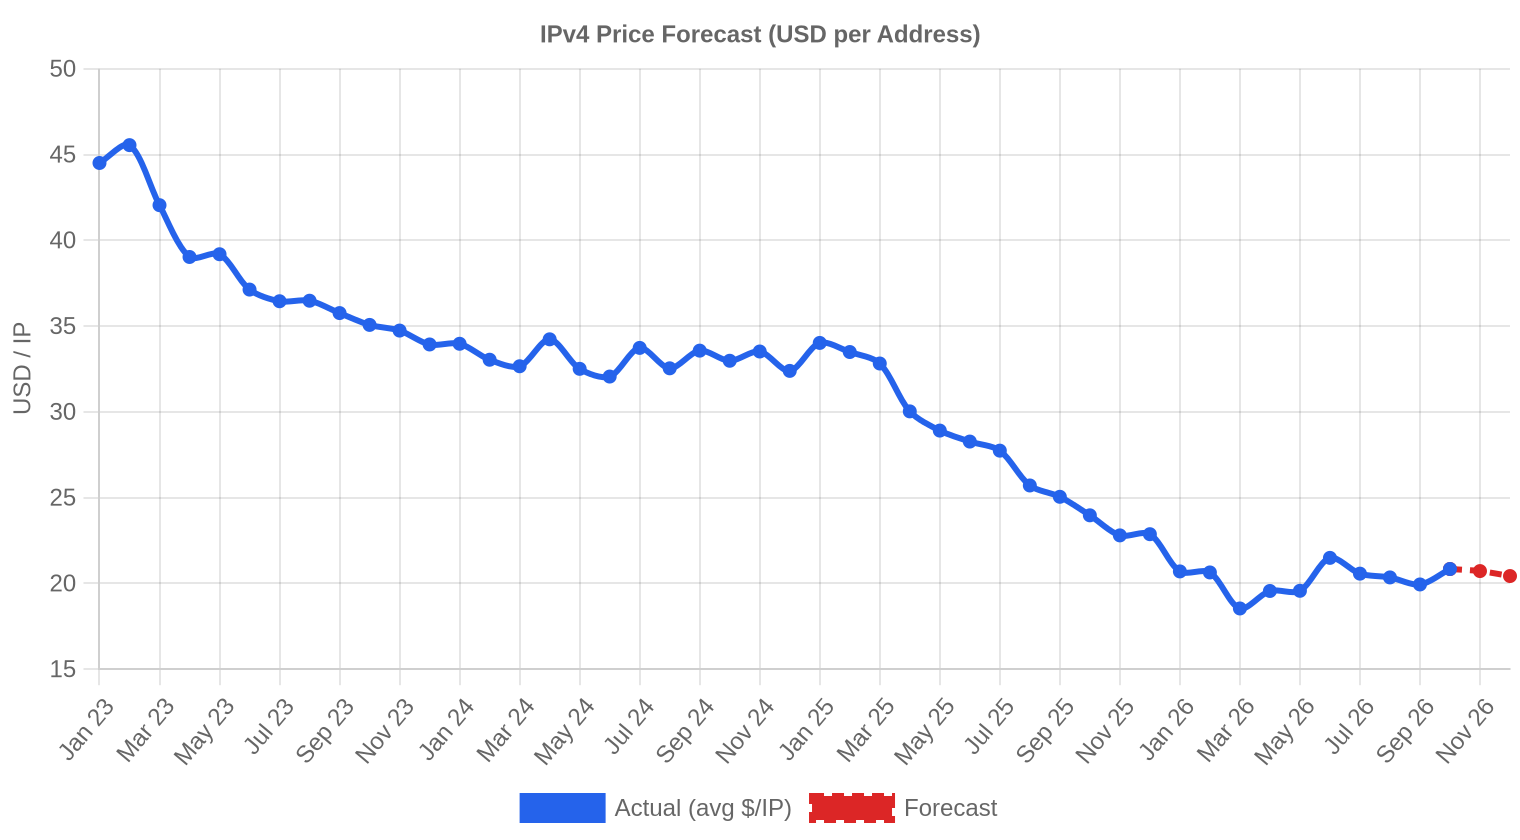
The overall average price per IP is projected to reach $20.43 by December 2026, with a next-month estimate of $20.49 per IP.
- RIPE: projected at $21.50 per IP next month, trending toward $21.50 by December 2026.
- ARIN: projected at $18.50 per IP next month, trending toward $18.50 by December 2026.
- APNIC: projected at $24.50 per IP next month, trending toward $24.50 by December 2026.
- LACNIC: projected at $18.00 per IP next month, trending toward $19.00 by December 2026.
- AFRINIC: insufficient data for a reliable forecast.
Forecast by Block Size
| Block | Current $/IP | Next Month | Year-End | Confidence |
|---|---|---|---|---|
| /24 | $24.89 | $25.00 (+0.4%) | $24.50 (-1.6%) | high |
| /23 | $21.74 | $21.50 (-1.1%) | $21.50 (-1.1%) | medium |
| /22 | $20.06 | $20.00 (-0.3%) | $20.50 (+2.2%) | medium |
| /21 | $13.00 | $15.50 (+19.2%) | $15.50 (+19.2%) | low |
| /20 | $13.00 | $14.50 (+11.5%) | $15.00 (+15.4%) | low |
| /19 | $14.75 | $14.50 (-1.7%) | $14.75 (0.0%) | medium |
| /18-/16 | $14.25 | $14.00 (-1.8%) | $14.25 (0.0%) | medium |
| /15-up | $10.00 | $10.00 (0.0%) | $9.75 (-2.5%) | low |
Editor's Take: Buy vs. Lease
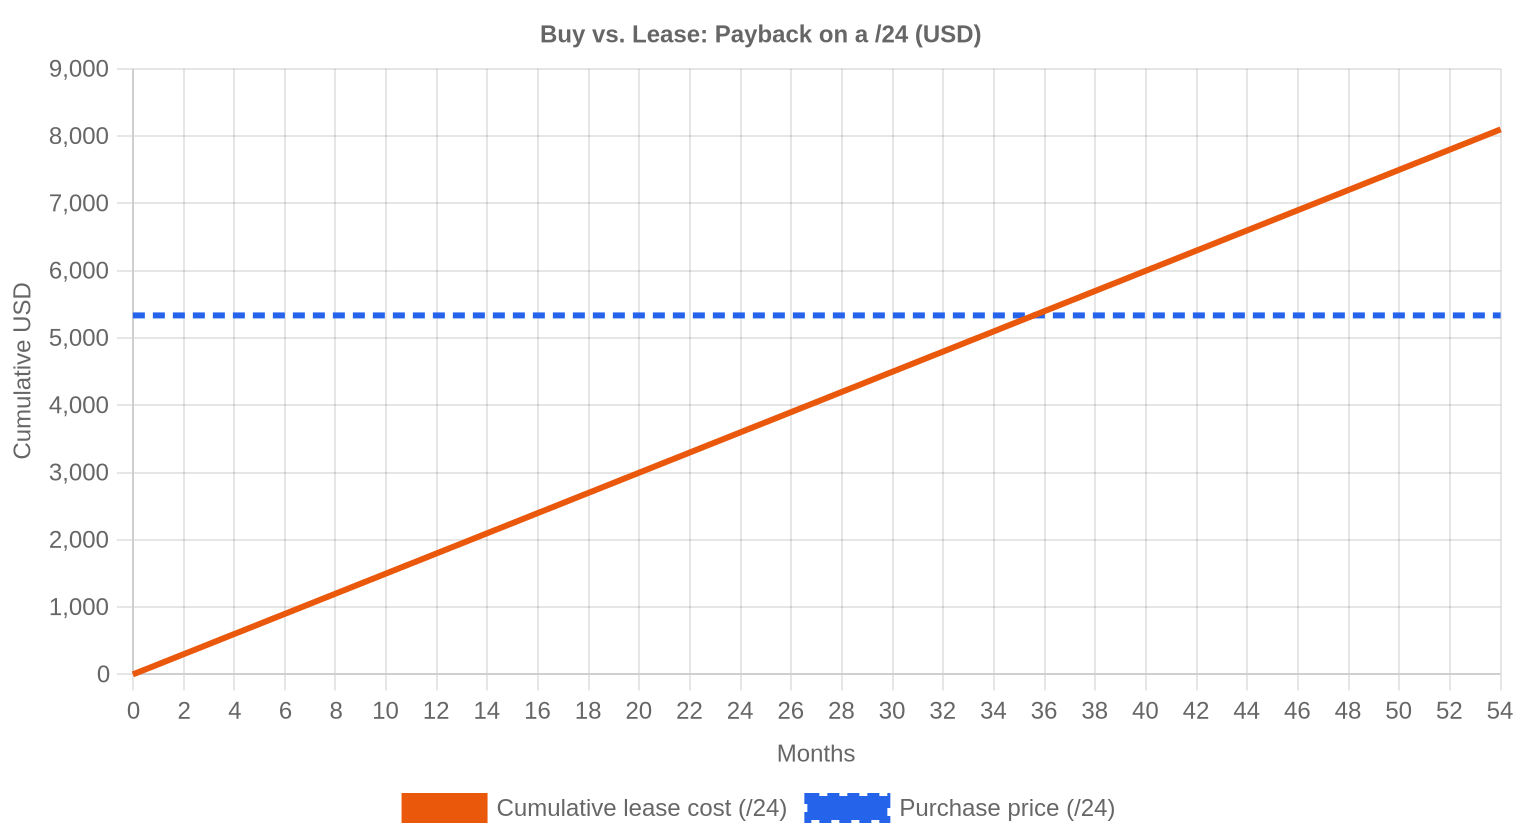
At $20.84 per IP purchase price versus $0.5859 monthly lease cost, the buy-versus-lease breakeven sits at 35.6 months — just under three years. That is well inside our 90-month threshold, making outright purchase the clear value play for any buyer with a planning horizon beyond 2029. The implied annual yield for block holders leasing at current rates is 33.7%, a figure that dwarfs conventional fixed-income returns and most real estate cap rates. For a /24, the math is straightforward: $5,335 to buy versus $150 per month to lease. Buyers who expect to hold addresses for five-plus years should purchase. Lessees paying $150 per month for a /24 will have spent more than the purchase price in under three years. The improving LACNIC transfer pipeline — where cross-RIR transfers are targeting 6–8 week closings — may create short-term buying opportunities in larger blocks as sellers accelerate capital turnover through faster deal cycles.| /24 Purchase price | $5,335 |
| /24 Lease price | $150 / mo |
| Payback period | 35.6 mo (3.0 yr) |
| Gross annual yield | 33.7% |
What This Means for You
Buyers: The 13.1% year-over-year price decline and a stable forecast through year-end mean urgency is low. Mid-size blocks (/22 and /21) offer the best per-IP value, and the LACNIC arbitrage — blocks priced at $14.78 average that can be transferred to ARIN or RIPE — deserves serious attention given improving transfer timelines.Sellers: Pricing momentum is gently negative. Holders sitting on RIPE or ARIN blocks above /20 should consider whether the 33.7% lease yield is more attractive than liquidation into a declining price trend. LACNIC sellers, specifically, now have a faster path to global buyers.
Leasers: At $0.5859 per IP per month, leasing remains expensive relative to purchase. Any lessee with a three-year or longer need is overpaying. Lease rates have not adjusted downward as fast as purchase prices, creating a widening gap that favors ownership.
Block holders: The yield math is compelling. A /24 generating $1,800 annually against a $5,335 asset value is a 33.7% return. That will attract capital until lease rates compress or purchase prices rise — neither of which appears imminent.
Browse verified IPv4 blocksSell IPv4 →
List your blocks with managed transferLease IPv4 →
Flexible short-term capacityLease Out IPv4 →
Turn idle blocks into recurring revenue
IPv4 Pricing by Block Size
/24 blocks remain the most expensive per IP at a $24.89 median, down 3.3% over three months. At the other end, /21 blocks cratered 23.5% over three months to a $13 median, and /20s dropped 13.3% to the same $13 level — a clear signal that larger-block buyers have pricing leverage right now. The /22 segment bucked the trend, rising 13.7% to $20.06, suggesting competition for that mid-range allocation size. APNIC /24s topped out at $44 per IP; LACNIC blocks floored at $13.| Block | IPs | Buy: /IP | Buy: Total | Lease: /IP/mo | Lease: Monthly |
|---|---|---|---|---|---|
| /24 | 256 | $24.89 | $6,372 | $0.59 | $150 |
| /22 | 1,024 | $20.06 | $20,541 | $0.59 | $600 |
| /20 | 4,096 | $13.00 | $53,248 | $1.95 | $8,000 |
| /18-/16 | 16,384-65,536 | $14.25 | $233,472-933,888 | $0.59 | $9,599-38,398 |
IPv4 Price History: 2011–2026
IPv4 pricing effectively began in 2011 following IANA free-pool exhaustion and spent a decade climbing, peaking near $60 per IP for small blocks in late 2023. AWS's decision to charge $0.005 per hour for public IPv4 addresses (roughly $43.80 annually) in early 2024 triggered demand destruction among cloud-native buyers, and prices have been resetting since. October 2026's $20.84 average represents a market that has found a new equilibrium well below peak levels but far above the sub-$10 era of 2015–2018. The bifurcation between small-block premiums and large-block discounts continues to widen, making "the IPv4 price" increasingly meaningless as a single metric.| Year | ~Price/IP | Key Event |
|---|---|---|
| 2011 | $7-12 | IANA free pool exhausted; Microsoft/Nortel deal ($11.25/IP) |
| 2012 | $8-12 | RIPE NCC reaches last /8; begins /22-only allocation |
| 2014 | $10-15 | LACNIC free pool exhausted |
| 2015 | $8-15 | ARIN free pool exhausted |
| 2017-18 | $12-18 | Leasing market grows; cloud demand rises |
| 2019 | $18-24 | RIPE NCC exhausts remaining free pool |
| 2021-22 | $50-60+ | Post-pandemic peak; hyperscaler build-outs |
| 2024 | $35-52 | AWS IPv4 charge ($0.005/IP/hr); large block correction |
| 2025-26 | $18-45 | Market bifurcation; /16s below $20 for first time since 2019 |
Market Structure: Who Is Buying & Selling
Buyers are predominantly ISPs expanding fixed and mobile networks, cloud and hosting providers building out capacity, and — increasingly — AI infrastructure operators requiring dedicated address space for training and inference clusters. Sellers remain largely legacy allocation holders and corporate IT departments shedding unused space as they migrate workloads to cloud environments. Broker-facilitated transactions continue to dominate; direct bilateral deals are rare outside the /16-and-larger segment.IPv4 vs. Other Asset Classes
At a 33.7% implied annual yield on leased IPv4 blocks, the asset class outperforms investment-grade corporate bonds (yielding 5–6%), commercial real estate (6–8% cap rates), and the S&P 500's long-run average return (~10%). The risk profile is different — IPv4 carries regulatory, technological obsolescence, and liquidity risks — but the yield premium is wide enough to compensate. For institutional investors, IPv4 blocks function like a toll-road concession: finite capacity, essential infrastructure, predictable cash flow.| Asset Class | Typical Yield | Liquidity | Primary Risk |
|---|---|---|---|
| IPv4 | 33.7% | Moderate | IPv6 adoption, block quality |
| Commercial Real Estate | 5-8% | Low | Vacancy, rate cycle |
| Investment-Grade Bonds | 4-5% | High | Duration, credit risk |
| S&P 500 | ~1,3% | High | Market volatility |
| Money Market / T-Bills | ~4-5% | High | Rate cycle changes |
IPv6 Adoption & Why IPv4 Remains Essential
IPv6 adoption continues its glacial climb, with Google reporting roughly 45% of its traffic arriving over IPv6 globally. The gap, of course, varies enormously by country and network. The practical reality is that every commercial network still requires IPv4 connectivity, and dual-stack operation adds cost without eliminating IPv4 dependence. A full transition remains a multi-decade project, and the transfer market will exist for as long as IPv4 is required — which, based on current adoption curves, extends well into the 2030s.AI & Cloud Infrastructure Demand
AI infrastructure buildout continues to be a marginal demand driver for IPv4 address space. Training clusters and inference endpoints require routable addresses for API access, model serving, and inter-datacenter communication. While hyperscalers hold deep IPv4 reserves, second-tier AI companies — particularly those deploying GPU clusters in colocation facilities — are active buyers in the /22 to /20 range, contributing to the relative price firmness in those segments.What Determines IPv4 Block Value
Block value hinges on several factors beyond raw size. Clean blacklist history, age of allocation (older blocks are generally better-reputation), RIR of origin (ARIN and RIPE carry the highest liquidity), and ease of transfer all matter. LACNIC-origin blocks have historically traded at a discount due to longer transfer timelines, but as those timelines compress toward 6–8 weeks, the discount should narrow — a trend already visible in October's data.Sell vs. Lease: A Decision Framework
With lease yields at 33.7% and purchase prices declining year-over-year, leasing is the higher-return strategy for holders who do not need immediate liquidity. The breakeven at 35.6 months means a seller can earn back the block's current market value in under three years through leasing alone, then continue generating income. Selling makes sense primarily for holders who need capital now, face regulatory complications, or hold blocks with blacklist contamination that suppresses lease demand.| /24 Purchase price | $5,335 |
| /24 Lease price | $150 / mo |
| Payback period | 35.6 mo (3.0 yr) |
| Gross annual yield | 33.7% |
RIPE NCC 24-Month Transfer Restriction
RIPE NCC's 24-month holding requirement before re-transfer continues to constrain short-term speculation in European address space. The rule effectively locks supply, limiting flipping activity and creating a floor under RIPE pricing — the $22.09 average in October ran $1.79 above ARIN's $20.30. For buyers, the rule means due diligence on holding-period status is essential; acquiring a block that cannot be resold for 18 months carries meaningful illiquidity risk.Deal Size Distribution
The market is overwhelmingly small-ticket: 84 of 105 deals (80%) came in under $50,000, generating $1.26 million in total value. The 17 mid-tier deals ($50K–$250K) accounted for $2.30 million — more than half the month's value on 16% of transactions. Four deals in the $250K–$1M band contributed another $2.05 million. Zero transactions exceeded $1 million, and the average deal value of $39,896 was down sharply from September's $51,804 and a fraction of October 2025's $179,867 — a year-over-year decline that underscores both smaller block sizes in trade and lower unit pricing.Top Trading Countries
The US at 32 transactions continues to dominate, driven by hosting providers, ISPs, and enterprise cloud migration. Brazil's 13 deals — nearly all LACNIC-origin — reflect an active seller base taking advantage of improving cross-RIR transfer mechanics. The UK's 8 transactions align with its position as Europe's largest hosting market outside Germany, though German deal count (1) was surprisingly low this month.BEAD Broadband Program Impact
The $42.45 billion BEAD broadband program remains in its early deployment phase, and its IPv4 impact is still ahead of the market. As rural broadband buildouts accelerate through 2027, BEAD recipients — primarily mid-size ISPs — will need /20 to /18 blocks. Current pricing for those sizes ($13–$14.25 per IP) looks attractive relative to where demand pressure may push them once BEAD-funded networks go live.Hyperscaler IPv4 Holdings
Amazon, Microsoft, and Google collectively control millions of IPv4 addresses, and their allocation decisions ripple through the market. AWS's per-IP charge has dampened customer demand for public addresses, reducing pressure on the transfer market. Should any hyperscaler decide to monetize unused blocks — or, conversely, acquire aggressively for new regions — the pricing impact would be immediate and significant given the relatively thin secondary market.Macroeconomic Conditions & Market Impact
Interest rates across developed markets remain elevated relative to the 2020–2022 trough, keeping the cost of capital high for infrastructure investments including IPv4 purchases. Enterprise IT budgets for 2027 planning cycles appear stable, with modest growth projections favoring operational expenditure (leasing) over capital expenditure (purchasing) at the margin. That said, the buy-vs-lease math at current pricing so heavily favors buying that rate-sensitive CFOs should be running the 35.6-month breakeven calculation themselves.Model Update & Calibration
As part of our continuous improvement process, we backtested previous forecasts against realised prices and fine-tuned the model accordingly. Recent months now carry more influence than older data, and the confidence bands have been widened or narrowed based on how well they captured actual outcomes in the past. You can see the full backtest results in the table and chart below.
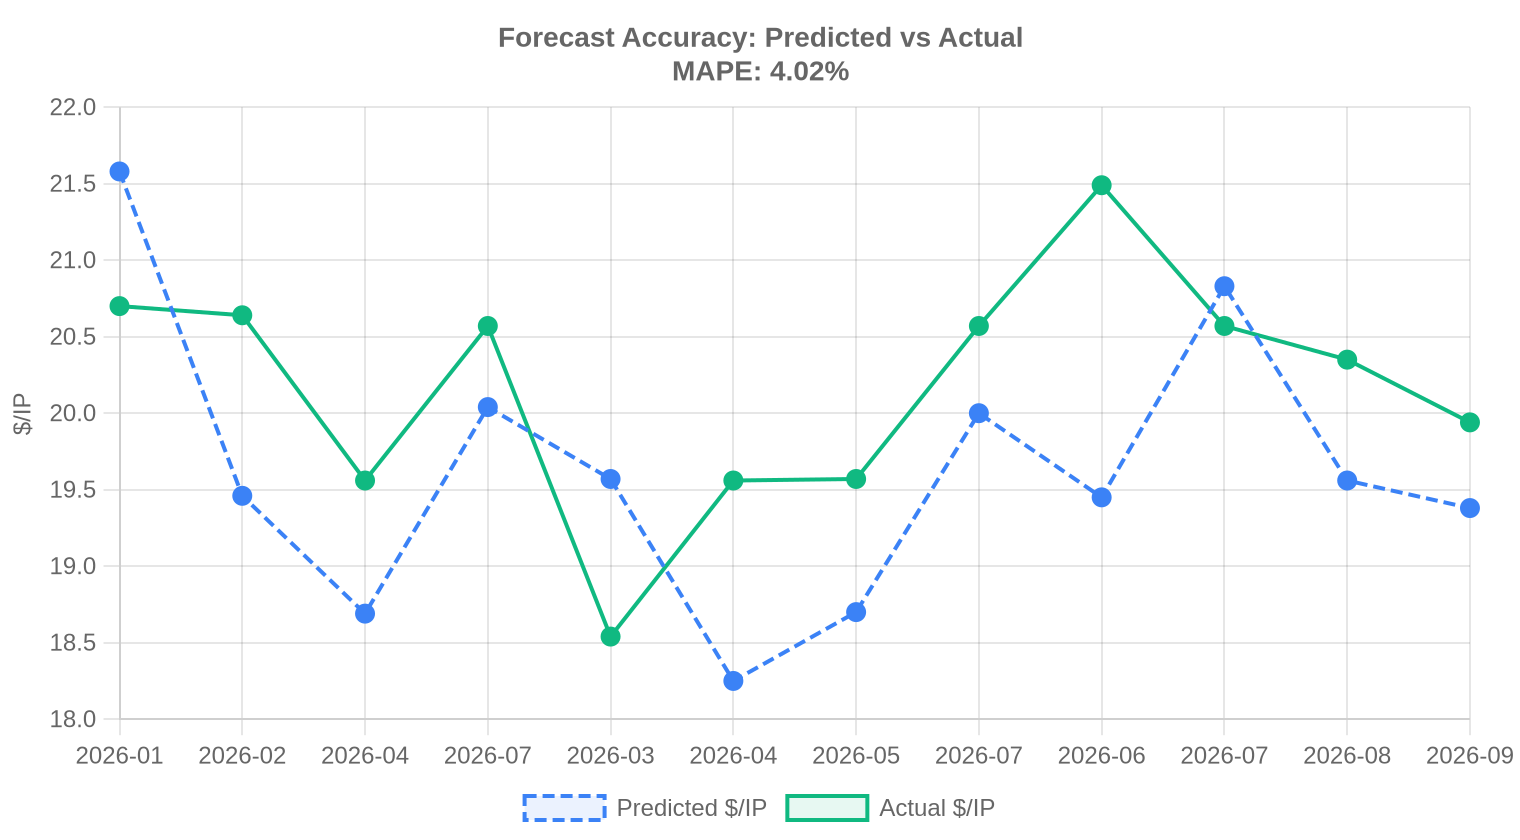
| Report Period | Target Month | Predicted | Actual | Deviation |
|---|---|---|---|---|
| 2026-04 | 2026-05 | $19 | $20 | -4% |
| 2026-Q2 | 2026-07 | $20 | $21 | -3% |
| 2026-05 | 2026-06 | $19 | $21 | -9% |
| 2026-06 | 2026-07 | $21 | $21 | +1% |
| 2026-07 | 2026-08 | $20 | $20 | -4% |
| 2026-08 | 2026-09 | $19 | $20 | -3% |
Methodology
Figures are based on completed IPv4Center marketplace transactions and RIR transfer statistics. Prices are in US dollars per IP address. Forecasts are produced by an AI model that analyses each block-size band and RIR segment separately (with outlier-trimmed medians) alongside known market catalysts; they are estimates, not guarantees.
Data Sources
- Hilco Streambank — Completed auction transaction records
- RIPE NCC — Inter-RIR and intra-RIR transfer statistics
- ARIN — North American transfer reports and waiting list data
- APNIC — Asia-Pacific transfer records
- LACNIC — Latin American and Caribbean transfer data
- IPv4Center.com — Proprietary marketplace transaction and lease pricing data
This report is generated automatically for informational purposes only and does not constitute financial advice.