21 min read
This report analyzes the IPv4 transfer market for Q3 2026, based on completed IPv4Center marketplace transactions and official RIR transfer records.
Executive Summary
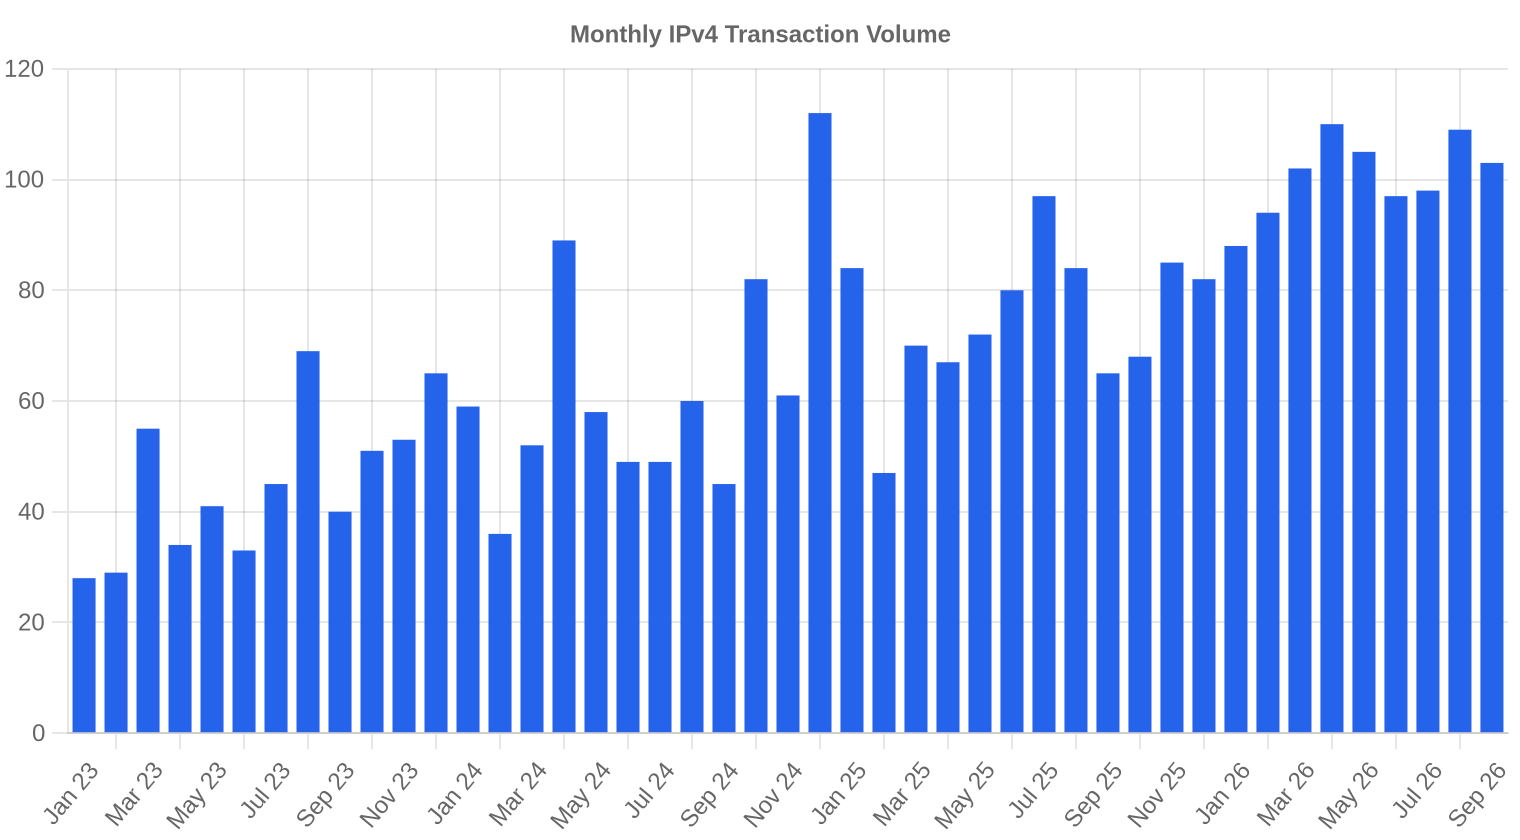
The IPv4 transfer market recorded 310 transactions in Q3 2026, moving 1,235,712 addresses at an average price of $20.30/IP and a median of $19.35/IP. Total market value reached $17.54 million. Prices ticked up $0.70 from Q2 2026 — a modest 0.5% sequential gain — but the year-over-year picture tells a different story: the Q3 average sits 22.9% below the $26.33 level posted in Q3 2025. Transaction volume fell 0.6% quarter-over-quarter, and average deal size compressed to roughly 56,585 IPs from 69,704 in Q2, suggesting the market is rotating toward smaller blocks. The long secular decline from 2024 peaks appears to have found a floor near $20, though the stabilization is fragile and price discovery remains bifurcated across registries.Market Overview
| Transactions | 310 |
| IP Addresses Traded | 1,235,712 |
| Estimated Market Value | $17,541,250 |
| Average Price / IP | $20.30 |
| Median Price / IP | $19.35 |
| RIR Transfers | 850 |
Year-over-Year Comparison
| Metric | This period | A year earlier (Q3 2025) | Change |
|---|---|---|---|
| Transactions | 310 | 246 | +26.0% |
| IP Addresses Traded | 1,235,712 | 1,391,360 | -11.2% |
| Estimated Market Value | $17,541,250 | $25,327,061 | -30.7% |
| Average Price / IP | $20.30 | $26.33 | -22.9% |
| RIR Transfers | 850 | 2,192 | -61.2% |
Price Dynamics
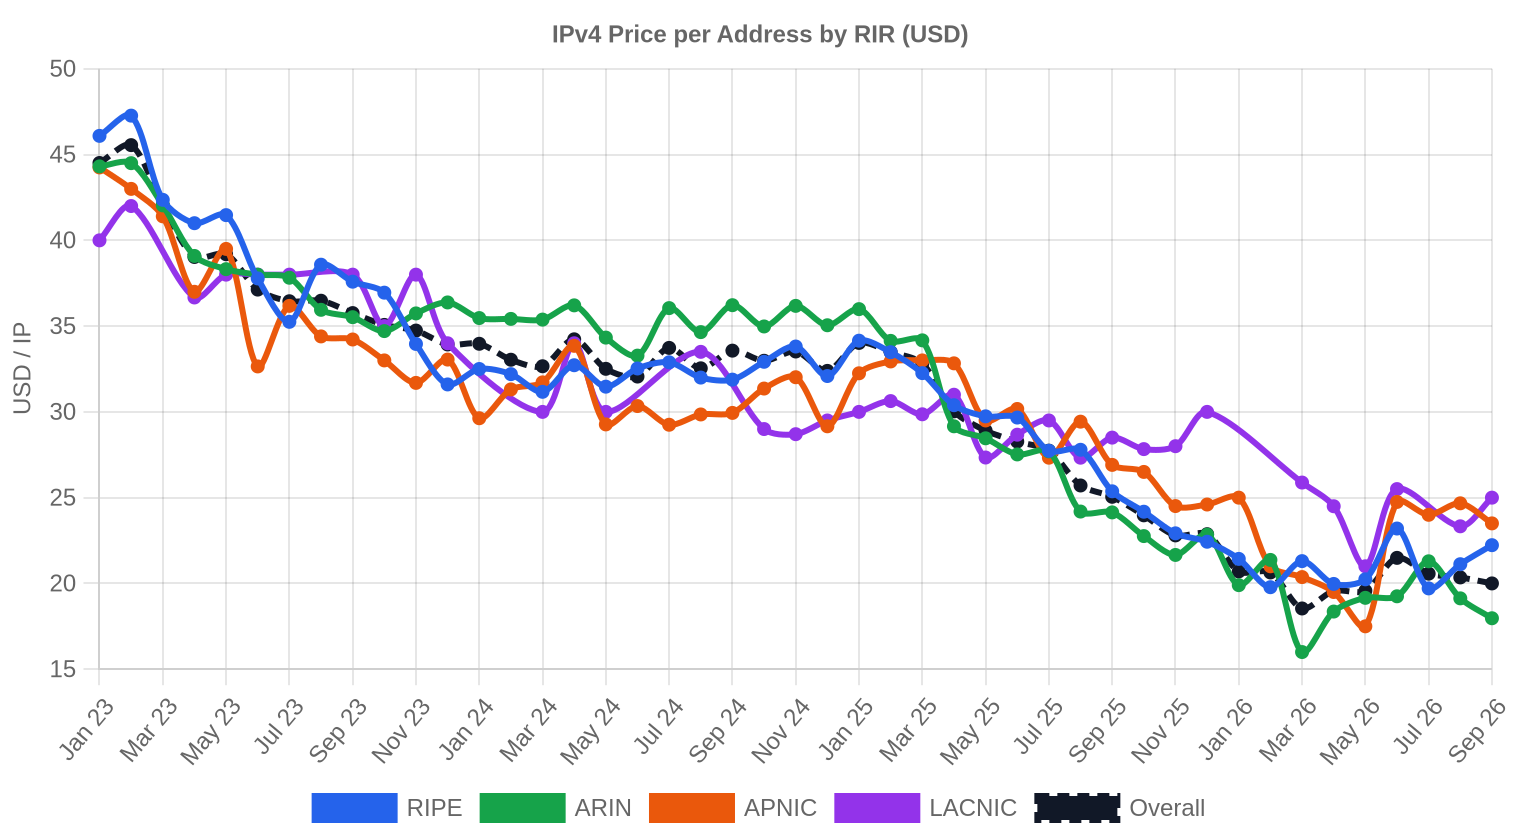
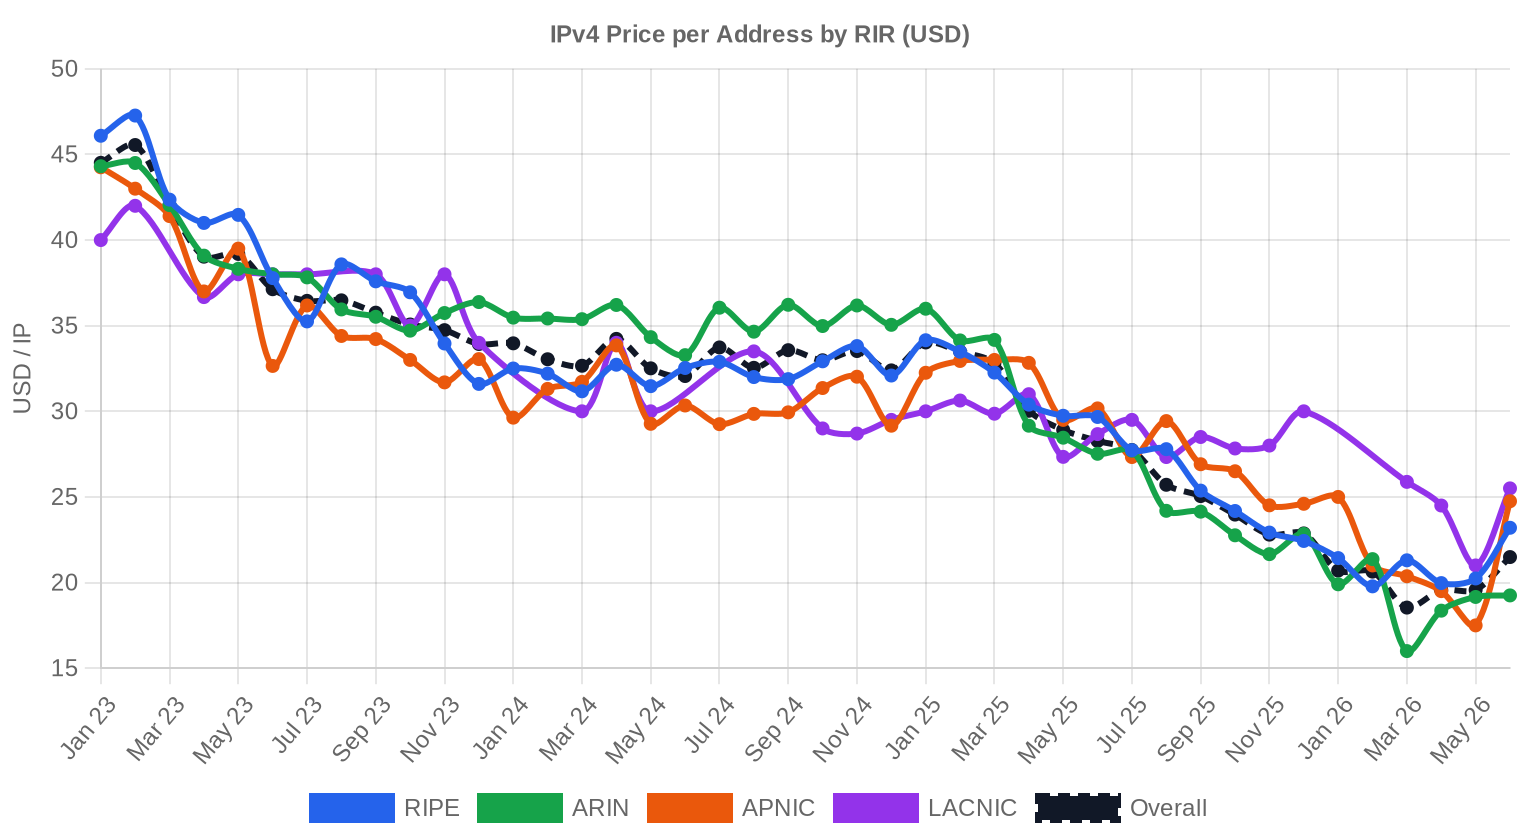
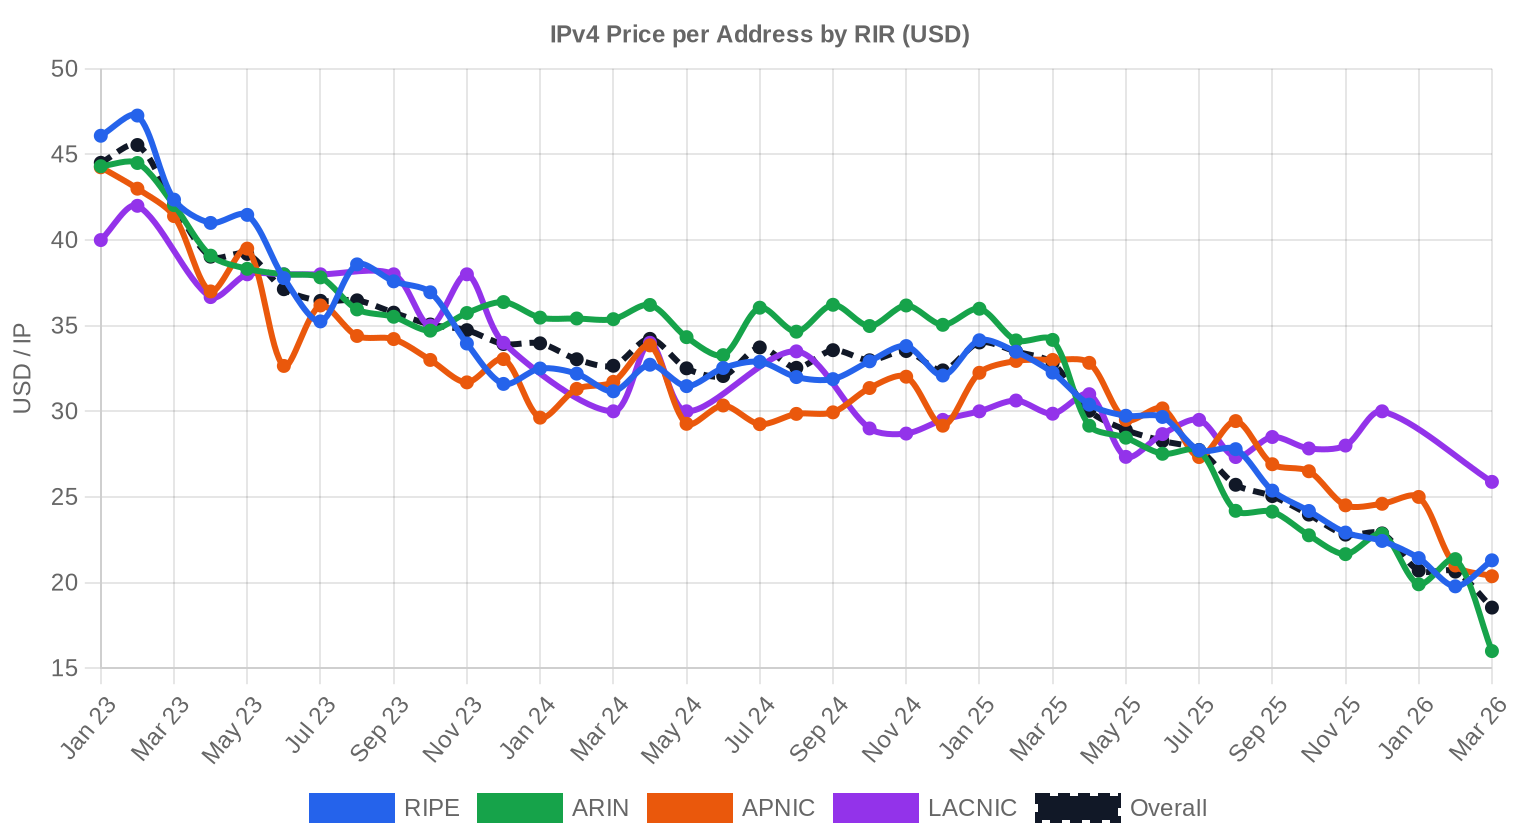
The full range in Q3 spanned $10 to $40 per IP — a $30 spread that reflects wildly different block characteristics rather than market disarray. The $10 floor likely represents large, lightly-marketed ARIN blocks with reputation or documentation issues, while the $40 ceiling points to small, clean RIPE or ARIN /24s with premium routing histories. The regression trend is mildly positive at +0.5% quarter-over-quarter, but that follows a grinding 22.9% annual decline that has repriced the entire asset class. Median pricing at $19.35 trails the mean by nearly a dollar, confirming that a handful of high-priced small-block trades are pulling the average upward. The price floor is no longer collapsing — but the ceiling is compressing, which limits upside for sellers hoping for a Q4 rally.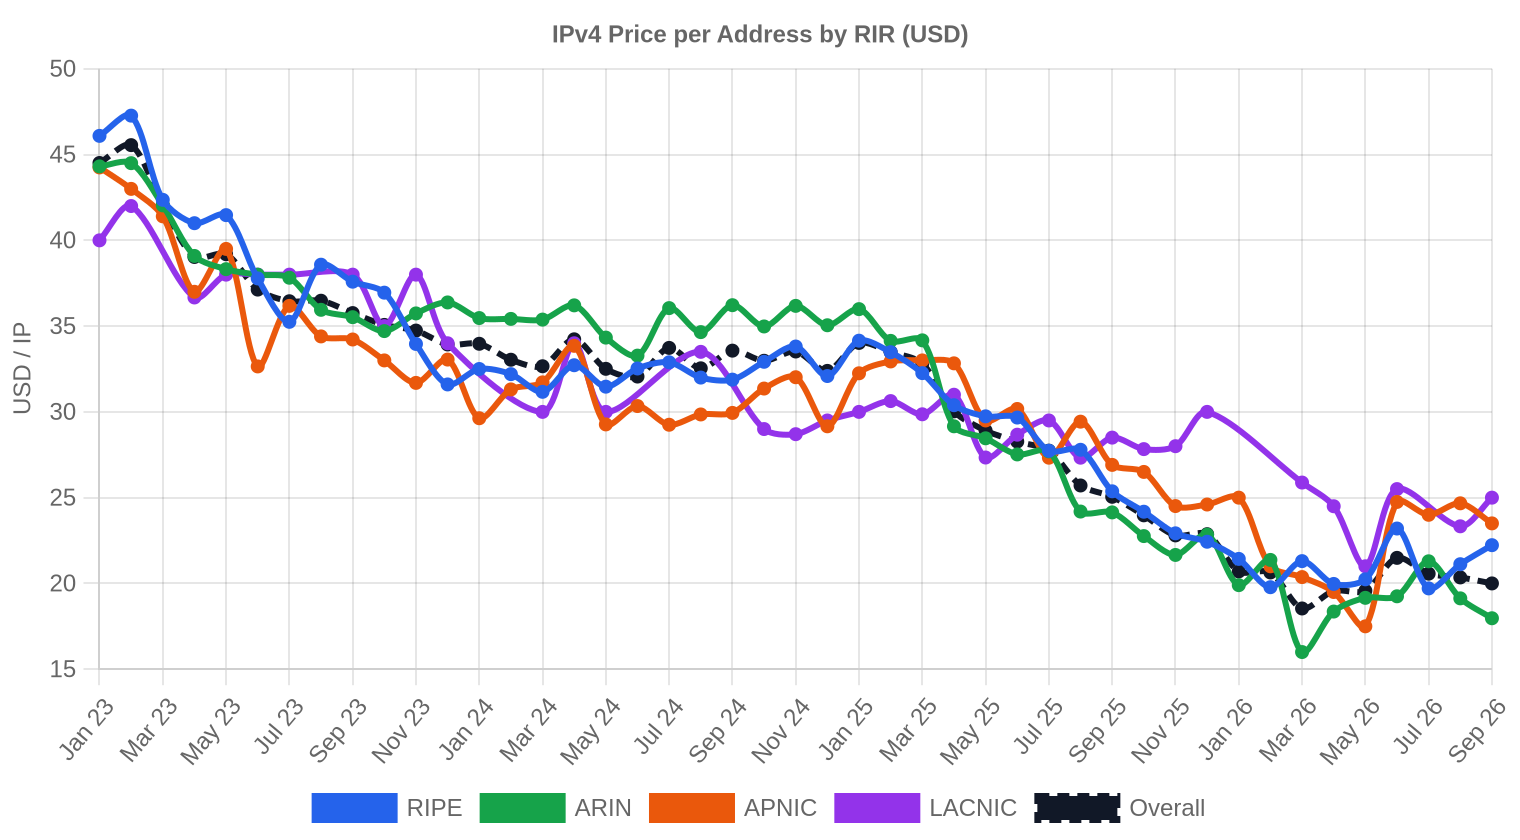
Pricing by RIR
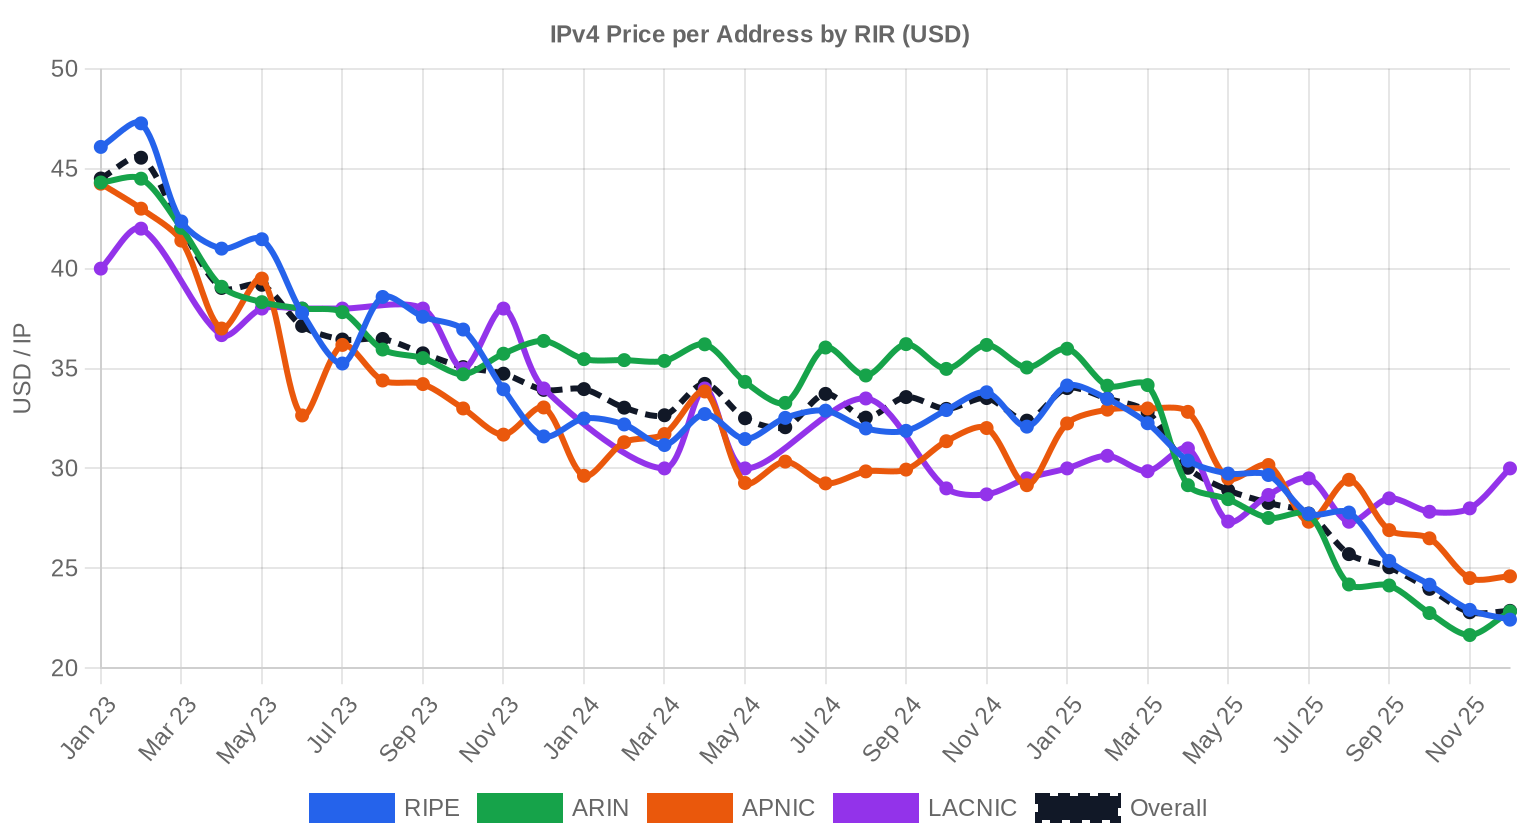
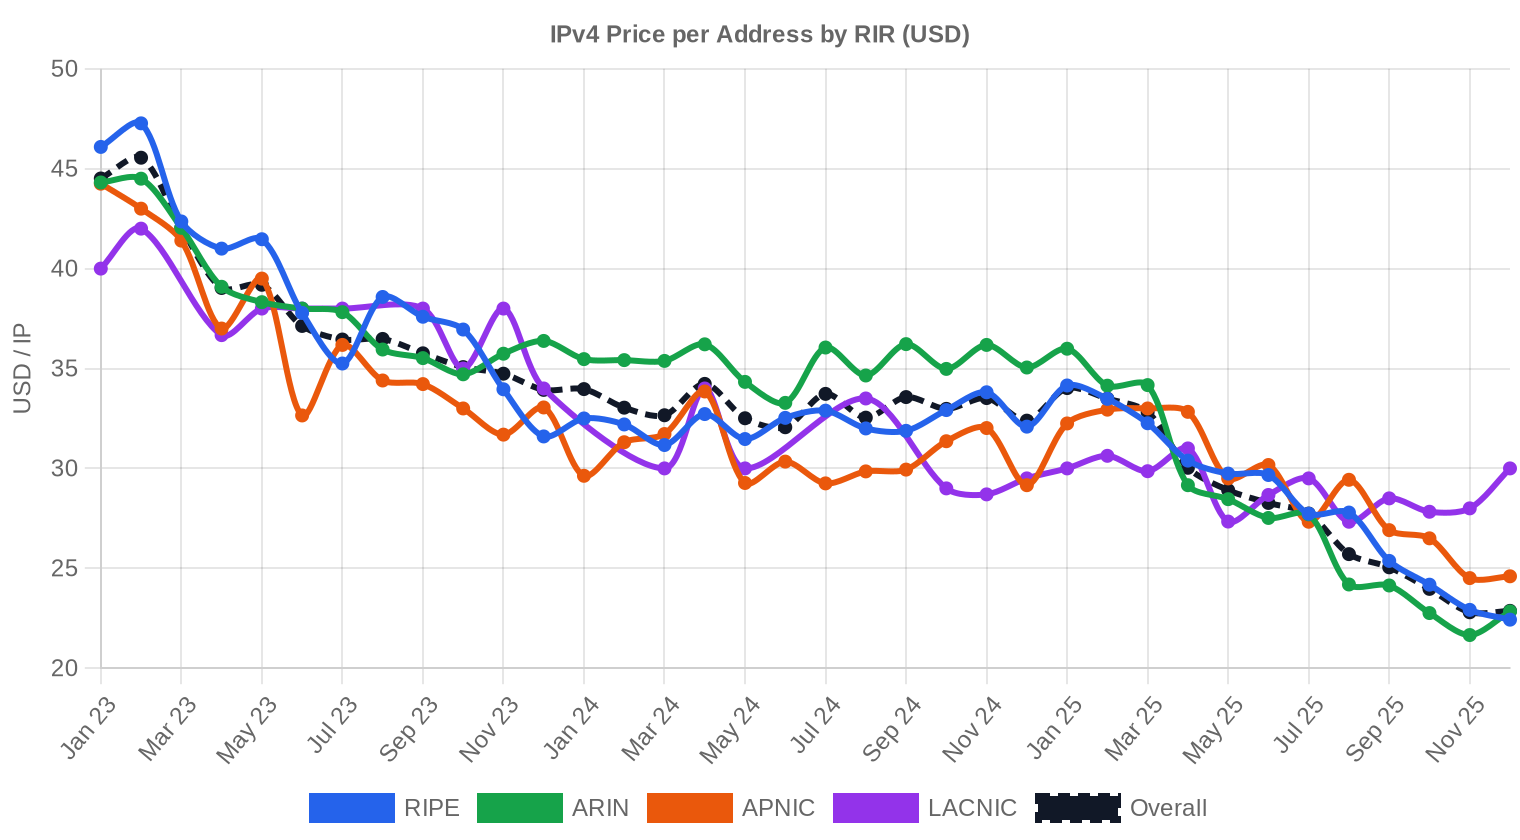
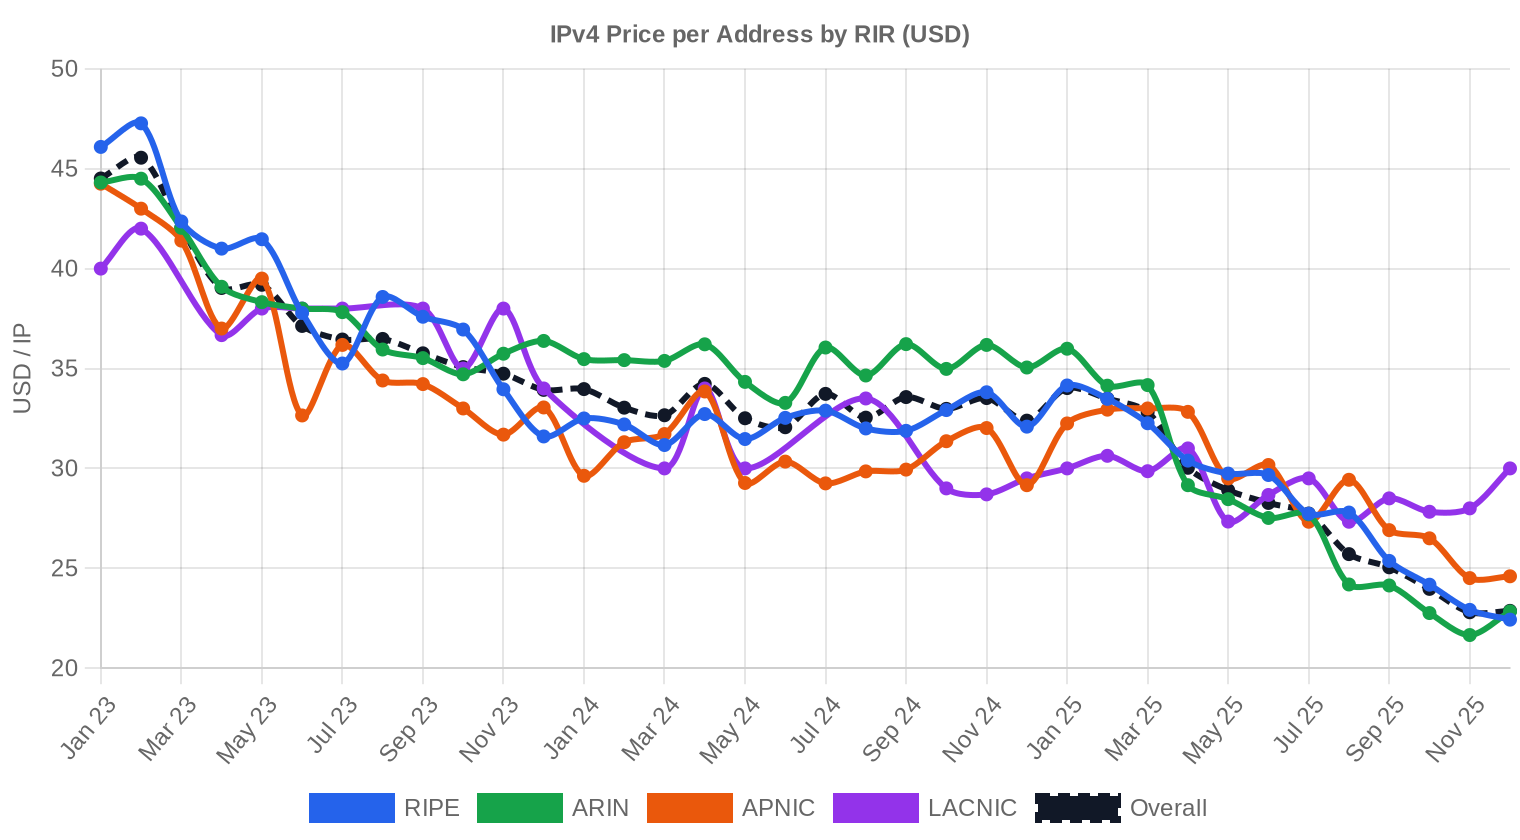
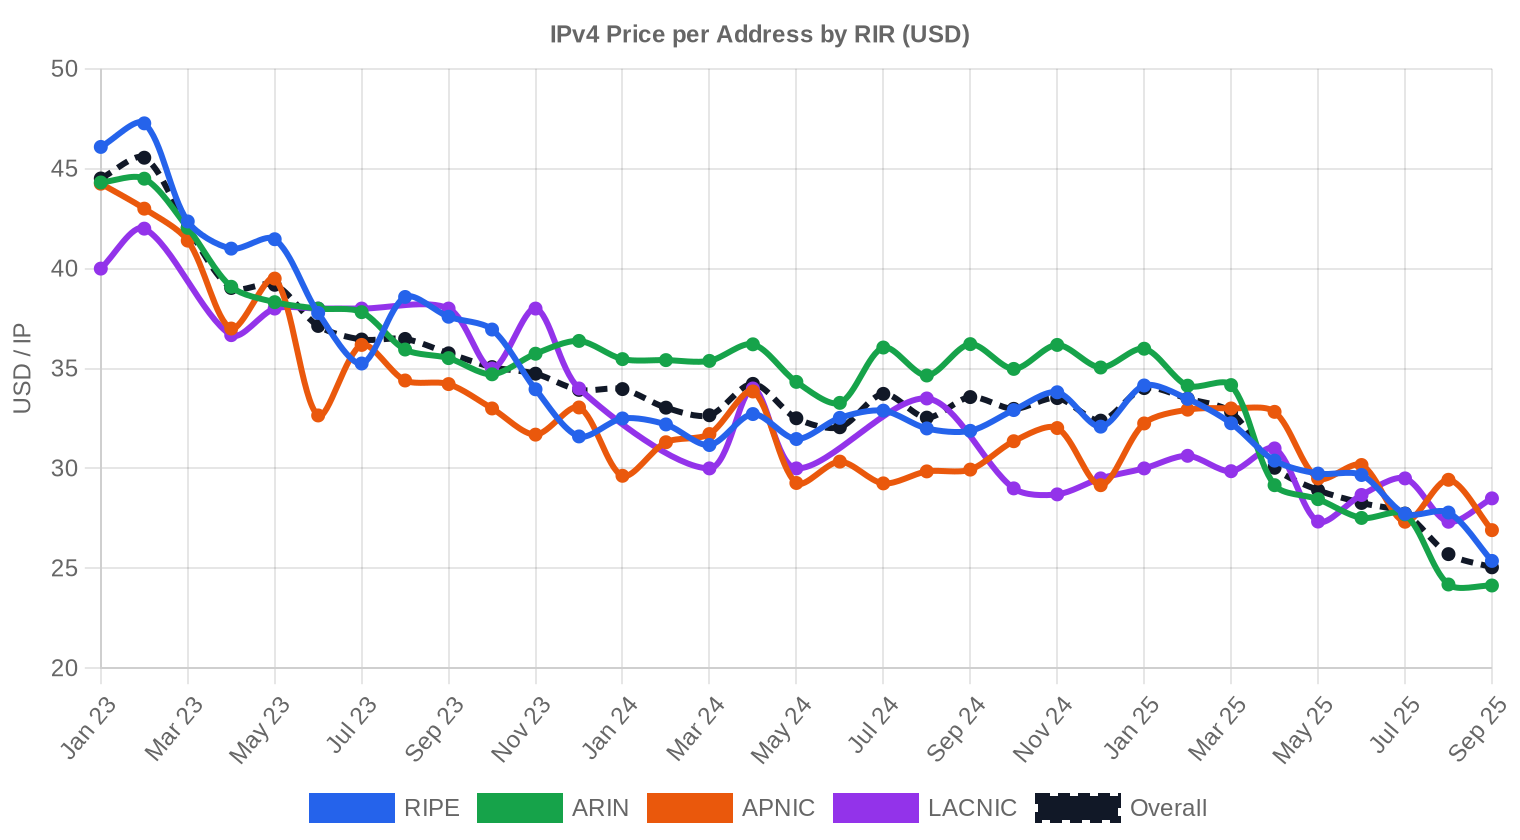
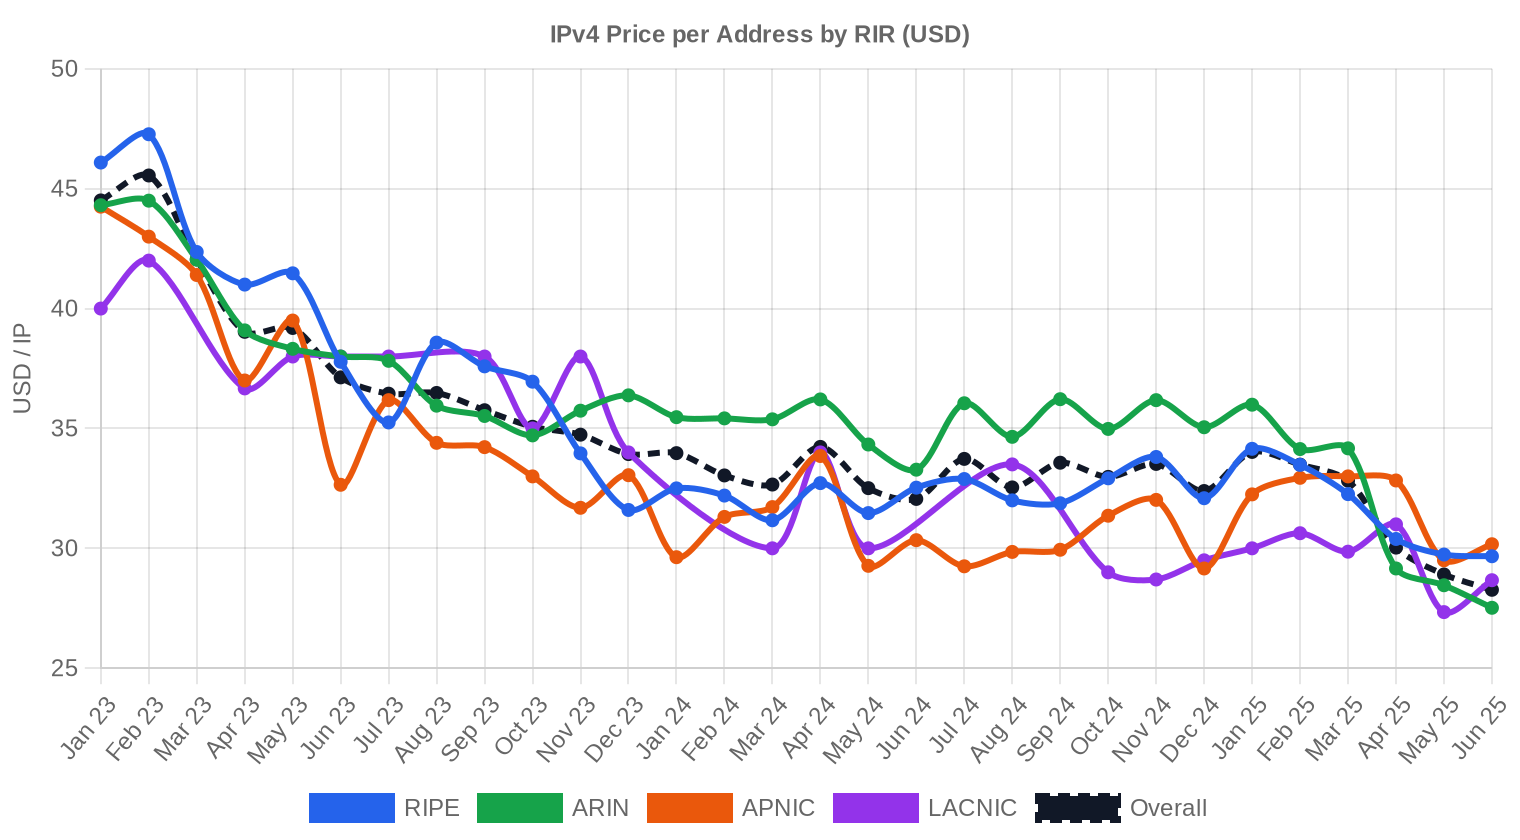
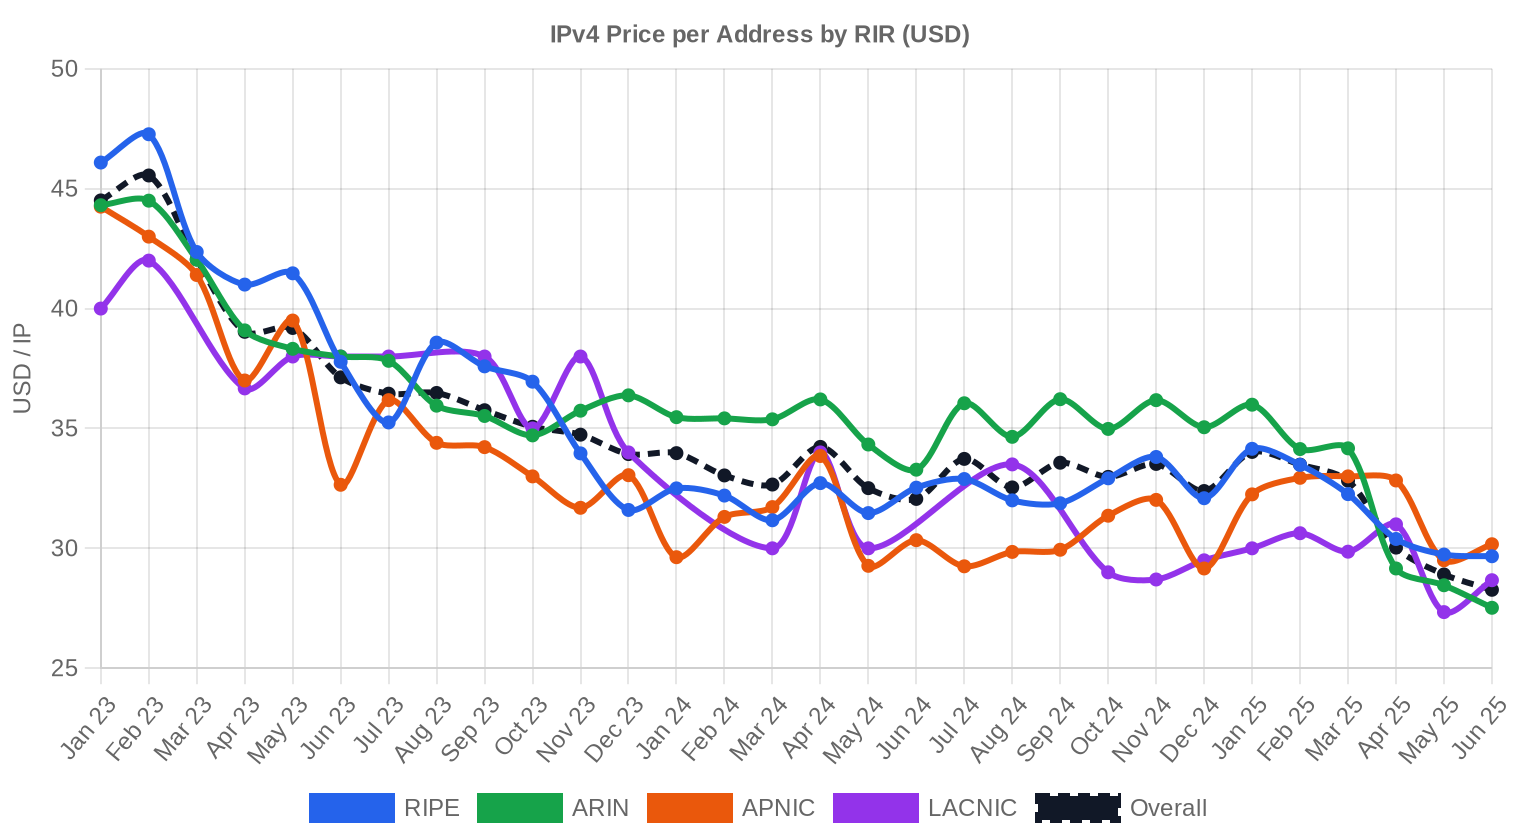
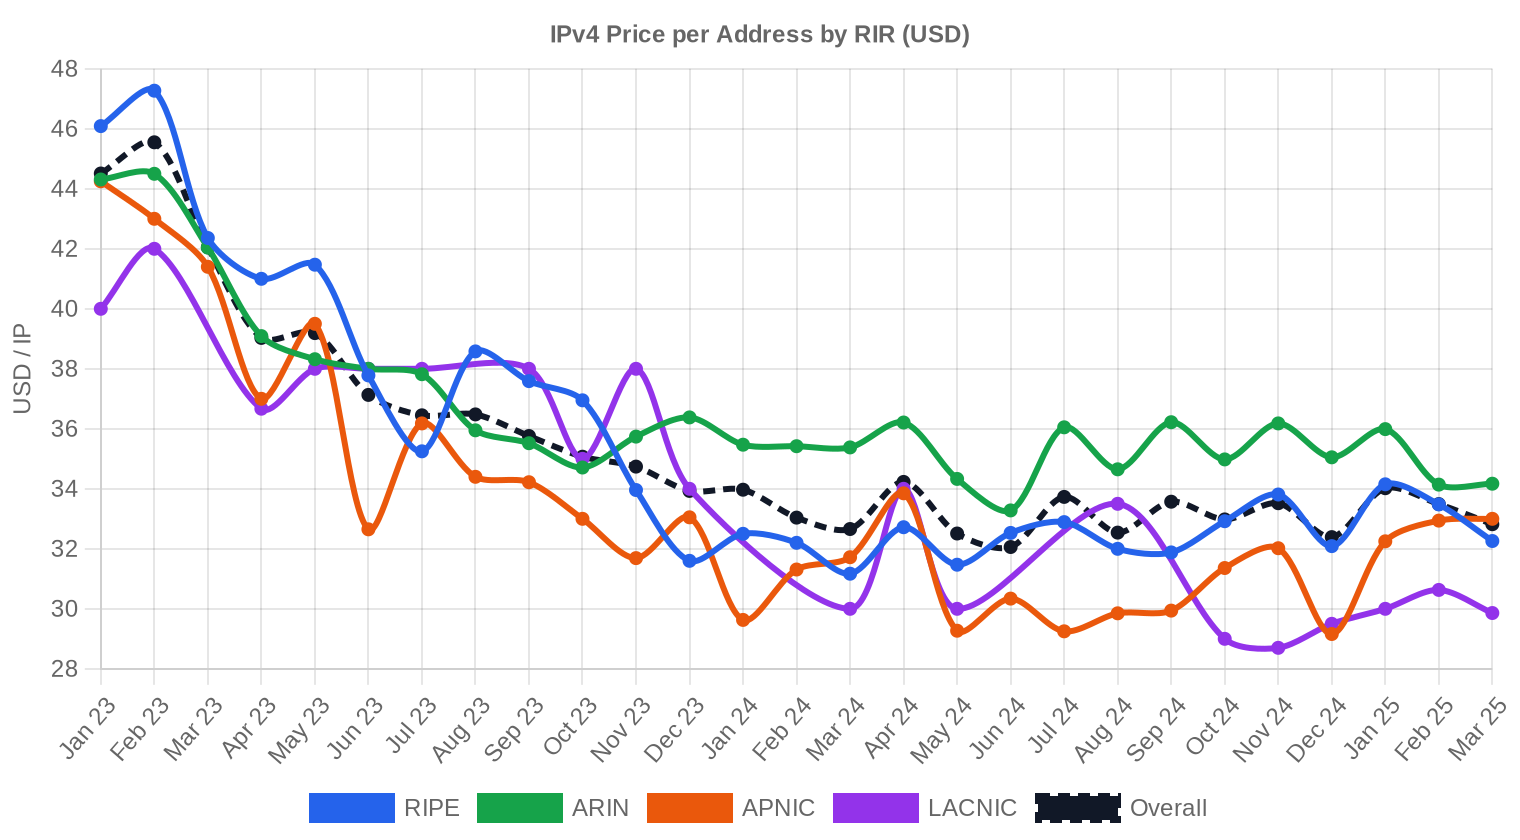
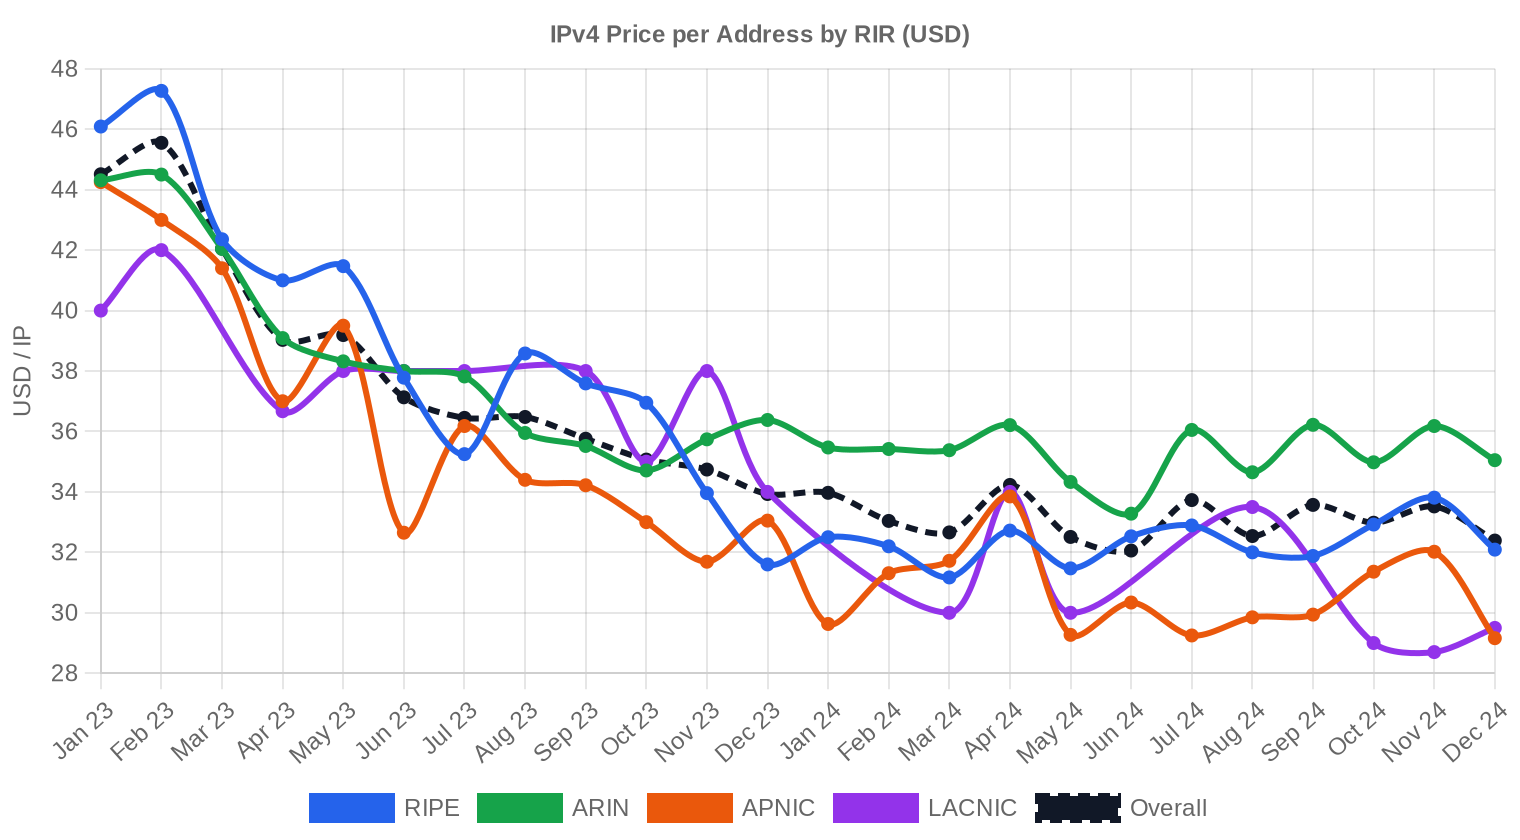
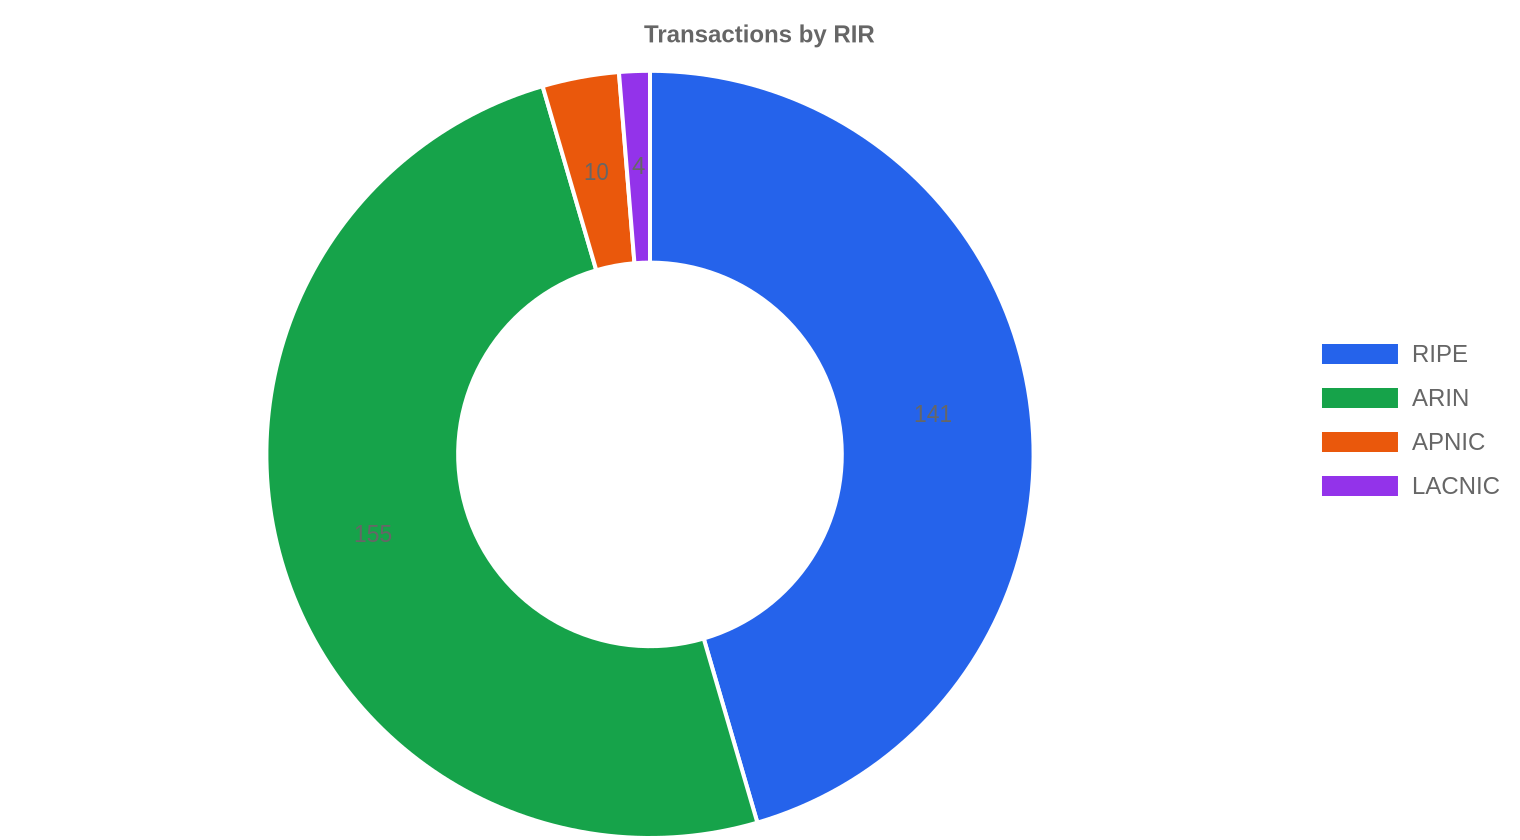
ARIN dominated deal flow with 50% of transaction volume, but APNIC commanded the highest per-IP pricing at $23.95. The ARIN-RIPE spread narrowed to $1.58/IP this quarter — ARIN at $19.38 versus RIPE at $20.96 — the tightest gap we've tracked in recent quarters. APNIC and LACNIC blocks both priced above the market average, reflecting scarcity premiums and limited liquidity in those registries. LACNIC transfer processing times are reportedly improving, with brokers moving 15+ /16 blocks toward ARIN, RIPE, and APNIC destinations; the first completed transfers closed in roughly 60 business days, with a target of 6–8 weeks becoming feasible. If that pace holds, the historical discount on LACNIC-origin space — currently priced at $23.75/IP across just 4 transactions — could narrow as buyer confidence in transfer execution improves.ARIN: $19.38/IP across 155 transactions (65.2% of volume).
RIPE NCC: $20.96/IP across 141 transactions (34.1% of volume).
APNIC: $23.95/IP across 10 transactions (0.4% of volume).
LACNIC: $23.75/IP across 4 transactions (0.2% of volume).
AFRINIC: No recorded transactions this quarter.
| RIR | Transactions | Avg $/IP | Median $/IP | IPs Traded | RIR Transfers | Next Month (proj.) | Year-End (proj.) |
|---|---|---|---|---|---|---|---|
| RIPE | 141 | $20.96 | $20.00 | 421,376 | 321 | $21.00 | $20.50 |
| ARIN | 155 | $19.38 | $18.75 | 806,656 | 529 | $17.00 | $16.75 |
| APNIC | 10 | $23.95 | $24.25 | 5,376 | 0 | $24.00 | $23.50 |
| LACNIC | 4 | $23.75 | $24.00 | 2,304 | 0 | $25.00 | $24.50 |
Transaction Volume
Supply & Block Sizes
/24 blocks dominated Q3 with 97 transactions — the single most traded prefix size — reflecting continued demand from small ISPs, hosting providers, and enterprises that need a routeable minimum without committing to larger capital outlays. The skew toward sub-$50K deals (235 of 310 transactions, or 75.8%) reinforces this pattern. Larger blocks (/16 and above) still move, but in fewer transactions at tighter per-IP pricing, where buyers extract volume discounts and sellers accept lower margins for faster capital recycling.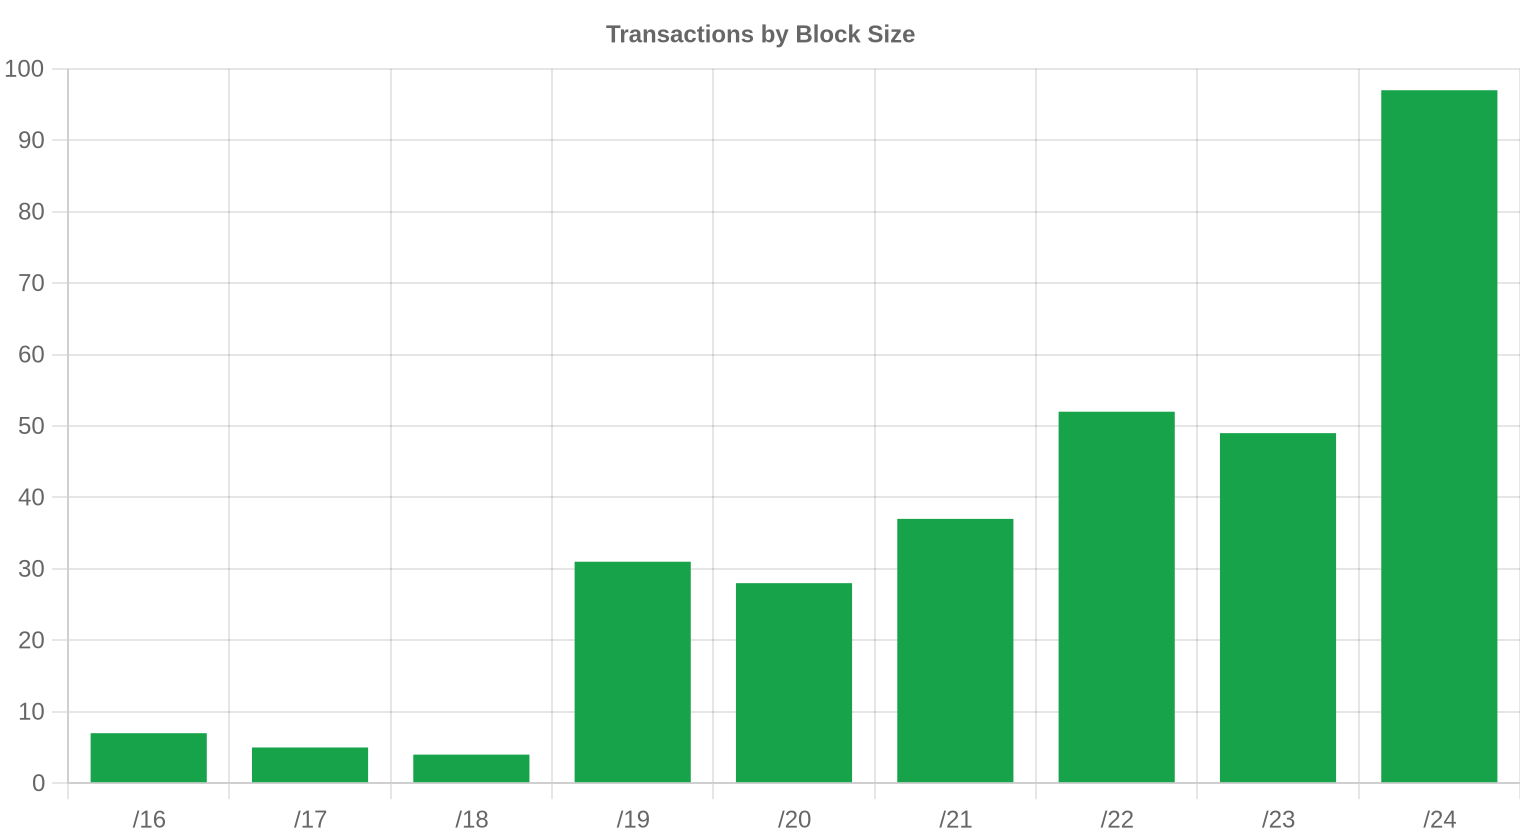
Geographic Activity
The United States led all markets with 128 transactions, followed by the United Kingdom at 47 and Canada at 23. Together these three countries accounted for nearly 64% of all Q3 deal flow. European activity was distributed across Spain (12), Sweden (11), Ireland (8), and Italy (6), consistent with RIPE's strong transaction share. Emerging activity from Ukraine (4 transactions plus 2 cross-border deals), Mexico (3), and Singapore (3) suggests geographic diversification at the margin.Registry Transfer Activity
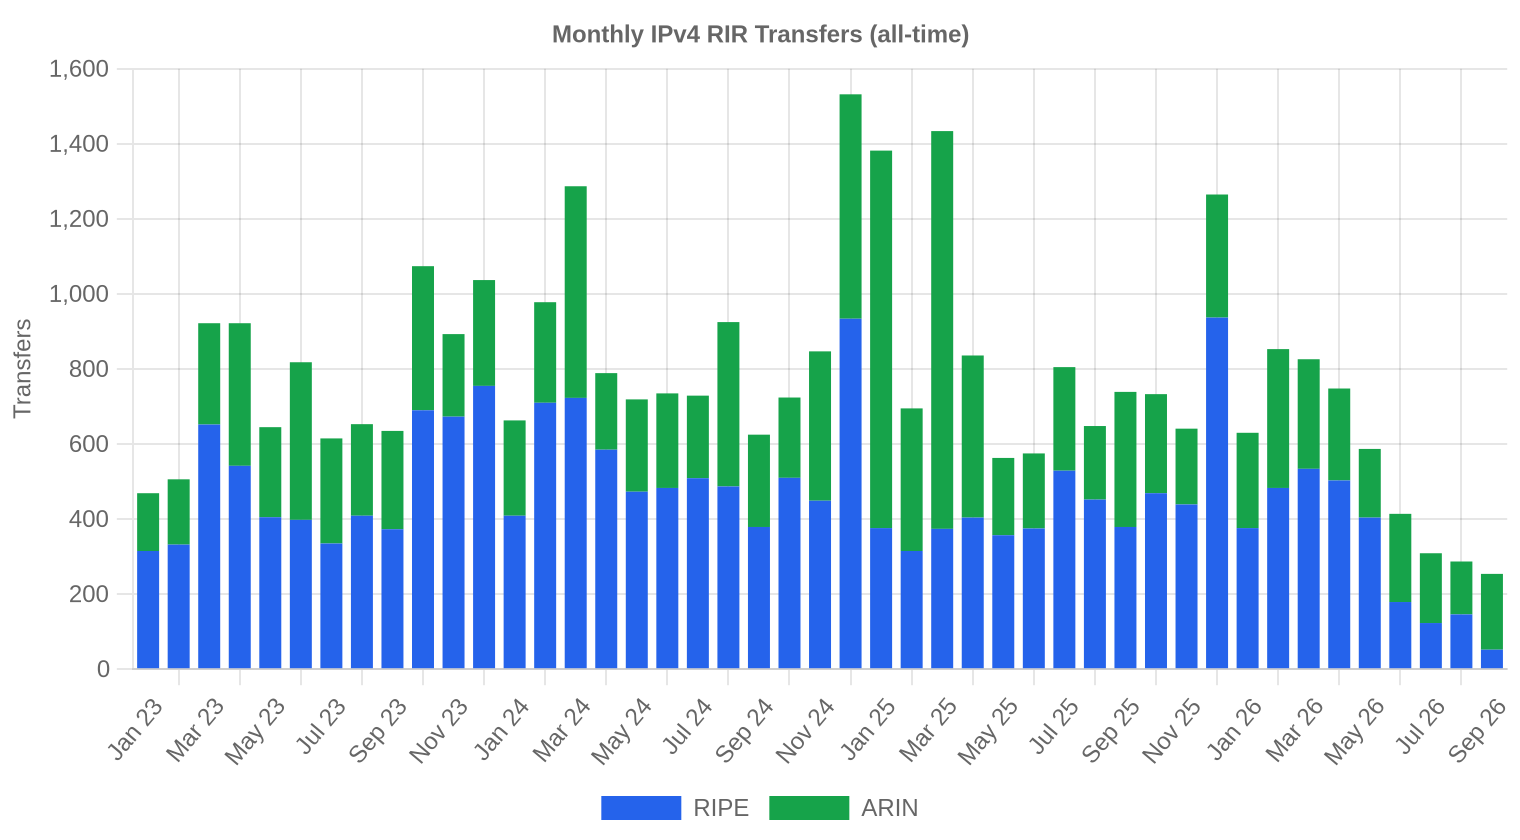
RIR-recorded transfers totaled 850 in Q3, with ARIN accounting for 529 (62.2%) and RIPE contributing 321 (37.8%). Neither APNIC, LACNIC, nor AFRINIC registered official transfer counts this quarter. The gap between our tracked sales transactions (310) and total recorded transfers (850) reflects intra-organizational moves, mergers, and non-market reassignments that don't involve cash consideration.Long-Run Transfer Trends
Over the 45-month tracking window, cumulative transfers have reached 34,966, with RIPE holding 59.3% of historical share versus ARIN's 40.7%. The peak month remains December 2024, when year-end tax planning, budget cycling, and pre-AWS-charge positioning drove a transfer spike that has not been repeated. Current quarterly run rates suggest annual transfers will land in the 3,200–3,400 range for 2026, down from the elevated 2024 baseline but stable relative to H1 2026.| RIR | RIR Transfers |
|---|---|
| RIPE | 20,736 |
| ARIN | 14,230 |
| RIR Transfers | 34,966 |
Outlook & Forecast
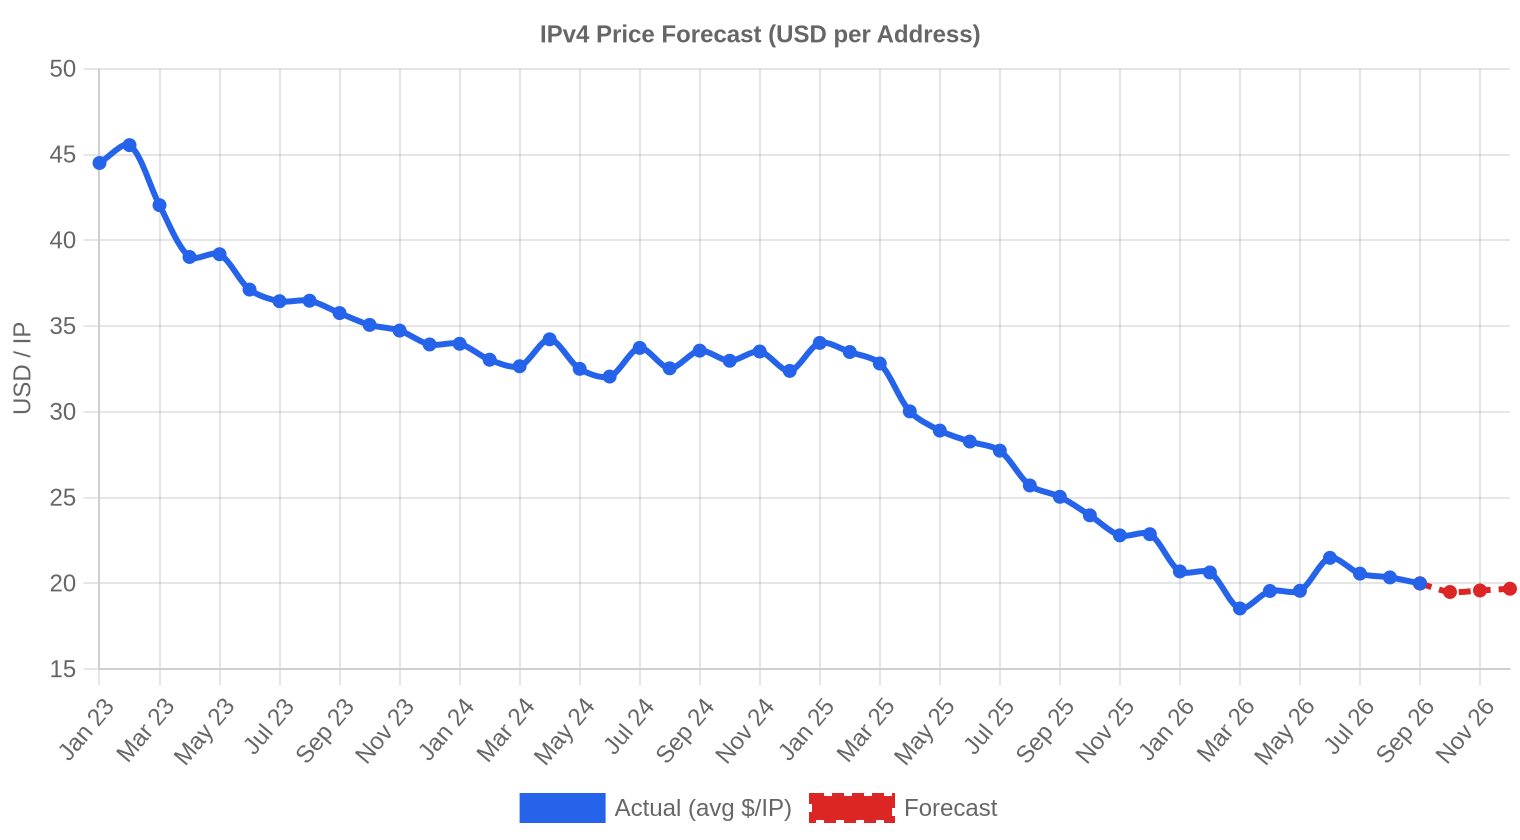
Forecasting each block-size band and RIR separately with our AI model:
The overall average price per IP is projected to reach $19.69 by December 2026, with a next-month estimate of $19.99 per IP.
- RIPE: projected at $21.00 per IP next month, trending toward $20.50 by December 2026.
- ARIN: projected at $17.00 per IP next month, trending toward $16.75 by December 2026.
- APNIC: projected at $24.00 per IP next month, trending toward $23.50 by December 2026.
- LACNIC: projected at $25.00 per IP next month, trending toward $24.50 by December 2026.
- AFRINIC: insufficient data for a reliable forecast.
Forecast by Block Size
| Block | Current $/IP | Next Month | Year-End | Confidence |
|---|---|---|---|---|
| /24 | $25.00 | $25.00 (0.0%) | $24.50 (-2.0%) | high |
| /23 | $22.38 | $21.50 (-3.9%) | $21.00 (-6.2%) | medium |
| /22 | $19.00 | $19.00 (0.0%) | $19.00 (0.0%) | medium |
| /21 | $17.60 | $17.25 (-2.0%) | $17.00 (-3.4%) | medium |
| /20 | $15.50 | $15.50 (0.0%) | $15.50 (0.0%) | medium |
| /19 | $13.50 | $13.50 (0.0%) | $13.25 (-1.9%) | medium |
| /18-/16 | $13.50 | $13.00 (-3.7%) | $13.00 (-3.7%) | low |
| /15-up | $10.00 | $10.00 (0.0%) | $9.75 (-2.5%) | low |
Editor's Take: Buy vs. Lease
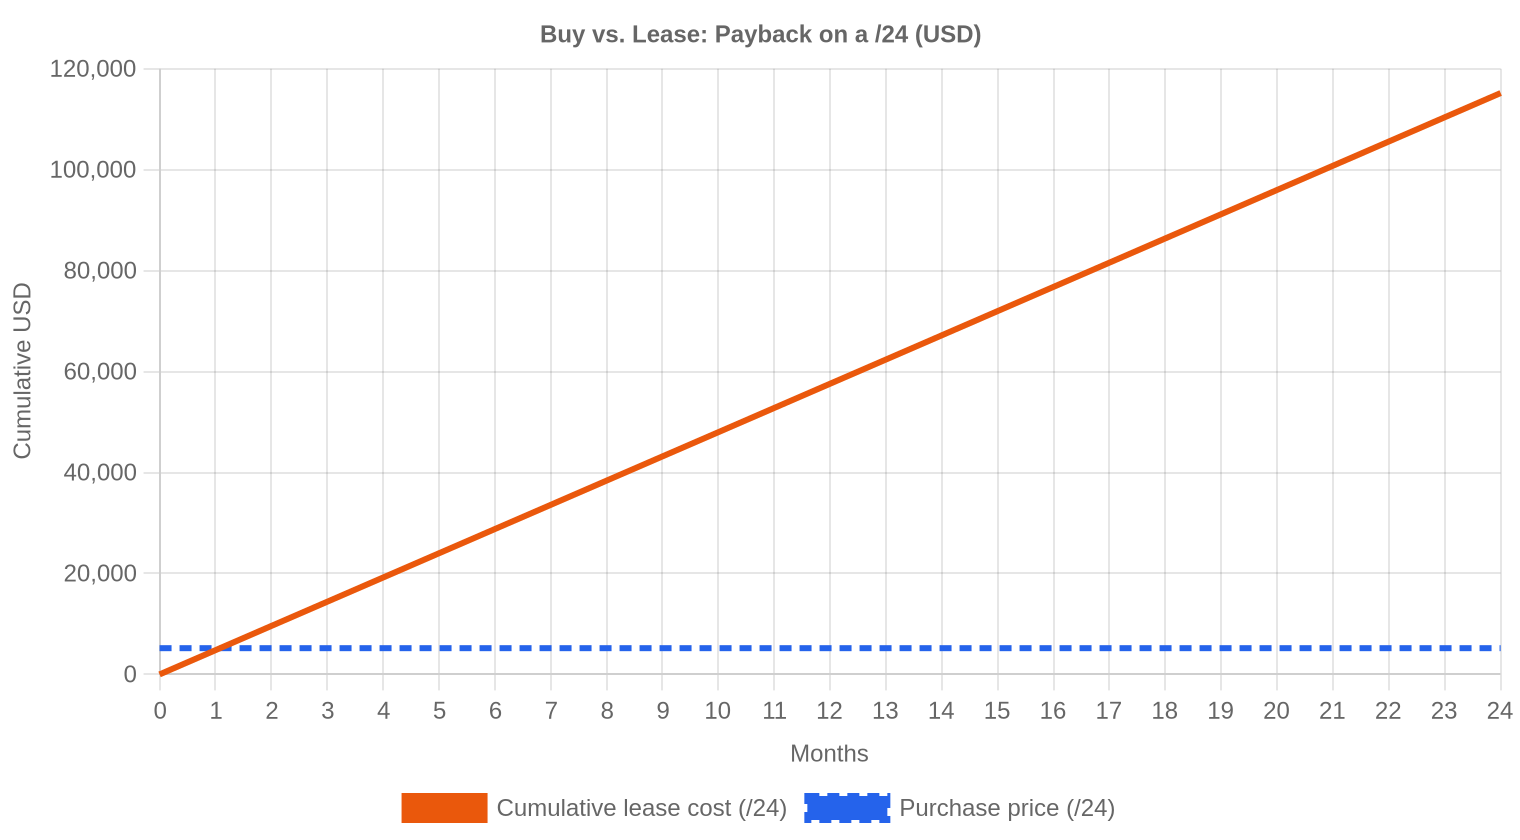
The buy-versus-lease math is unusually decisive this quarter. At $20.30/IP to buy and $18.75/IP per month to lease (based on 182 RIPE lease observations), the payback period on a purchase is approximately 1.1 months — meaning the lease cost effectively equals the purchase price in just over four weeks. The implied annual yield for a block owner leasing out space is a staggering 1,108%, which makes holding and leasing one of the most attractive yield propositions in any asset class. For buyers with a time horizon beyond 90 days, purchasing is the rational choice. Leasing only makes sense for short-duration needs under six weeks or for organizations that cannot tolerate the administrative burden of an RIR transfer. The improving LACNIC transfer timeline — potentially closing in 6–8 weeks rather than the historical 4–6 months — adds an additional arbitrage opportunity for buyers willing to source from that registry and transfer blocks to ARIN or RIPE jurisdiction. Block holders sitting on unused space should be leasing aggressively at current rates.| /24 Purchase price | $5,197 |
| /24 Lease price | $4,800 / mo |
| Payback period | 1.1 mo (0.1 yr) |
| Gross annual yield | 1,108.4% |
What This Means for You
Buyers: You are purchasing at levels 22.9% below where the market sat a year ago. With year-end forecasts pointing to $19.69/IP, there is no urgency to rush, but there is also limited downside risk at current levels. If your need extends beyond 90 days, buying dominates leasing on pure economics. Source ARIN blocks for the best per-IP pricing; consider LACNIC-origin blocks if you can tolerate a 60-day transfer window.Sellers: The pricing floor near $19–$20/IP appears firm, but the 22.9% annual decline means holding for price recovery is a losing bet in the near term. Average deal size shrank to 56,585 IPs from 102,956 a year ago — smaller blocks are moving faster. If you hold /16+ inventory, consider breaking blocks into /18–/20 segments to access the more liquid sub-$250K deal segment.
Leasers: At $18.75/IP/month for RIPE-region space, leasing remains expensive relative to purchase prices. Unless your requirement is genuinely short-term (under 6 weeks), the math strongly favors buying. If you are currently leasing, evaluate whether a purchase conversion makes financial sense at today's depressed prices.
Block Holders: If you own clean, transferable IPv4 space, the lease market offers extraordinary returns — the annualized yield exceeds 1,100% at current rates. Maximize utilization of idle blocks through leasing while maintaining the option to sell if prices recover.
Browse verified IPv4 blocksSell IPv4 →
List your blocks with managed transferLease IPv4 →
Flexible short-term capacityLease Out IPv4 →
Turn idle blocks into recurring revenue
IPv4 Pricing by Block Size
The /24 remains the market's workhorse, with 97 transactions at prices ranging from $13 (RIPE) to $40 (ARIN) per IP — a spread that reflects block cleanliness, blacklist status, and buyer urgency. Per-IP premiums on /24s typically run 15–30% above the market average because buyers are paying for the minimum routeable unit, not volume. At the other end, /16 and larger blocks trade closer to $15–$18/IP, where institutional buyers extract meaningful volume discounts and sellers accept tighter margins in exchange for single-transaction liquidity events.| Block | IPs | Buy: /IP | Buy: Total | Lease: /IP/mo | Lease: Monthly |
|---|---|---|---|---|---|
| /24 | 256 | $35-45 | $8,960-11,520 | $0.38-0.50 | $97-128 |
| /22 | 1,024 | $28-38 | $28,672-38,912 | $0.33-0.45 | $338-461 |
| /20 | 4,096 | $22-32 | $90,112-131,072 | $0.30-0.40 | $1,229-1,638 |
| /18 | 16,384 | $20-30 | $327,680-491,520 | $0.30-0.38 | $4,915-6,226 |
| /16 | 65,536 | $18-28 | $1,179,648-1,835,008 | $0.30-0.35 | $19,661-22,938 |
IPv4 Price History: 2011–2026
IPv4 prices began their ascent from near-zero in 2011 following IANA free pool exhaustion, climbing steadily through the 2010s as cloud adoption consumed available inventory. The market peaked in the $50–$60/IP range during late 2023 and early 2024, before AWS's announcement of per-IP public address charges triggered a structural repricing. Prices have since fallen more than 60% from those peaks, settling into the $19–$21 corridor that has defined 2026 trading. The current bifurcation — with small blocks commanding premiums and large blocks trading at discounts — mirrors the mature phase of any finite-supply commodity market.| Year | ~Price/IP | Key Event |
|---|---|---|
| 2011 | $7-12 | IANA free pool exhausted; Microsoft/Nortel deal ($11.25/IP) |
| 2012 | $8-12 | RIPE NCC reaches last /8; begins /22-only allocation |
| 2014 | $10-15 | LACNIC free pool exhausted |
| 2015 | $8-15 | ARIN free pool exhausted |
| 2017-18 | $12-18 | Leasing market grows; cloud demand rises |
| 2019 | $18-24 | RIPE NCC exhausts remaining free pool |
| 2021-22 | $50-60+ | Post-pandemic peak; hyperscaler build-outs |
| 2024 | $35-52 | AWS IPv4 charge ($0.005/IP/hr); large block correction |
| 2025-26 | $18-45 | Market bifurcation; /16s below $20 for first time since 2019 |
Market Structure: Who Is Buying & Selling
The buy side is dominated by cloud providers scaling capacity, regional ISPs serving underserved markets, and enterprises consolidating network footprints post-M&A. AI infrastructure companies are an emerging buyer segment, particularly for contiguous /16+ allocations needed for training cluster connectivity. The sell side remains anchored by legacy corporate holders monetizing dormant allocations, bankruptcy and restructuring estates, and telecom operators rationalizing assets following mergers.IPv4 vs. Other Asset Classes
At current lease yields exceeding 1,100% annualized, IPv4 space outperforms every traditional asset class by an absurd margin — U.S. Treasuries yield roughly 4.5%, commercial real estate cap rates run 5–8%, and even high-yield credit sits below 10%. The comparison is somewhat misleading because IPv4 lease demand is not guaranteed to persist, and the asset carries transfer friction and counterparty risk that bonds and REITs do not. Still, for holders with clean, transferable blocks and reliable lessees, the risk-adjusted return profile is compelling.| Asset Class | Typical Yield | Liquidity | Primary Risk |
|---|---|---|---|
| IPv4 | 1,108.4% | Moderate | IPv6 adoption, block quality |
| Commercial Real Estate | 5-8% | Low | Vacancy, rate cycle |
| Investment-Grade Bonds | 4-5% | High | Duration, credit risk |
| S&P 500 | ~1,3% | High | Market volatility |
| Money Market / T-Bills | ~4-5% | High | Rate cycle changes |
IPv6 Adoption & Why IPv4 Remains Essential
IPv6 adoption continues its slow march — Google's measurements show roughly 45% of global traffic reaching its services over IPv6 — but the protocol transition has been underway for over a decade with no realistic completion date. Enterprise networks, gaming infrastructure, and IoT deployments remain heavily reliant on IPv4 for backwards compatibility, NAT traversal, and vendor support. The coexistence period will extend well into the 2030s, which means IPv4 addresses remain a functional and financial necessity for the foreseeable future.AI & Cloud Infrastructure Demand
AI infrastructure buildouts are contributing incremental demand, particularly from companies deploying GPU training clusters and inference farms that require dedicated, non-NATed public addressing for inter-node communication and API endpoints. These buyers typically seek /16 or larger contiguous blocks, which puts upward pressure on exactly the segment where pricing is most compressed. The trend is real but early — AI-related transactions likely represent fewer than 5% of current deal flow, though that share is growing quarter over quarter.What Determines IPv4 Block Value
Block value hinges on five factors: blacklist cleanliness (any Spamhaus or UCEProtect listings can slash value by 20–40%), allocation age (older blocks have better routing acceptance), RIR registry (ARIN and RIPE blocks are most liquid), contiguity (contiguous ranges command premiums over fragmented space), and transfer documentation quality. A /20 with a clean Spamhaus record and full LOA documentation will consistently outprice a larger but reputation-impaired block.Sell vs. Lease: A Decision Framework
Current market conditions favor leasing for holders who want income without permanent asset disposal — the annualized yield at $18.75/IP/month dwarfs any capital gain from selling at $20.30/IP. Selling makes sense if you need immediate liquidity, if your block has reputation issues that depress lease demand, or if you believe prices will continue declining below the $19 floor. For blocks that are clean and easily transferable, leasing is the superior strategy until purchase prices recover meaningfully above $25/IP.| /24 Purchase price | $5,197 |
| /24 Lease price | $4,800 / mo |
| Payback period | 1.1 mo (0.1 yr) |
| Gross annual yield | 1,108.4% |
RIPE NCC 24-Month Transfer Restriction
RIPE NCC's 24-month holding requirement before a block can be re-transferred continues to restrict supply velocity in the European market. This rule creates a price premium on RIPE blocks that have already cleared the holding period — buyers will pay $1–$3/IP more for immediately transferable space versus blocks that carry holding period restrictions. The rule also compresses supply during periods of high demand, since recently transferred blocks are locked out of the resale market for two full years.Deal Size Distribution
Average deal size fell to 56,585 IPs in Q3, down 18.8% from Q2's 69,704 and down 45.0% from Q3 2025's 102,956. The sub-$50K segment accounted for 235 deals (75.8% of transactions) but only $3.63 million in value, while the 7 deals exceeding $1 million generated $9.31 million — 53.1% of total market value from just 2.3% of transactions. This distribution is consistent with a two-tier market: high-frequency small-block trades for operational needs, and sporadic large-block transactions driven by strategic acquisitions.Top Trading Countries
The U.S. commanded 41.3% of all transactions (128 deals), driven by BEAD-related ISP demand, cloud expansion, and enterprise refresh cycles. The U.K. ranked second with 47 transactions, reflecting both domestic hosting demand and London's role as a hub for cross-border IPv4 brokerage. Canada's 23 deals position it as the third most active market, with telecom consolidation and rural broadband expansion as primary demand drivers.BEAD Broadband Program Impact
The $42.45 billion BEAD broadband program continues to generate demand for /18–/22 blocks as grant recipients — primarily fixed wireless and fiber ISPs — seek addressing for new subscriber deployments. This demand is lumpy and geographically concentrated, which can temporarily exhaust local broker inventory for mid-size ARIN blocks. As BEAD grants convert to network deployments through 2026–2028, expect periodic tightening in the /20–/22 segment, particularly in rural U.S. regions where ISPs lack existing allocations.Hyperscaler IPv4 Holdings
The major cloud providers — AWS, Microsoft, Google, and Oracle — collectively hold tens of millions of IPv4 addresses, and their strategies directly shape market dynamics. AWS's decision to charge $0.005/hour per public IPv4 address catalyzed the 2024 price correction by pushing customers to release unused space. Any future policy shifts by hyperscalers — whether returning blocks to market, acquiring additional space, or adjusting pricing — would have outsized effects on a market that trades only 4–5 million addresses per year.Macroeconomic Conditions & Market Impact
Central bank rate cuts through H1 2026 have modestly improved enterprise capital budgets, but the effect on IPv4 demand has been muted — buyers are price-sensitive after the 2024–2025 correction and are not chasing deals. IT spending growth in the U.S. is running at roughly 5% year-over-year, which supports steady but not accelerating demand. The stronger factor this quarter is the BEAD program's continued deployment timeline, which creates lumpy, program-driven demand from ISPs and fixed wireless operators that can overwhelm local supply for mid-size blocks.Model Update & Calibration
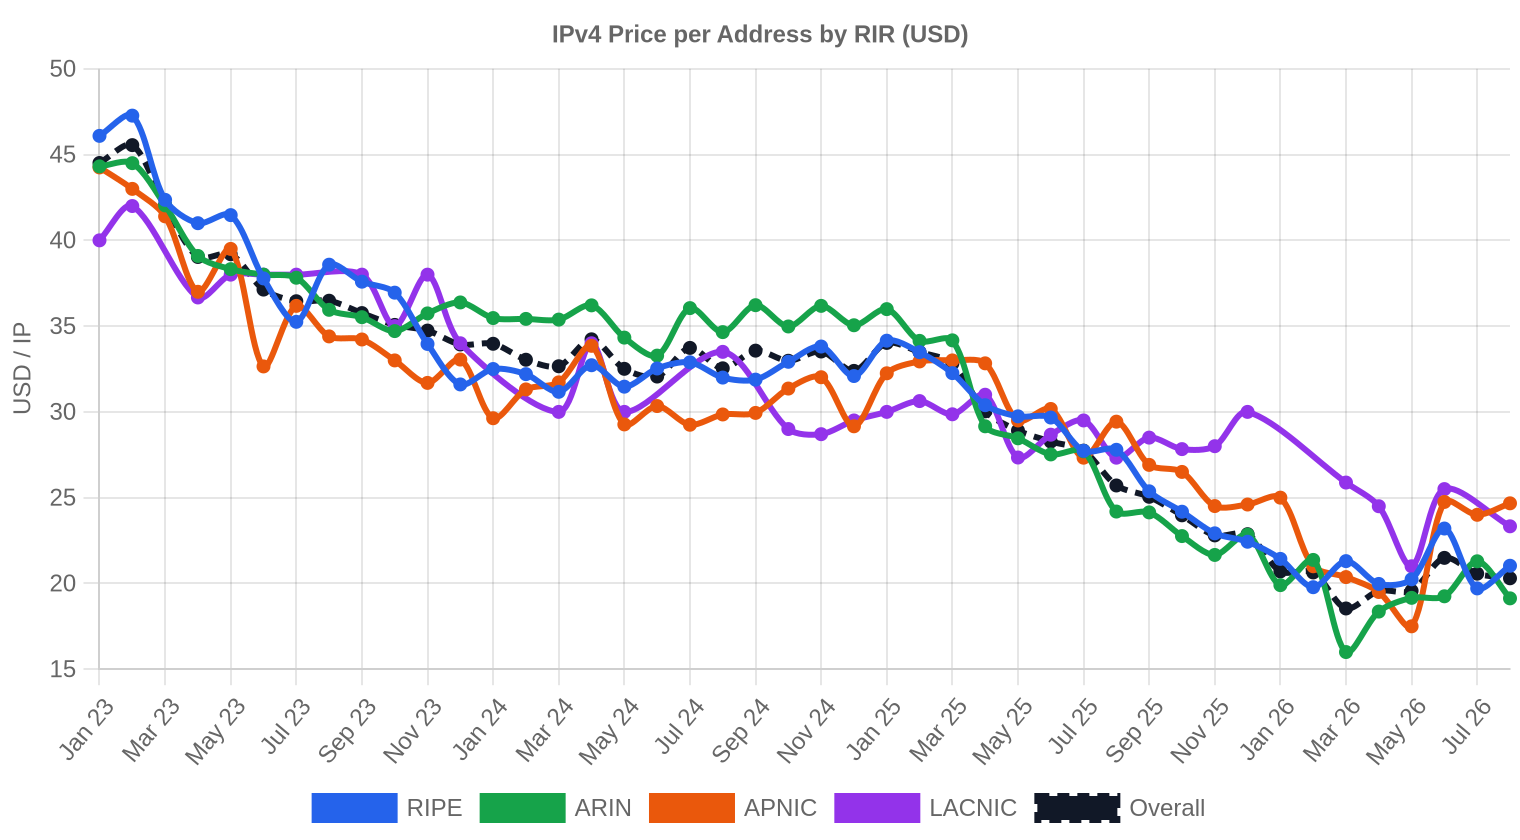
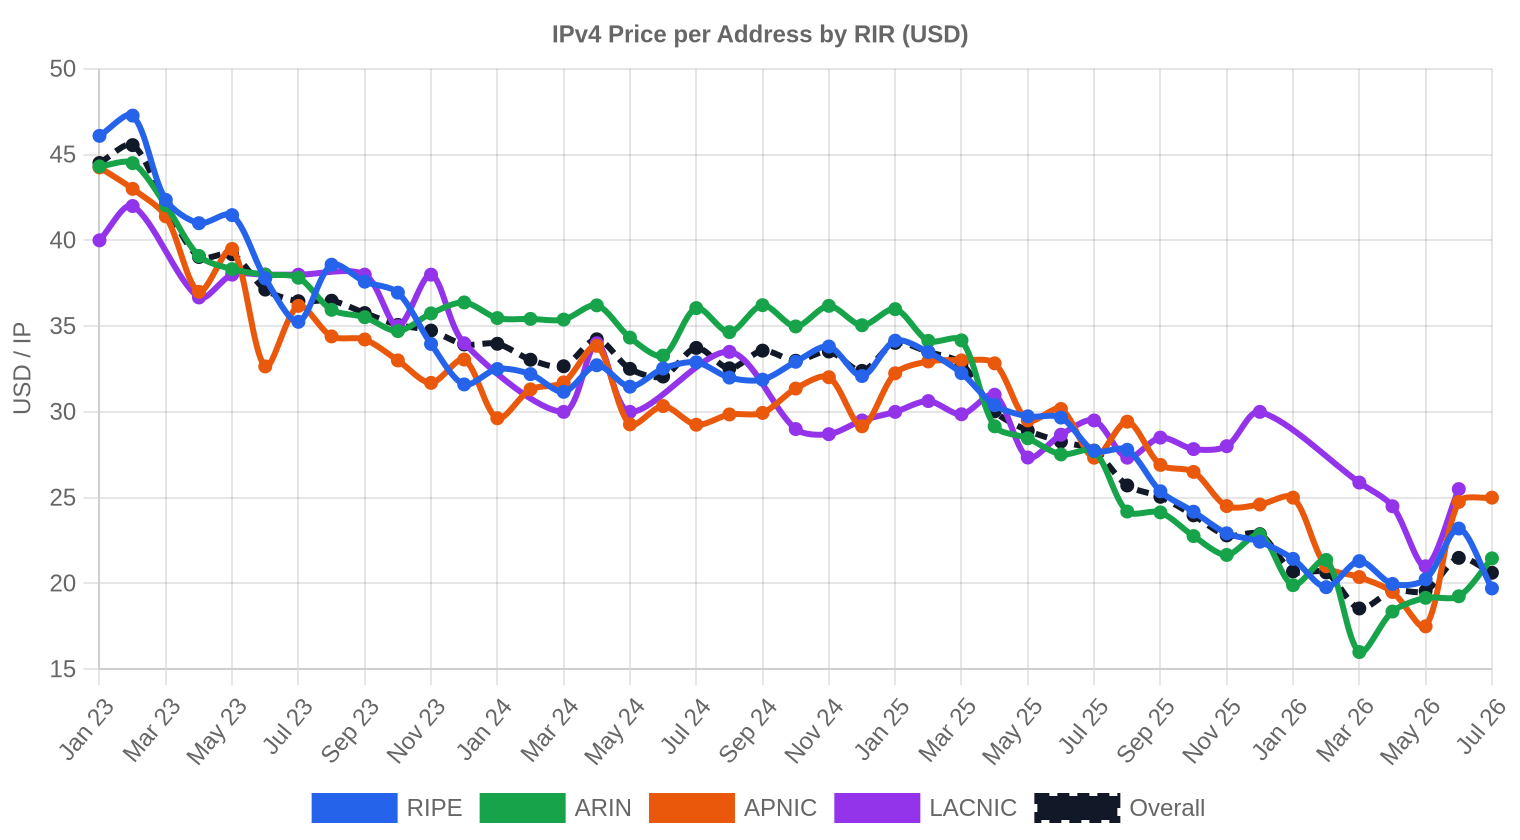
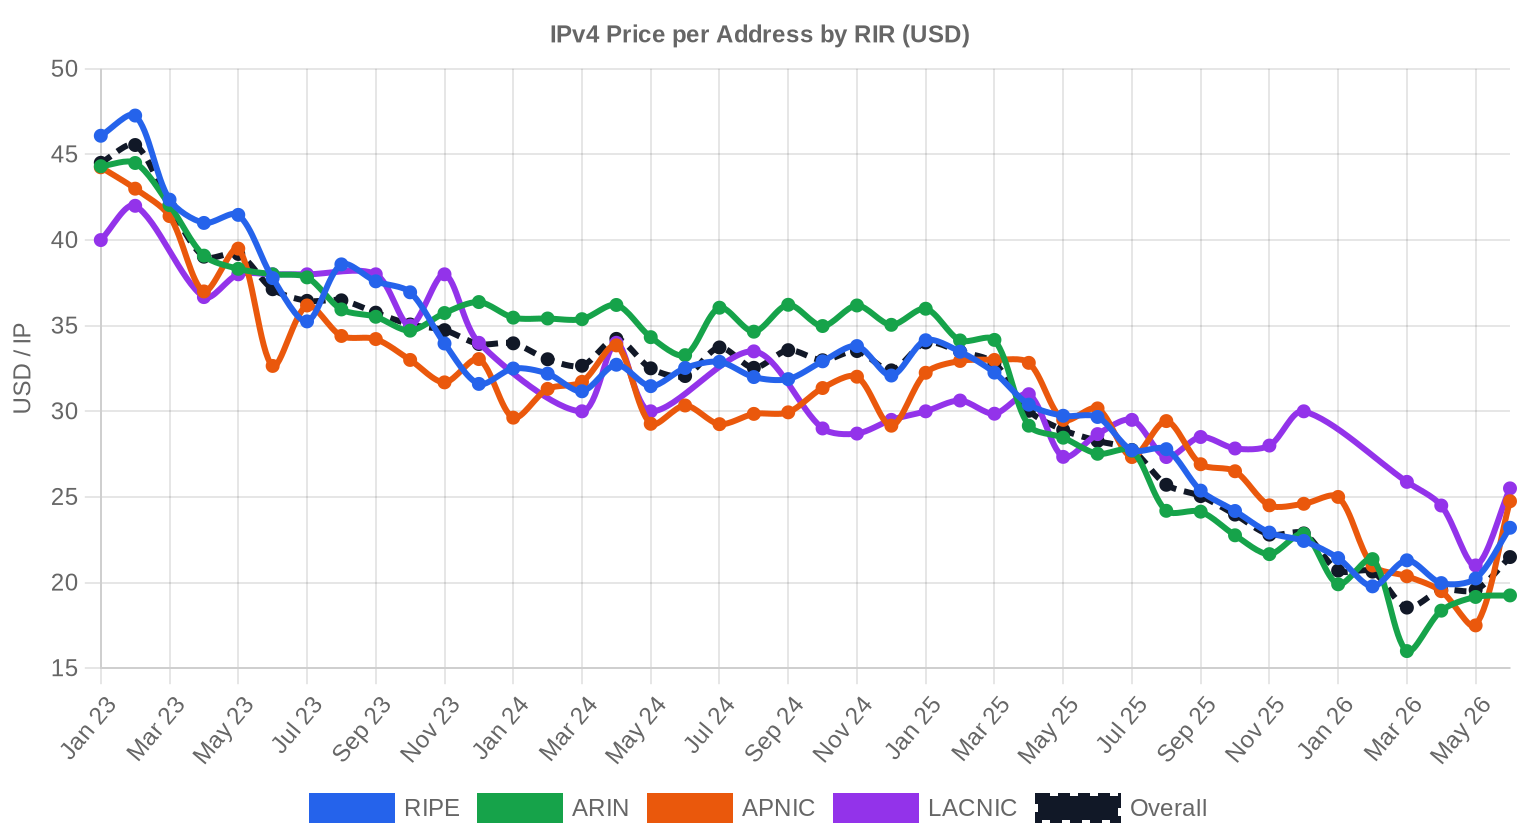
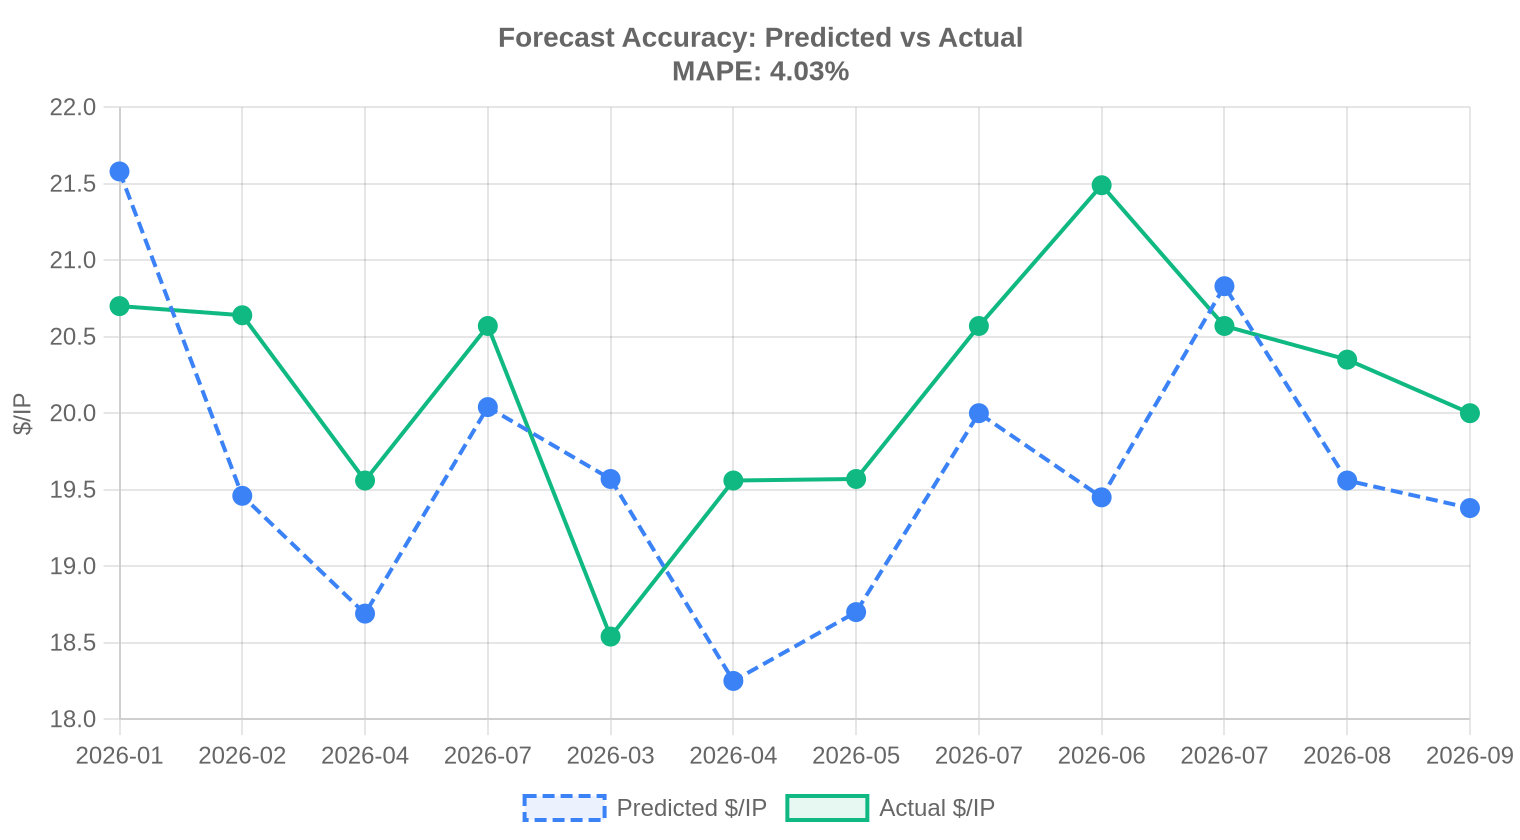
As part of our continuous improvement process, we backtested previous forecasts against realised prices and fine-tuned the model accordingly. Recent months now carry more influence than older data, and the confidence bands have been widened or narrowed based on how well they captured actual outcomes in the past. You can see the full backtest results in the table and chart below.
| Report Period | Target Month | Predicted | Actual | Deviation |
|---|---|---|---|---|
| 2026-04 | 2026-05 | $19 | $20 | -4% |
| 2026-Q2 | 2026-07 | $20 | $21 | -3% |
| 2026-05 | 2026-06 | $19 | $21 | -9% |
| 2026-06 | 2026-07 | $21 | $21 | +1% |
| 2026-07 | 2026-08 | $20 | $20 | -4% |
| 2026-08 | 2026-09 | $19 | $20 | -3% |
Methodology
Figures are based on completed IPv4Center marketplace transactions and RIR transfer statistics. Prices are in US dollars per IP address. Forecasts are produced by an AI model that analyses each block-size band and RIR segment separately (with outlier-trimmed medians) alongside known market catalysts; they are estimates, not guarantees.
Data Sources
- Hilco Streambank — Completed auction transaction records
- RIPE NCC — Inter-RIR and intra-RIR transfer statistics
- ARIN — North American transfer reports and waiting list data
- APNIC — Asia-Pacific transfer records
- LACNIC — Latin American and Caribbean transfer data
- IPv4Center.com — Proprietary marketplace transaction and lease pricing data
This report is generated automatically for informational purposes only and does not constitute financial advice.
Frequently Asked Questions
What was the average IPv4 price in Q3 2026?
The average IPv4 price in Q3 2026 was $20.30 per IP, with a median of $19.35. This represents a 0.5% increase from Q2 2026 but a 22.9% decline from Q3 2025.
How many IPv4 addresses were traded in Q3 2026?
A total of 1,235,712 IPv4 addresses were traded across 310 transactions, generating $17.54 million in total market value.
What is the price range for IPv4 addresses?
Q3 2026 prices ranged from $10/IP at the low end (typically large ARIN blocks with issues) to $40/IP for small, clean blocks with premium routing histories.
Which RIR has the cheapest IPv4 addresses?
ARIN offered the lowest average pricing at $19.38/IP across 155 transactions. RIPE averaged $20.96/IP, while APNIC and LACNIC commanded premiums at $23.95 and $23.75 respectively.
Why are APNIC IPv4 blocks more expensive?
APNIC blocks averaged $23.95/IP due to limited supply and strong demand in the Asia-Pacific region. Only 10 transactions occurred, reflecting low liquidity that supports premium pricing.
How much does a /24 IPv4 block cost?
A /24 block (256 IPs) cost approximately $5,197 at the Q3 2026 market average of $20.30/IP. Actual prices varied from roughly $3,300 to $10,240 depending on cleanliness, RIR, and routing history.
How much does a /16 IPv4 block cost?
At the Q3 average of $20.30/IP, a /16 block (65,536 IPs) would cost roughly $1.33 million. Large blocks typically trade at a per-IP discount of 15–25% below market average.
Is it better to buy or lease IPv4 addresses?
For any need beyond approximately 90 days, buying is the clear financial winner. At $20.30/IP to buy versus $18.75/IP per month to lease, the purchase price is recouped in just 1.1 months of avoided lease payments.
What is the monthly lease rate for IPv4 addresses?
The average monthly lease rate in Q3 2026 was $18.75 per IP, or approximately $4,800 per /24 block, based on 182 observed RIPE-region lease transactions.
How long does an IPv4 transfer take?
ARIN transfers typically close in 2–4 weeks. RIPE transfers take 2–6 weeks. LACNIC transfers have historically taken 4–6 months, but recent improvements have reduced this to approximately 60 business days, with a 6–8 week target becoming achievable.
What is the IPv4 price forecast for late 2026?
Our model projects $19.99/IP next month and $19.69/IP at year-end 2026. The forecast confidence is high, pointing to continued sideways trading in the $19–$21 range.
Why have IPv4 prices dropped 22.9% year-over-year?
The decline reflects the ongoing correction from 2024 peaks, driven by AWS's public IP pricing that released unused addresses, increased supply from legacy holders, and reduced speculative buying as prices stabilized.
What countries are most active in IPv4 trading?
The United States led with 128 transactions (41.3%), followed by the United Kingdom with 47 and Canada with 23. These three countries accounted for nearly 64% of all Q3 deal flow.
What is RIPE's 24-month holding rule?
RIPE NCC requires that transferred blocks be held for 24 months before they can be re-transferred. This restricts supply velocity and creates a premium on blocks that have already cleared the holding period.
What mistakes should be avoided when buying IPv4?
The most common mistakes are skipping blacklist verification (Spamhaus, UCEProtect), failing to verify the seller's authority over the block with the RIR, not using escrow, and overlooking RIPE's 24-month holding rule which can lock you out of resale for two years.
What are the risks of skipping blacklist verification?
Buying a blacklisted block can reduce its value by 20–40% and render it unusable for email, hosting, or any reputation-sensitive application. Some listings take months to remediate, and certain blocklists require the block to be unused for extended periods before delisting.
Why shouldn't you skip escrow when buying IPv4?
IPv4 transfers are irreversible once completed at the RIR level, and fraud — including sellers who lack actual authority over blocks — remains a real risk. Escrow ensures funds are released only after the RIR confirms the transfer, protecting both buyer and seller.
What risks exist in the IPv4 market?
Key risks include continued price erosion if IPv6 adoption accelerates, regulatory changes at RIRs that could restrict transfers, blacklist contamination of purchased blocks, and counterparty fraud. The 22.9% annual price decline shows that capital losses are a real possibility.
How does the BEAD program affect IPv4 demand?
The $42.45 billion BEAD broadband program is driving demand for /18–/22 blocks as grant recipients deploy new subscriber networks. This creates periodic supply tightening for mid-size ARIN blocks, particularly in rural U.S. markets.
What is the yield on leasing IPv4 addresses?
At current rates ($18.75/IP/month lease versus $20.30/IP purchase), the implied annualized yield exceeds 1,100%. This is an extraordinary return, though it depends on consistent lessee demand and block cleanliness.
Which block size is most frequently traded?
The /24 (256 IPs) was the most traded prefix size in Q3 2026, with 97 transactions. It represents the minimum routeable block size and is favored by small ISPs, hosting providers, and enterprises.
How do I sell my IPv4 addresses?
List your block with a qualified broker, ensure your RIR account is current and the block is transferable, verify there are no blacklist issues, and use escrow services to protect the transaction. Clean blocks with full documentation sell faster and at higher prices.
Are LACNIC IPv4 transfers getting faster?
Yes. Brokers report that LACNIC cross-RIR transfers — previously taking 4–6 months — are now completing in approximately 60 business days, with a target of 6–8 weeks. Over 15 /16 blocks have moved toward ARIN, RIPE, and APNIC through this improved process.
What is the average deal size in the IPv4 market?
The average deal size in Q3 2026 was 56,585 IPs, down from 69,704 in Q2 2026 and 102,956 in Q3 2025. The market is shifting toward smaller, more frequent transactions.
How does AI infrastructure affect IPv4 demand?
AI training clusters and inference farms require dedicated, non-NATed public IP addressing for inter-node communication and API endpoints. These buyers typically seek /16 or larger contiguous blocks, putting upward pressure on the large-block segment.
What makes an IPv4 block more valuable?
Key value factors are blacklist cleanliness, allocation age, RIR registry (ARIN and RIPE are most liquid), contiguity of the address range, and quality of transfer documentation. A clean, well-documented block can command 20–40% premiums over impaired inventory.
Will IPv4 prices go up in 2027?
Our year-end 2026 forecast of $19.69/IP suggests prices will remain in the $19–$21 band through at least early 2027. A recovery above $25 would require a significant demand catalyst such as accelerated BEAD deployments or renewed hyperscaler acquisitions.
What is the difference between ARIN and RIPE IPv4 pricing?
ARIN blocks averaged $19.38/IP versus $20.96/IP for RIPE in Q3 2026 — a spread of just $1.58. This gap has been narrowing, with ARIN pricing converging toward RIPE levels as cross-registry transfer friction decreases.
Should I buy IPv4 addresses as an investment?
IPv4 addresses can generate exceptional lease yields (over 1,100% annualized at current rates), but prices have declined 22.9% year-over-year. The investment case depends on your ability to lease the block reliably and your tolerance for continued price depreciation on the underlying asset.
How many total IPv4 transfers have been recorded?
Over the past 45 months, 34,966 total transfers have been recorded across all RIRs. RIPE accounts for 59.3% of historical transfers and ARIN for 40.7%. The peak month was December 2024.