15 min read
This report analyzes the IPv4 transfer market for Second Half 2023, based on completed IPv4Center marketplace transactions and official RIR transfer records.
Executive Summary
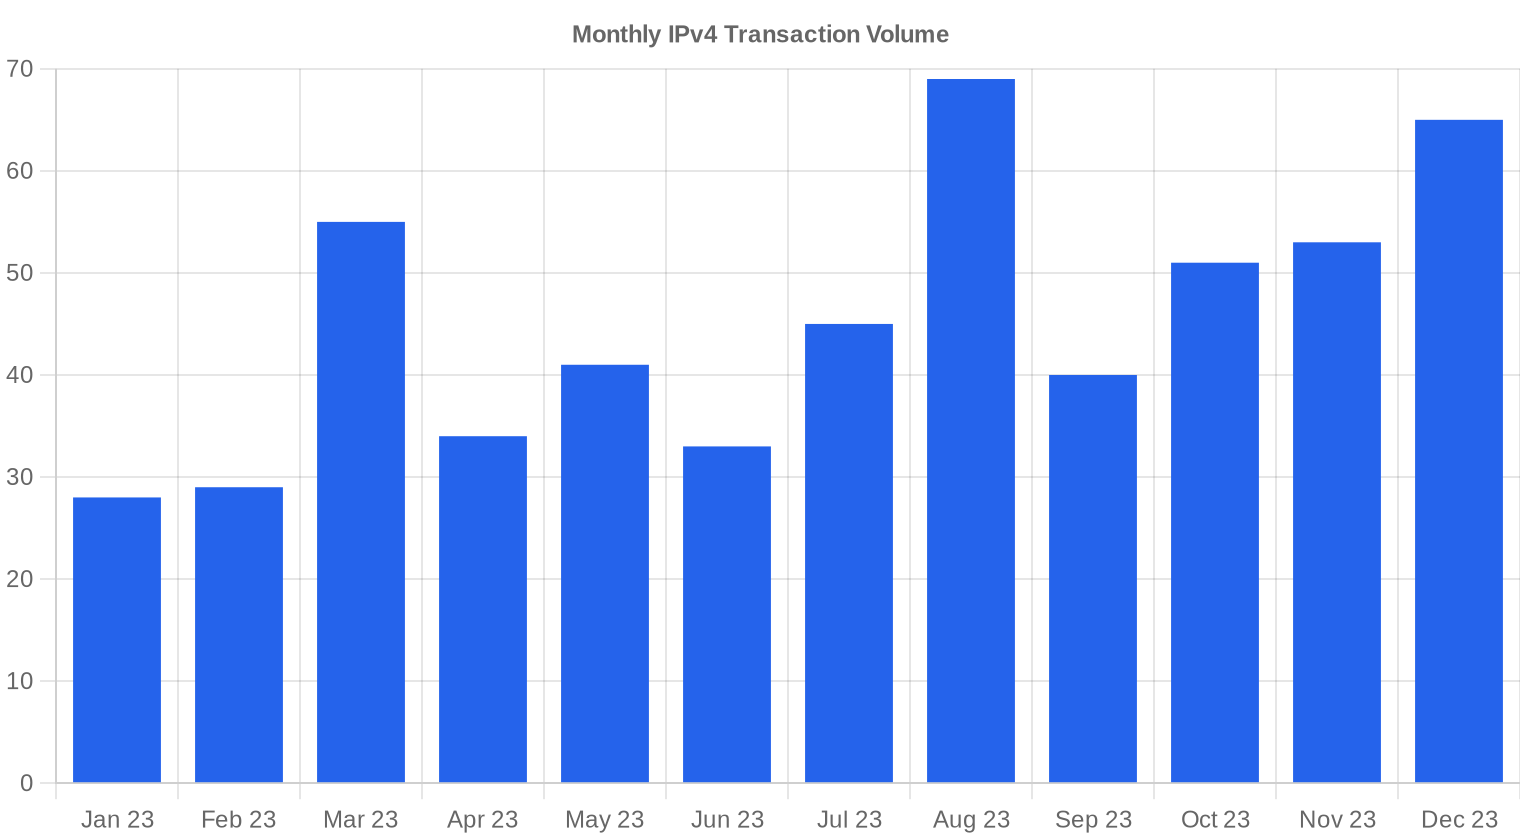
The IPv4 transfer market in the second half of 2023 recorded 323 transactions covering 882,176 addresses for a combined value of $33.6 million. Average pricing came in at $35.37 per IP, down 13.9% from the first half of 2023 — a meaningful correction that accelerated a trend visible since mid-year. Despite the price decline, transaction volume surged 46.8% versus H1, suggesting that lower prices are pulling latent demand off the sidelines. The median held at $35.00, only slightly below the mean, indicating a relatively tight distribution around the central price. The market's overall trajectory is clearly downward, with a 2.85% sequential decline in the regression trendline.Market Overview
| Transactions | 323 |
| IP Addresses Traded | 882,176 |
| Estimated Market Value | $33,578,734 |
| Average Price / IP | $35.37 |
| Median Price / IP | $35.00 |
| RIR Transfers | 4,907 |
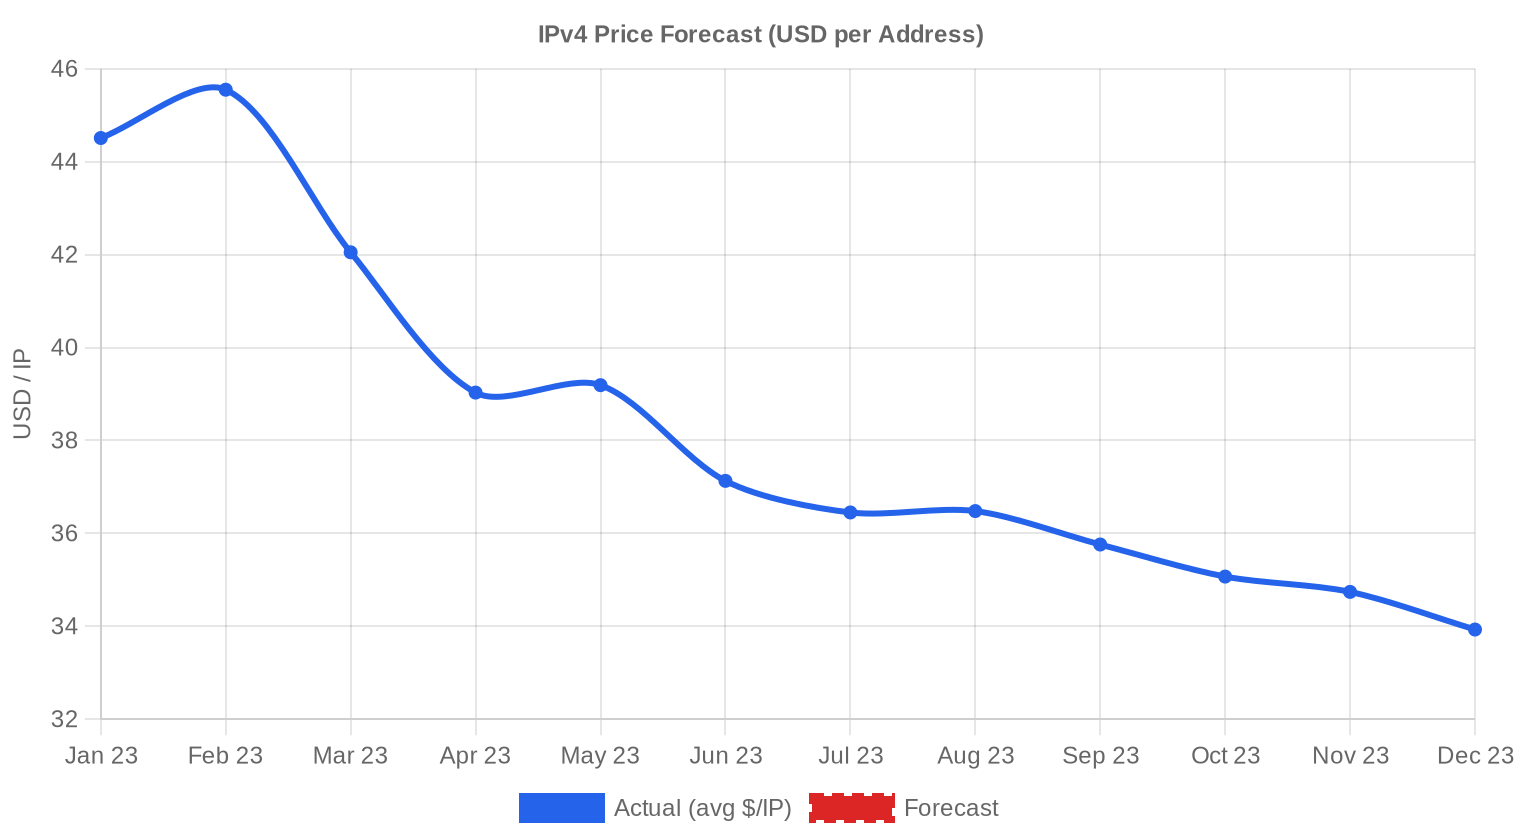
Price Dynamics
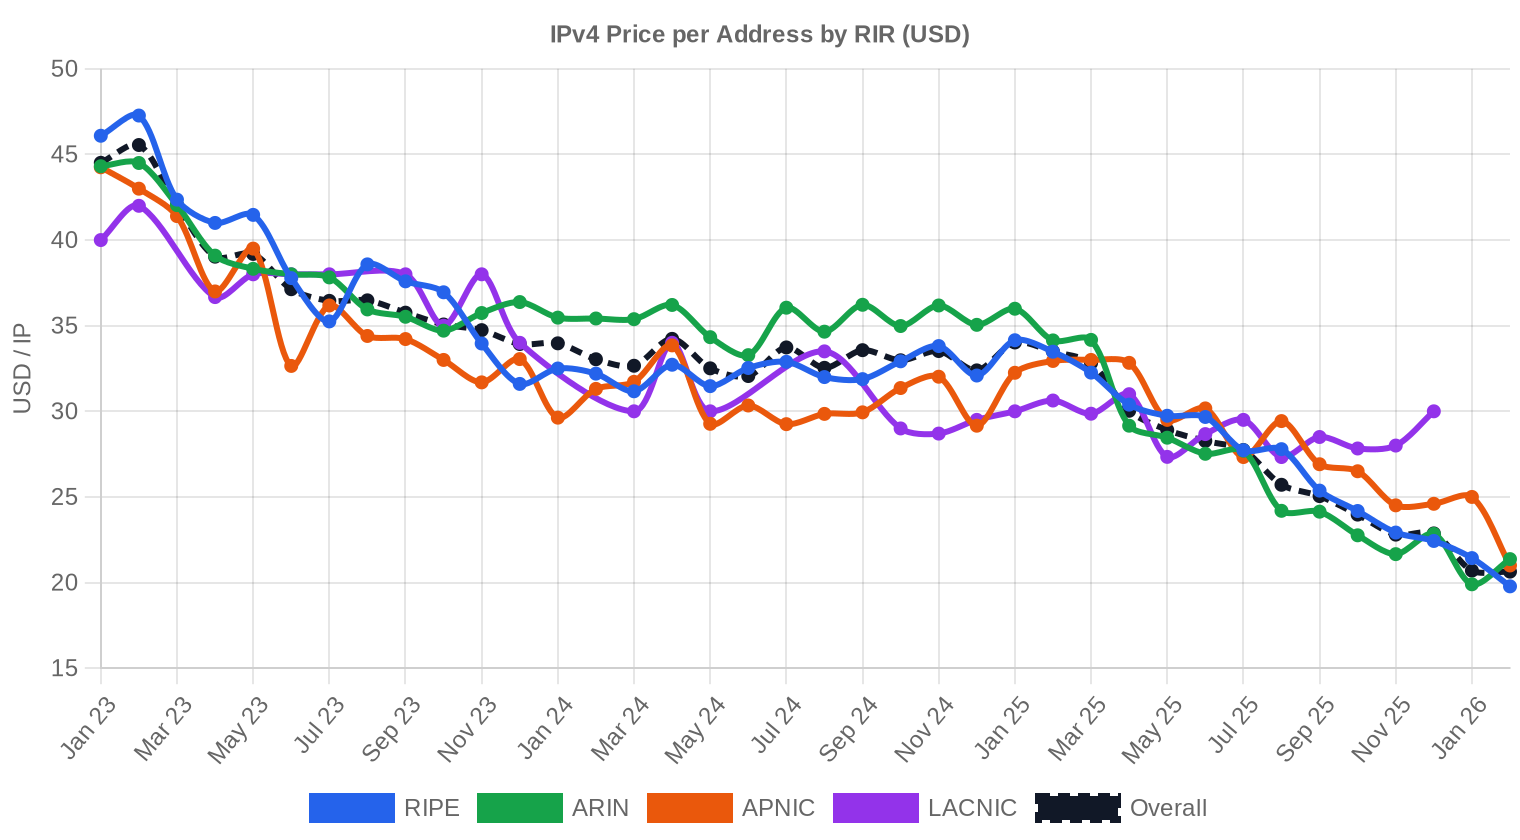
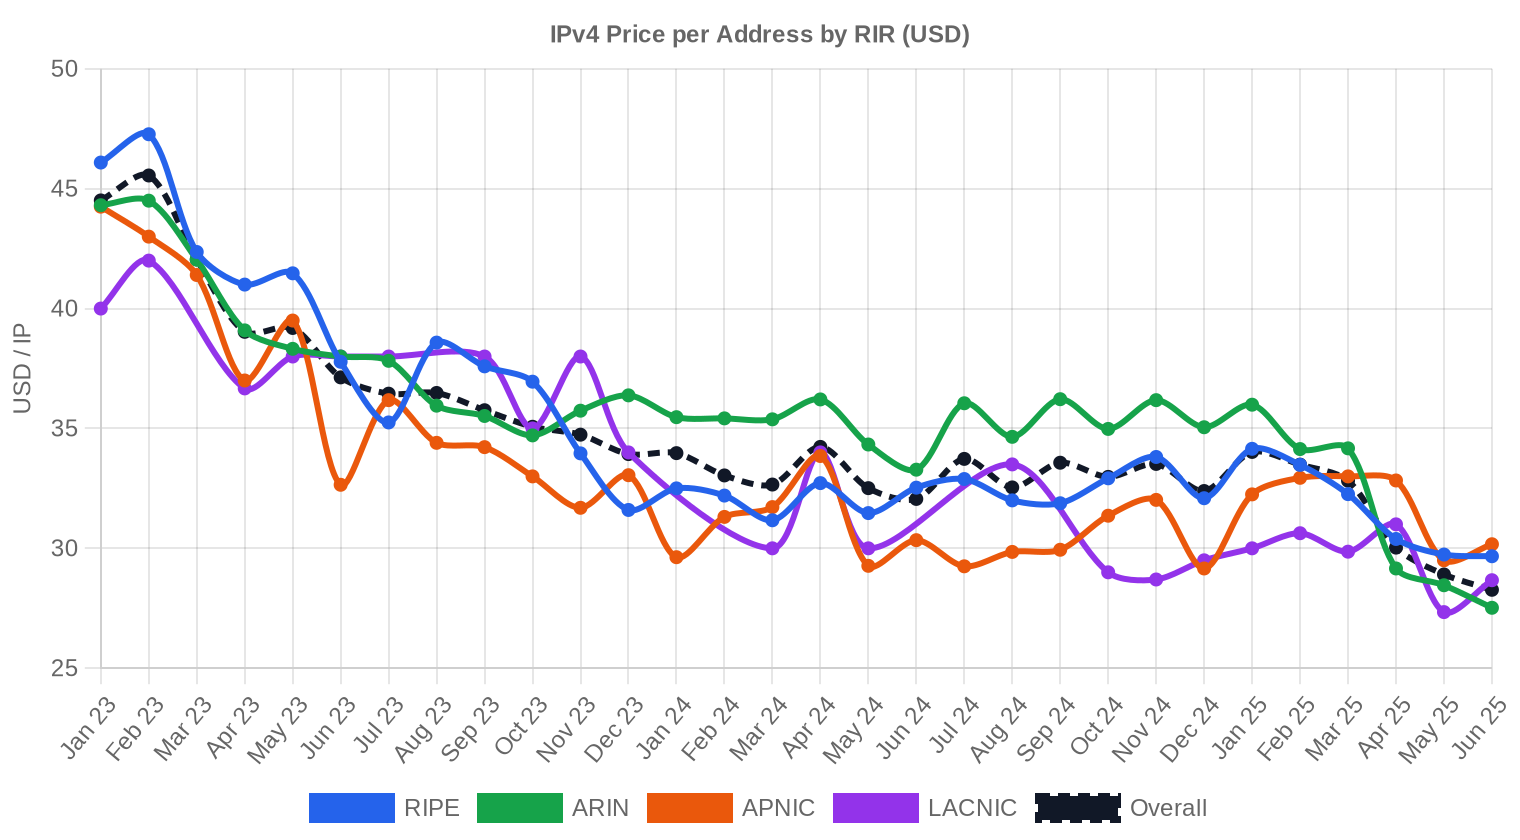
Prices ranged from $28 to $50 per IP during H2 2023, a $22 spread that reflects the persistent premium for clean, small blocks and the discount applied to large legacy allocations. The $28 floor appeared in RIPE transactions — the only region where pricing dipped below $30 — while the $50 ceiling was reached across RIPE, ARIN, and APNIC alike, typically on pristine /24s with no blacklist history. The 13.9% drop from H1's average is the steepest half-over-half decline we've tracked in recent periods, and it coincides with the AWS public IPv4 charge that went live in February 2024 but was announced in July 2023. That announcement effectively repriced the market's expectations: holders who had been sitting on blocks began moving inventory, and buyers recalibrated what they were willing to pay. The regression trend confirms the direction — prices ended the half weaker than they started.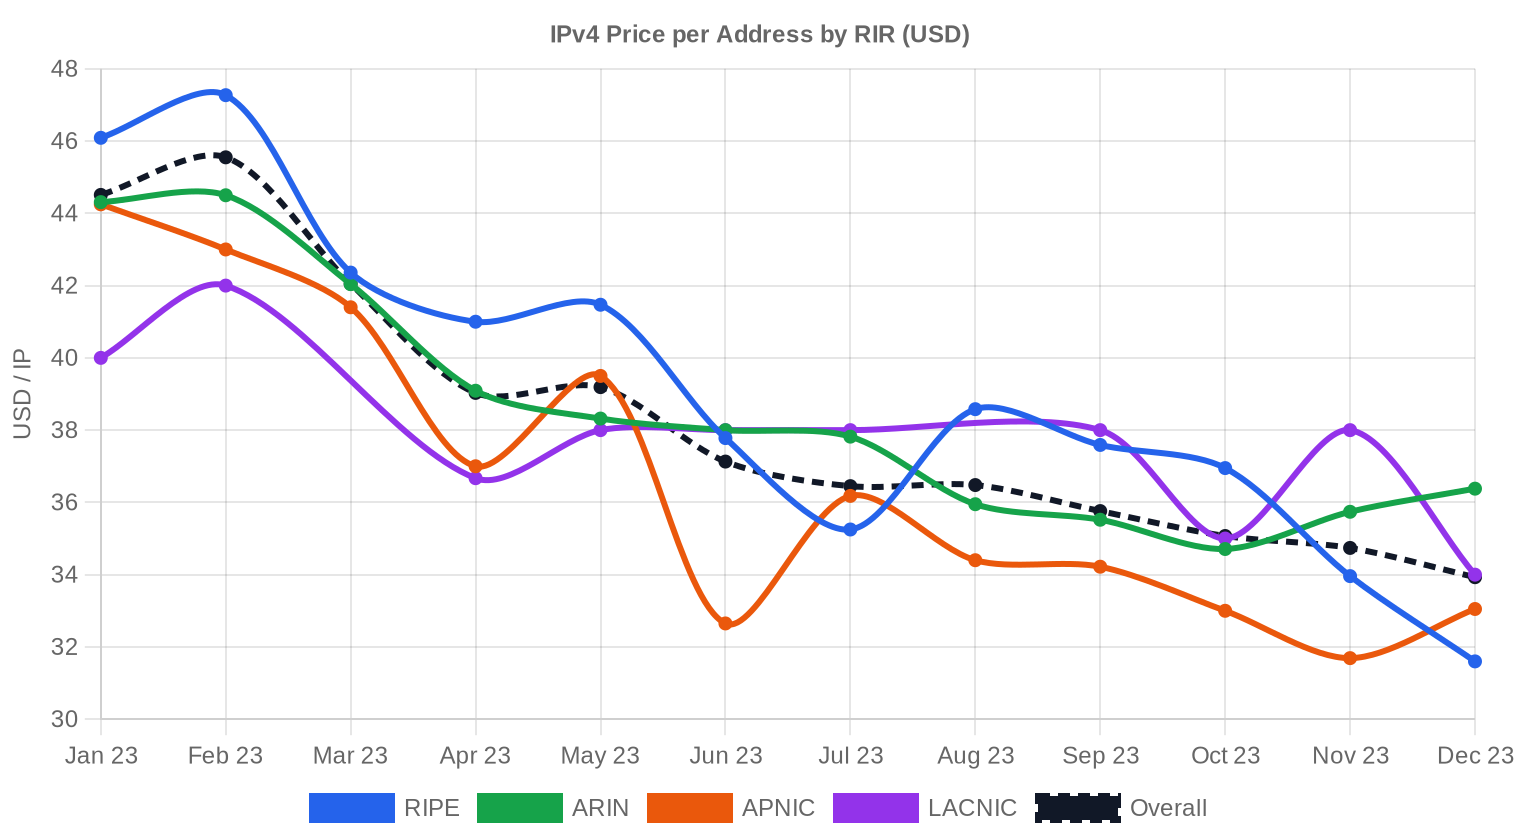
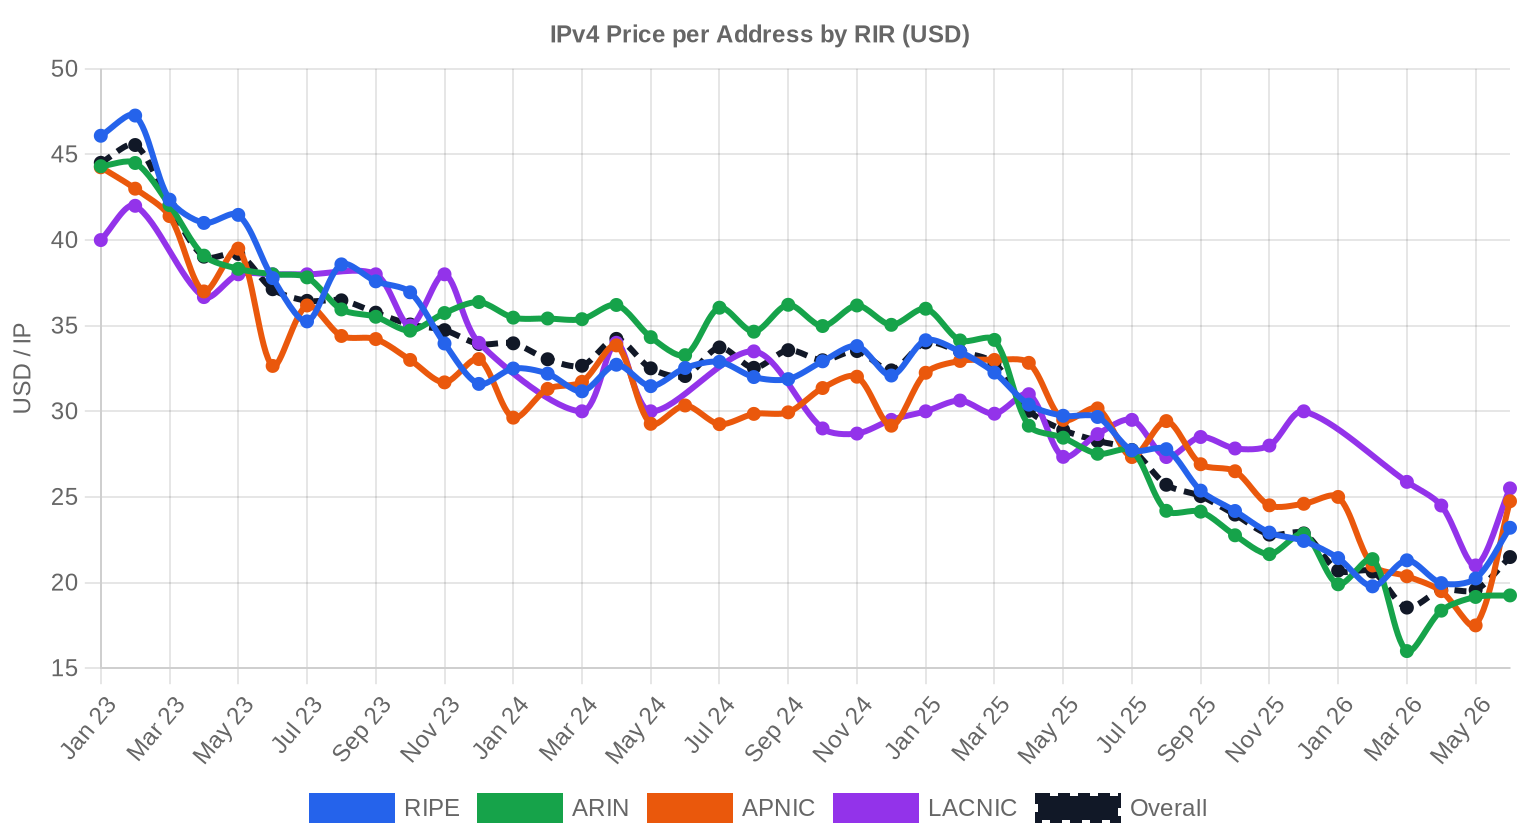
Pricing by RIR
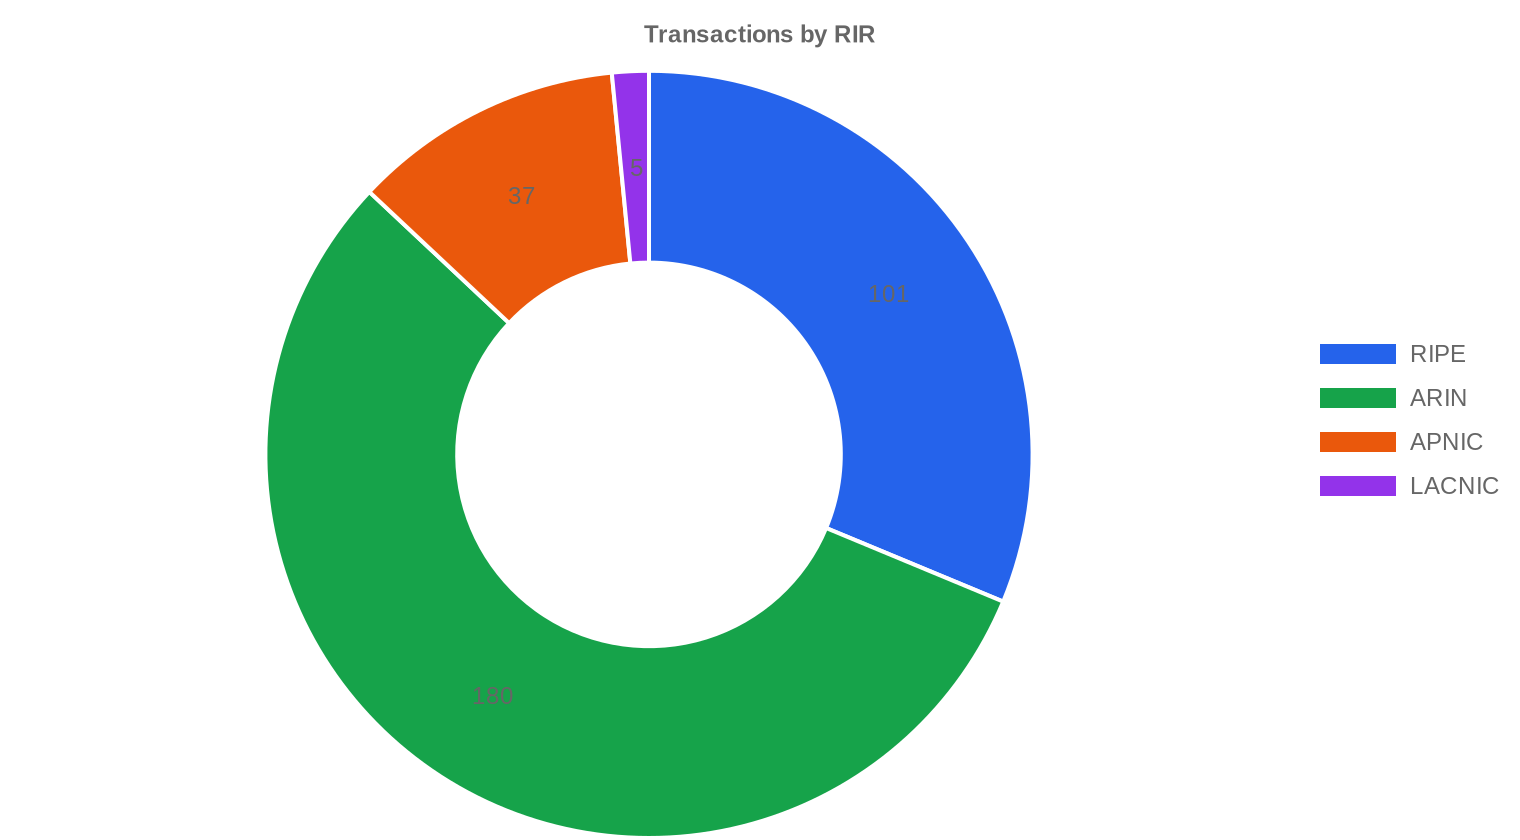
ARIN dominated deal flow with 55.7% of transaction volume, but it was LACNIC that posted the highest average price per IP at $36.60. The ARIN-RIPE pricing gap has narrowed to under a dollar — $35.87 versus $34.93 — which is the closest convergence we've seen between these two registries. APNIC came in cheapest at $33.93, reflecting both thinner liquidity and a buyer base that has grown more price-sensitive as regional alternatives (including leasing) gain traction.ARIN: $35.87/IP across 180 transactions (55.7% of volume).
RIPE: $34.93/IP across 101 transactions (33.0% of volume).
APNIC: $33.93/IP across 37 transactions (7.5% of volume).
LACNIC: $36.60/IP across 5 transactions (1.6% of volume).
AFRINIC: No recorded transactions this period.
| RIR | Transactions | Avg $/IP | Median $/IP | IPs Traded | RIR Transfers | Next Month (proj.) | Year-End (proj.) |
|---|---|---|---|---|---|---|---|
| RIPE | 101 | $34.93 | $35.00 | 291,328 | 3,235 | $31.50 | $30.00 |
| ARIN | 180 | $35.87 | $35.75 | 510,720 | 1,672 | $34.50 | $34.00 |
| APNIC | 37 | $33.93 | $33.00 | 66,048 | 0 | $32.50 | $32.00 |
| LACNIC | 5 | $36.60 | $38.00 | 14,080 | 0 | $34.00 | $33.00 |
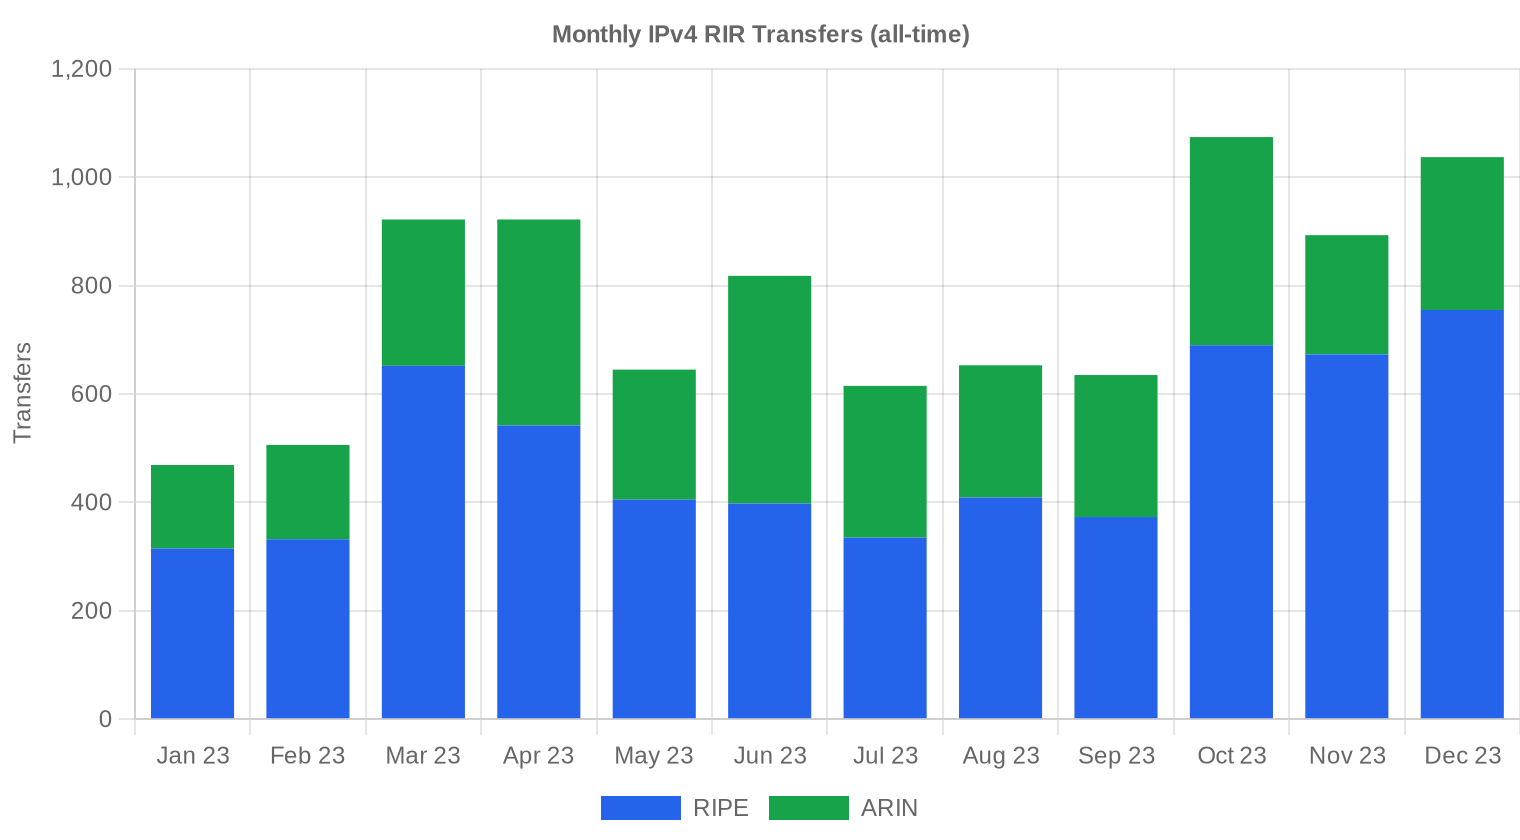
Transaction Volume
Supply & Block Sizes
The /24 remained the most traded prefix size with 130 transactions — roughly 40% of all deals. This dominance reflects the structural reality that smaller operators, startups, and enterprises overwhelmingly need a single /24 to run mail servers, host websites, or anchor a BGP announcement. Larger blocks (/20 and above) traded less frequently but accounted for a disproportionate share of dollar volume, with the seven deals exceeding $1 million representing $10.4 million, or 31% of total market value.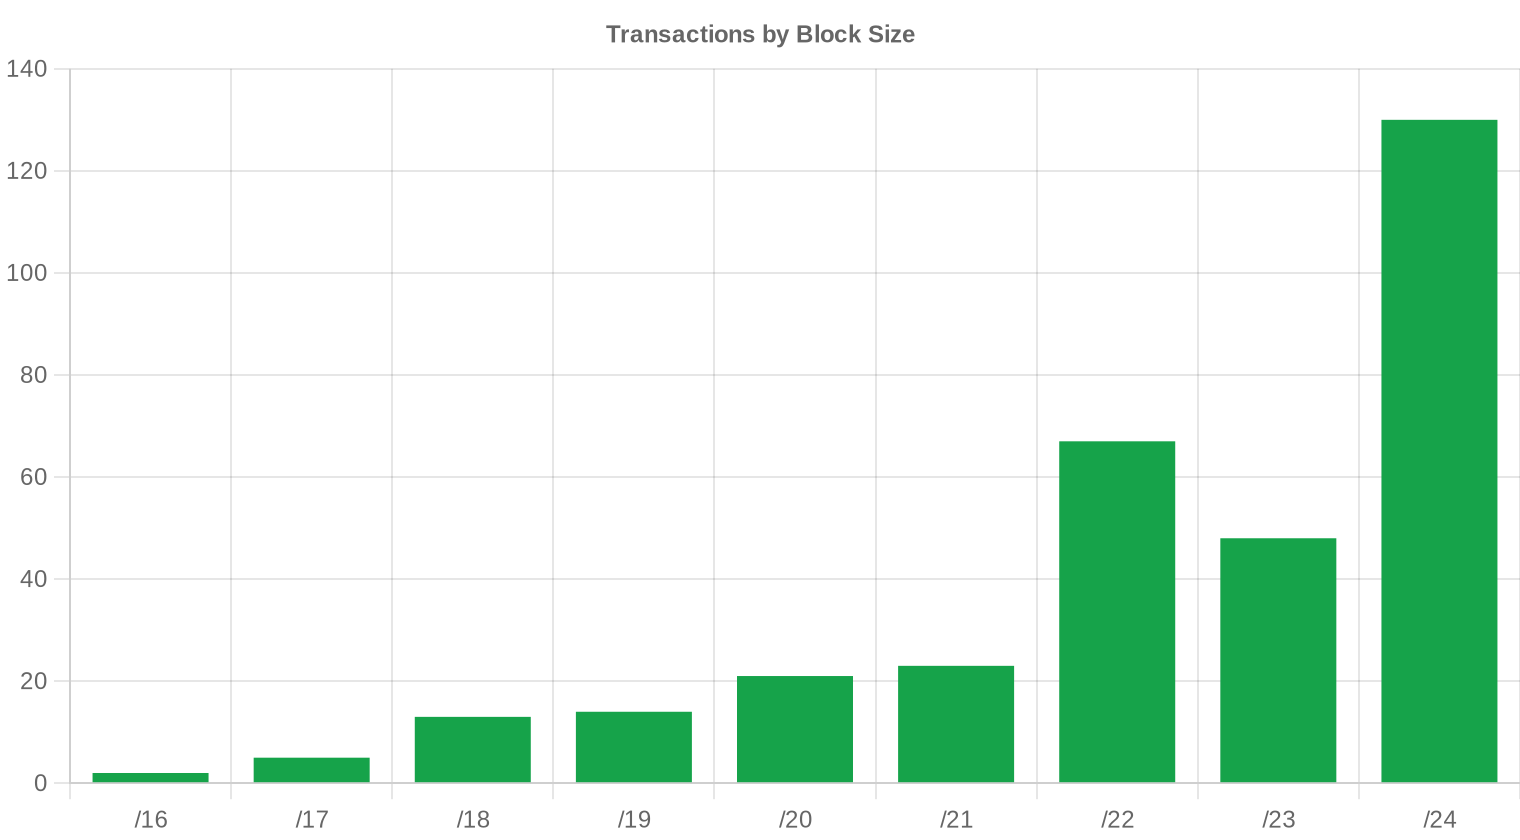
Geographic Activity
Country-level distribution data was not captured for this period. Anecdotally, U.S. and Western European entities continued to drive the bulk of activity, consistent with ARIN and RIPE accounting for nearly 89% of transactions between them.Registry Transfer Activity
Official RIR transfer logs recorded 4,907 transfers during H2 2023 — a figure that captures both market sales and intra-organizational restructurings. RIPE led the transfer registries with 3,235 recorded transfers (65.9% of the total), dwarfing ARIN's 1,672. The gap between RIPE's transfer count and its transaction share in our pricing data (31.3%) reflects the high volume of non-market transfers — mergers, group reorganizations, and policy-driven movements — that are endemic to the RIPE region.Long-Run Transfer Trends
Over the trailing 12 months through the end of H2 2023, a total of 9,189 transfers were logged across all RIRs. October 2023 was the peak month, which aligns with a pattern we've seen in prior years: Q4 budget flush drives a spike in both transfers and acquisitions as enterprises deploy remaining capex. RIPE accounted for 64% of the 12-month transfer total versus ARIN's 36% — a ratio that has been remarkably stable for several consecutive periods.| RIR | RIR Transfers |
|---|---|
| RIPE | 5,879 |
| ARIN | 3,310 |
| RIR Transfers | 9,189 |
Outlook & Forecast
Forecasting each block-size band and RIR separately with our AI model:
The overall average price per IP is projected to reach $33.03 by December 2023, with a next-month estimate of $33.53 per IP.
- RIPE: projected at $31.50 per IP next month, trending toward $30.00 by December 2023.
- ARIN: projected at $34.50 per IP next month, trending toward $34.00 by December 2023.
- APNIC: projected at $32.50 per IP next month, trending toward $32.00 by December 2023.
- LACNIC: projected at $34.00 per IP next month, trending toward $33.00 by December 2023.
- AFRINIC: insufficient data for a reliable forecast.
Forecast by Block Size
| Block | Current $/IP | Next Month | Year-End | Confidence |
|---|---|---|---|---|
| /24 | $34.00 | $34.00 (0.0%) | $33.00 (-2.9%) | medium |
| /23 | $32.50 | $32.00 (-1.5%) | $31.00 (-4.6%) | medium |
| /22 | $33.00 | $33.00 (0.0%) | $33.00 (0.0%) | medium |
| /21 | $33.25 | $33.00 (-0.8%) | $32.00 (-3.8%) | low |
| /20 | $32.50 | $33.00 (+1.5%) | $34.00 (+4.6%) | medium |
| /19 | $34.50 | $34.00 (-1.4%) | $34.00 (-1.4%) | low |
| /18-/16 | $37.50 | $37.50 (0.0%) | $39.00 (+4.0%) | low |
| /15-up | $51.50 | $51.00 (-1.0%) | $53.00 (+2.9%) | low |
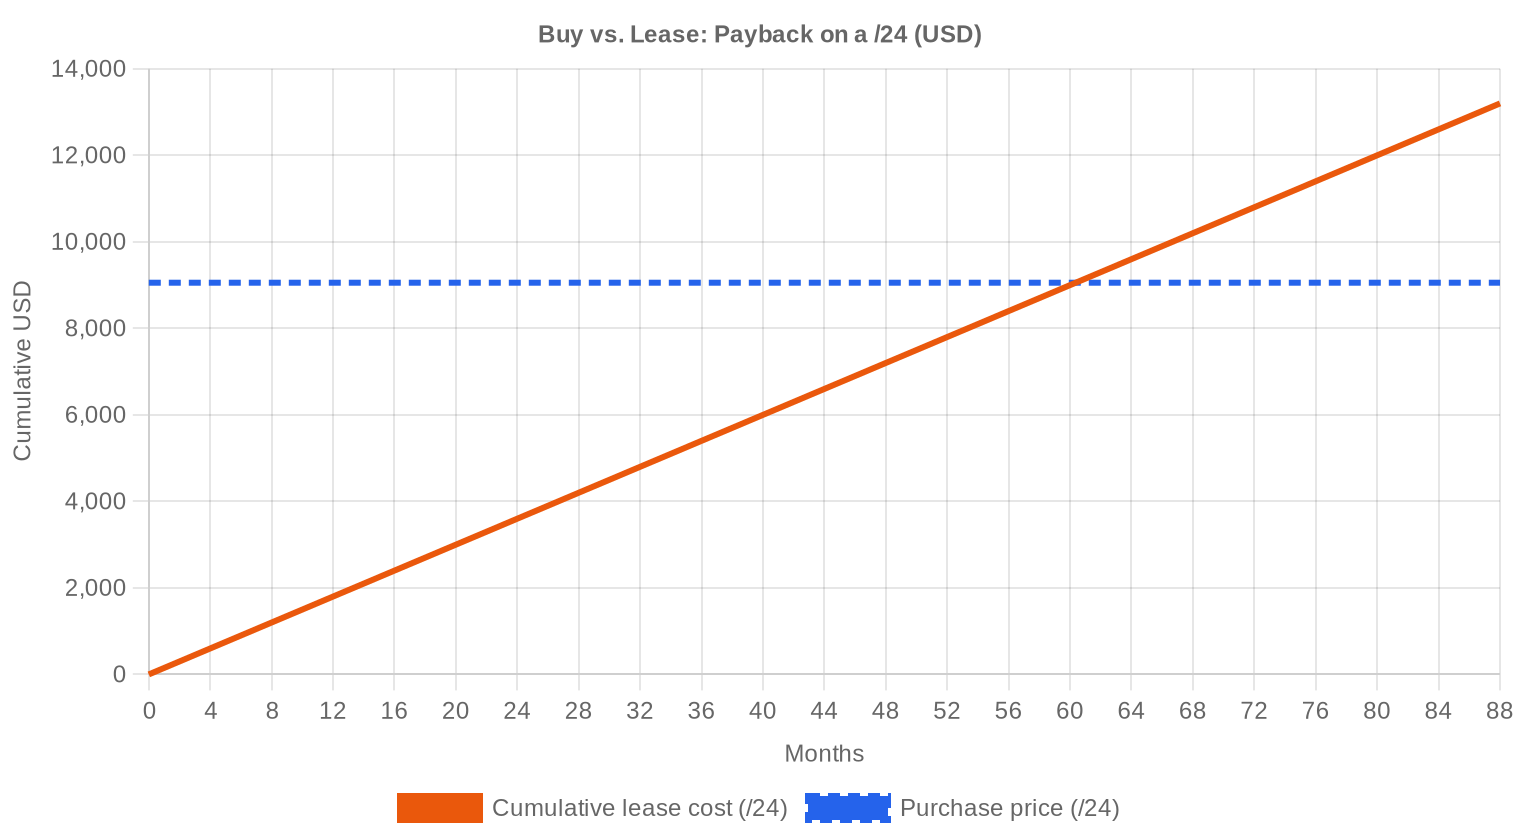
Editor's Take: Buy vs. Lease
The buy-versus-lease calculus tilted firmly toward buying in H2 2023. At $0.5859 per IP per month on the lease side and $35.37 on the purchase side, the breakeven sits at roughly 60 months — just over five years. Any entity planning to hold addresses beyond that horizon is better off buying outright. The implied annual yield for lessors is 19.9%, which remains attractive enough to keep a supply of leased blocks on the market but is down from peak levels as purchase prices have fallen faster than lease rates have adjusted. For organizations needing space for three years or less, leasing still makes economic sense. But for ISPs, hosting companies, and anyone building infrastructure with a five-plus-year useful life, purchase at current levels looks like the right call — especially if prices continue to soften into 2024.| /24 Purchase price | $9,055 |
| /24 Lease price | $150 / mo |
| Payback period | 60.4 mo (5.0 yr) |
| Gross annual yield | 19.9% |
What This Means for You
Buyers: You're operating in the most favorable pricing environment since early 2021. The 13.9% drop from H1 gives you real negotiating leverage, and the forecast suggests further softening into early 2024. Don't rush — but don't expect a collapse either. The floor is probably somewhere in the low $30s.Sellers: The window for extracting $40+ per IP on standard blocks is closing. If you're holding inventory that you acquired above current market, your exit calculus needs to account for continued price erosion. Moving blocks now at $35-36 beats holding for a $33 print next quarter.
Leasers: At $0.59/IP/month, leasing remains viable for short-duration needs. But the gap between lease economics and purchase economics has widened — if your planning horizon exceeds five years, the math clearly favors ownership.
Block Holders: If you have unused legacy space, the 19.9% annualized yield from leasing is compelling. That said, accelerating price declines could erode the capital value of your holdings. Consider a blended strategy: lease a portion for income, sell a portion to lock in current valuations.
Browse verified IPv4 blocksSell IPv4 →
List your blocks with managed transferLease IPv4 →
Flexible short-term capacityLease Out IPv4 →
Turn idle blocks into recurring revenue
IPv4 Pricing by Block Size
The per-IP premium on /24 blocks remained significant — buyers routinely paid $40-50 per IP for clean single /24s, while larger blocks in the /20 to /16 range traded closer to $30-33. This 30-40% premium for /24s reflects the scarcity of clean, immediately usable small blocks and the operational overhead of managing a single-block transaction versus a bulk purchase. For budget-conscious buyers, a /22 or /21 at $33-34 per IP and then subnetting to /24s can be a materially better deal.| Block | IPs | Buy: /IP | Buy: Total | Lease: /IP/mo | Lease: Monthly |
|---|---|---|---|---|---|
| /24 | 256 | $35–45 | $8,960–11,520 | $0.38–0.50 | $97–128 |
| /22 | 1,024 | $28–38 | $28,672–38,912 | $0.33–0.45 | $338–461 |
| /20 | 4,096 | $22–32 | $90,112–131,072 | $0.30–0.40 | $1,229–1,638 |
| /18 | 16,384 | $20–30 | $327,680–491,520 | $0.30–0.38 | $4,915–6,226 |
| /16 | 65,536 | $18–28 | $1,179,648–1,835,008 | $0.30–0.35 | $19,661–22,938 |
IPv4 Price History: 2011–2026
IPv4 addresses first became a traded commodity in 2011 following IANA's final allocation of /8 blocks to the RIRs. Prices started below $10 per IP and climbed steadily through the 2010s, accelerating sharply in 2021 to peak near $55-60 per IP on some transactions. AWS's July 2023 announcement that it would begin charging $0.005/hour ($3.60/month) per public IPv4 address marked a turning point — it both created a new source of demand for owned space and simultaneously signaled to the market that the era of free addressing was over. Prices have since bifurcated: small clean blocks still command premiums, but the broad average has corrected roughly 35% from peak levels.| Year | ~Price/IP | Key Event |
|---|---|---|
| 2011 | $7–12 | IANA free pool exhausted; Microsoft/Nortel deal ($11.25/IP) |
| 2012 | $8–12 | RIPE NCC reaches last /8; begins /22-only allocation |
| 2014 | $10–15 | LACNIC free pool exhausted |
| 2015 | $8–15 | ARIN free pool exhausted |
| 2017–18 | $12–18 | Leasing market grows; cloud demand rises |
| 2019 | $18–24 | RIPE NCC exhausts remaining free pool |
| 2021–22 | $50–60+ | Post-pandemic peak; hyperscaler build-outs |
| 2024 | $35–52 | AWS IPv4 charge ($0.005/IP/hr); large block correction |
| 2025–26 | $18–45 | Market bifurcation; /16s below $20 for first time since 2019 |
Market Structure: Who Is Buying & Selling
The buyer side in H2 2023 was dominated by mid-tier cloud providers, regional ISPs, and hosting companies — entities that need routable space but lack the scale to justify the hyperscaler approach of hoarding /8s. On the sell side, the usual suspects: legacy corporate holders divesting unused allocations from the pre-CIDR era, bankruptcy estates, and early speculators who bought at $25-30 and are taking profits before prices fall further. The 46.8% jump in transaction count suggests that sellers are becoming more motivated, which is consistent with a market that expects lower prices ahead.IPv4 vs. Other Asset Classes
At a 19.9% implied annual yield from leasing, IPv4 addresses outperform virtually every conventional asset class — 10-year Treasuries at ~4.5%, investment-grade corporate bonds at 5-6%, and even most real estate cap rates at 5-8%. The catch is liquidity: selling a block takes weeks to months, not seconds, and the market has no centralized exchange or clearing mechanism. Still, for investors comfortable with illiquid alternative assets, the risk-adjusted return on a clean /16 held for lease income is hard to beat in the current rate environment.| Asset Class | Typical Yield | Liquidity | Primary Risk |
|---|---|---|---|
| IPv4 | 19.9% | Moderate | IPv6 adoption, block quality |
| Commercial Real Estate | 5–8% | Low | Vacancy, rate cycle |
| Investment-Grade Bonds | 4–5% | High | Duration, credit risk |
| S&P 500 | ~1,3% | High | Market volatility |
| Money Market / T-Bills | ~4–5% | High | Rate cycle changes |
IPv6 Adoption & Why IPv4 Remains Essential
IPv6 adoption continues its glacial march — Google's IPv6 connectivity measurements crossed 40% globally in late 2023, but the number obscures massive regional variation. Large consumer ISPs in the U.S. and Europe have deployed dual-stack broadly, yet enterprise networks, SMB hosting, and IoT deployments remain overwhelmingly IPv4-dependent. The coexistence phase will extend well into the 2030s, which means IPv4 addresses retain fundamental utility value regardless of IPv6 progress.AI & Cloud Infrastructure Demand
The AI infrastructure buildout is a net positive for IPv4 demand, though its impact is more indirect than headlines suggest. Large training clusters typically sit behind NAT or use private addressing, but the inference layer — API endpoints, edge deployments, model-serving infrastructure — requires publicly routable space. As every major cloud and enterprise spins up inference capacity, the incremental demand for /24s and /23s to front these services is real and growing.What Determines IPv4 Block Value
Not all IPv4 blocks are created equal. Blacklist contamination — from prior use in spam, botnet C2, or bulletproof hosting — can knock 20-30% off a block's value and add weeks of remediation work. Allocation age matters too: blocks with long, clean WHOIS history command premiums. RIR jurisdiction affects transferability, with ARIN and RIPE blocks being the most liquid and AFRINIC blocks effectively untradeable given the ongoing governance crisis. A clean /24 with no spam history, held in ARIN or RIPE, sitting on a legacy allocation, is the gold standard.Sell vs. Lease: A Decision Framework
For holders sitting on unused blocks in a declining price environment, the sell-versus-lease decision hinges on your view of the next 24-36 months. If you believe prices will stabilize around $30-32, leasing at $0.59/IP/month generates better cumulative returns than a sale within three years. But if you think the AWS effect and growing IPv6 adoption will push prices into the mid-$20s, selling now at $35 and redeploying capital elsewhere is the sharper move. The 19.9% lease yield buys you time, but only if the underlying asset doesn't depreciate faster than your income stream.| /24 Purchase price | $9,055 |
| /24 Lease price | $150 / mo |
| Payback period | 60.4 mo (5.0 yr) |
| Gross annual yield | 19.9% |
RIPE NCC 24-Month Transfer Restriction
RIPE's 24-month holding requirement — which prevents a transferee from re-selling a block for two years after acquisition — continues to act as a supply brake in the European market. It discourages speculation and fast flipping, which keeps RIPE pricing slightly more stable than ARIN's but also reduces liquidity. Buyers in the RIPE region should factor this lock-up into their planning, especially if there's any chance they'll need to divest within two years.Deal Size Distribution
Average deal size dropped sharply to $103,959 from $165,410 in H1 — a 37% decline that signals a shift toward smaller transactions. The bulk of activity (245 of 323 deals) fell below $50,000, accounting for only $4.5 million of the $33.6 million total. Meanwhile, the seven deals above $1 million generated $10.4 million — 31% of total value from just 2% of transactions. This top-heavy value distribution is typical of IPv4 markets, where a handful of large block trades drive aggregate numbers while the /24 market churns steadily underneath.Top Trading Countries
Country-level granularity is not available for this period's dataset. Based on RIR distribution, ARIN-region activity (predominantly U.S. and Canada) accounted for 55.7% of deals, with RIPE-region countries (led by the Netherlands, Germany, and the UK based on historical patterns) making up another third. APNIC-region deals, likely concentrated in Australia and parts of Southeast Asia, represented a smaller but consistent slice at 37 transactions.BEAD Broadband Program Impact
The $42.5 billion BEAD program began issuing state-level allocations in H2 2023, and the downstream IPv4 demand from funded ISP buildouts is still ahead of us. Most BEAD-funded projects will require /22 to /20 blocks to address new subscriber bases in underserved rural areas, which will tighten supply in precisely the mid-range block sizes where liquidity is already thin. We expect BEAD-driven purchasing to become a visible market factor by mid-2024, potentially creating a floor under prices for blocks in the /20 to /18 range.Hyperscaler IPv4 Holdings
Amazon, Microsoft, and Google collectively control an estimated 100+ million IPv4 addresses — enough to influence the market simply by choosing to hold, sell, or lease at the margins. AWS's decision to charge for public IPv4 addresses was the single most consequential market event of 2023, and its ripple effects are still propagating through buyer and seller behavior. If any of the hyperscalers were to begin divesting even a fraction of their holdings, it would add meaningful supply and accelerate the downward price trend.Macroeconomic Conditions & Market Impact
Higher-for-longer interest rates throughout H2 2023 increased the carrying cost of holding IPv4 as a non-yielding asset (for those not leasing), which likely contributed to the uptick in sell-side activity. Enterprise IT budgets remained cautious — Gartner's spending forecasts showed 3-4% growth, barely keeping pace with inflation — and many organizations deferred non-critical infrastructure purchases. The combination of motivated sellers and budget-constrained buyers is precisely the dynamic that drives prices lower, and it's unlikely to reverse until rate cuts materially loosen financial conditions.Model Update & Calibration
As part of our continuous improvement process, we backtested previous forecasts against realised prices and fine-tuned the model accordingly. Recent months now carry more influence than older data, and the confidence bands have been widened or narrowed based on how well they captured actual outcomes in the past. You can see the full backtest results in the table and chart below.
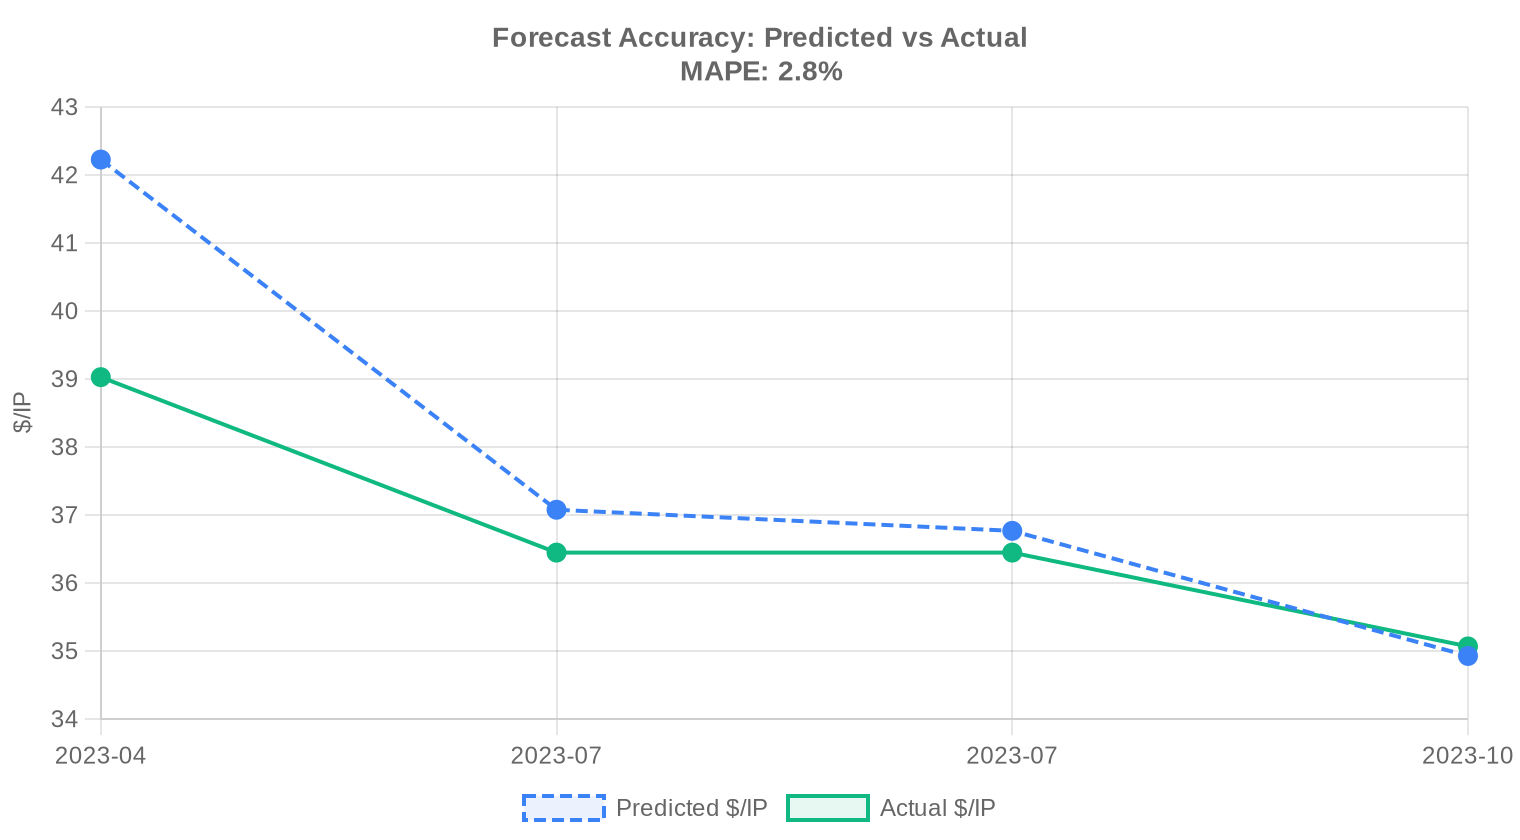
| Report Period | Target Month | Predicted | Actual | Deviation |
|---|---|---|---|---|
| 2023-Q1 | 2023-04 | $42 | $39 | +8% |
| 2023-H1 | 2023-07 | $37 | $36 | +2% |
| 2023-Q2 | 2023-07 | $37 | $36 | +1% |
| 2023-Q3 | 2023-10 | $35 | $35 | 0% |
Methodology
Figures are based on completed IPv4Center marketplace transactions and RIR transfer statistics. Prices are in US dollars per IP address. Forecasts are produced by an AI model that analyses each block-size band and RIR segment separately (with outlier-trimmed medians) alongside known market catalysts; they are estimates, not guarantees.
Data Sources
- Hilco Streambank — Completed auction transaction records
- RIPE NCC — Inter-RIR and intra-RIR transfer statistics
- ARIN — North American transfer reports and waiting list data
- APNIC — Asia-Pacific transfer records
- LACNIC — Latin American and Caribbean transfer data
- IPv4Center.com — Proprietary marketplace transaction and lease pricing data
This report is generated automatically for informational purposes only and does not constitute financial advice.
Frequently Asked Questions
What was the average price per IPv4 address in H2 2023?
The market-wide average landed at .37 per address, with a median of . This represents a modest decline of roughly 2.85% over the period — the first sustained softening we've tracked in several semesters.
How many transactions closed in the second half of 2023, and what was the total dollar volume?
We recorded 323 priced transactions encompassing 882,176 addresses for an aggregate consideration of approximately .6 million. The average deal size was roughly 104,000 addresses (roughly a /15), suggesting institutional buyers continued to dominate flow.
Which RIR region commanded the highest per-IP prices in H2 2023?
LACNIC space was the priciest at .60 per IP on average, though the sample was thin — just five transactions covering 14,080 addresses. ARIN came in second at .87. Scarcity in the Latin American region and limited secondary-market inventory continue to support a premium.
Why did ARIN account for the largest share of transaction volume?
ARIN represented 55.7% of all priced transactions (180 deals, ~511K addresses, ~.7M in value). North American enterprises remain the most active acquirers, and ARIN's relatively mature transfer framework keeps friction costs low compared to other registries.
How did RIPE NCC pricing compare to ARIN in this period?
RIPE averaged .93 per IP versus ARIN's .87 — a .94 discount. RIPE's floor was also lower at versus for ARIN. The narrowing gap suggests European demand remains healthy but supply has kept pace, particularly for smaller blocks.
Were there any transactions in the AFRINIC region?
Zero. AFRINIC recorded no priced market transactions in H2 2023. Ongoing governance uncertainties and policy ambiguity around inter-RIR transfers continue to effectively freeze that market.
What was the most commonly traded prefix size?
The /24 dominated with 130 transactions — roughly 40% of all deals. This is the minimum globally routable block and functions as the retail unit of the IPv4 market, particularly popular with small cloud providers and startup networks.
What is the price range buyers should expect for a single /24 block?
Based on H2 2023 data, a /24 (256 addresses) typically traded between ,168 (at the floor) and ,800 (at the ceiling), with the median implying roughly ,960. ARIN-registered /24s skewed higher, with a floor of (,680 per block).
Is the IPv4 market trending up or down heading into 2024?
Down, modestly. Prices declined approximately 2.85% through H2 2023. Our forecast model — which we consider reliable for this dataset — projects a year-end 2023 average of .03 and a near-term trajectory around .53. This is not a collapse; it's a controlled deceleration.
What mistakes should buyers avoid in the current softening market?
The most common error is panic-buying large blocks at ask prices to 'lock in' before a rebound that may not materialize. With averages trending toward , paying + per IP for anything other than clean, pre-vetted ARIN space with pristine reputation is overpaying. Patience is currently rewarded.
What are the risks of leasing IPv4 addresses instead of buying at current rates?
At .59 per IP per month (~.03 annually), the breakeven versus a purchase at .37 is approximately 60 months — about five years. If you need addresses for longer than that, leasing is the more expensive path. Additionally, lessees bear counterparty risk: if the lessor's block gets blacklisted or the lease is terminated, you lose your addressing with limited recourse.
At what point does buying become more economical than leasing?
Our amortization model puts the crossover at roughly 60.4 months — just over five years. For a /24, that's a purchase at ~,055 versus cumulative lease payments of 0/month that reach the same total around month 60. If your planning horizon exceeds five years, buying is the clear winner, yielding an implied 19.9% annual return versus leasing.
How liquid is the market for large blocks (>M transactions)?
Thin but meaningful. Only seven transactions exceeded million in H2 2023, yet those seven deals accounted for .4 million — roughly 31% of total market value. Large-block liquidity remains concentrated among a handful of specialized brokers, and bid-ask spreads widen considerably above /16.
What does the deal-size distribution look like?
The market is heavily retail-weighted: 245 of 323 transactions (76%) were under K, but they contributed only .5M — about 13% of total value. The 34 deals above 0K drove M, or roughly two-thirds of all dollar volume. This is a classic Pareto market.
How active was the inter-RIR and intra-RIR transfer system in H2 2023?
Total recorded transfers across all RIRs reached 4,907 in the trailing twelve months through the period, with RIPE handling roughly 64% of transfer volume (3,235 transfers) and ARIN at 36% (1,672). APNIC, LACNIC, and AFRINIC registered negligible or zero transfer activity.
Why does RIPE lead in transfer count but trail ARIN in transaction value?
RIPE's 3,235 transfers versus ARIN's 1,672 reflects the European registry's higher volume of small-block housekeeping transfers, many of which are intra-organizational or M&A-related reassignments that don't carry market pricing. ARIN's deals are fewer but fatter — larger blocks, higher per-unit prices.
Is IPv6 adoption reducing demand for IPv4 addresses?
Not at a pace that matters to the H2 2023 market. While global IPv6 capability continues to climb, enterprise procurement cycles, legacy application dependencies, and the sheer installed base of IPv4-only infrastructure keep demand structurally elevated. The 2.85% price decline is driven by supply normalization, not an IPv6 substitution effect.
What risks does continued IPv6 deployment pose to IPv4 asset values over the next 2-3 years?
The primary risk is a demand-side step-function — a major hyperscaler or government mandate that shifts material traffic to IPv6-only. Our view: this remains a tail risk through 2025. The more probable path is gradual erosion of 3-5% annually, consistent with the softening already visible in H2 2023 pricing.
How long does a typical IPv4 transfer take to complete?
ARIN transfers generally close in 30-60 days end-to-end, including needs justification review. RIPE transfers can be faster — often 2-4 weeks — given less onerous justification requirements. APNIC varies widely. Buyers should budget 45-60 days as a planning assumption across all RIRs.
What are the risks of buying IPv4 blocks with poor reputation or blacklist history?
Significant. A block that appears on major spam or abuse blacklists (Spamhaus, CBL, etc.) can take months to rehabilitate, during which it is effectively unusable for email, hosting, or any customer-facing service. Diligence on block history is non-negotiable — buyers have paid market price for blocks that turned out to be functionally worthless.
Did APNIC-region pricing diverge from the broader market in H2 2023?
Yes, to the downside. APNIC averaged .93 per IP with a median of — roughly .50 below the global average. Thirty-seven transactions covering about 66K addresses suggest a smaller, more price-sensitive buyer cohort. The - range mirrors ARIN, but the central tendency sits lower.
What should sellers know about current market conditions before listing blocks?
Sellers face a buyer's market for the first time in several years. With averages drifting toward and forecasts pointing lower, holding out for + requires either exceptional block quality (clean history, large contiguous space, ARIN-registered) or patience. Blocks priced at or below are clearing; those above are sitting.
What was the highest price per IP observed in H2 2023?
The ceiling was per IP, observed across RIPE, ARIN, and APNIC transactions. These outliers likely represent small, highly desirable blocks — clean /24s with established routing history — sold to buyers willing to pay a premium for immediate usability.
Is now a good time to build an IPv4 portfolio as a financial investment?
The implied annual yield of 19.9% via leasing remains attractive, but the underlying asset is depreciating at roughly 3% per half on current trend. Net of depreciation, the carry is still compelling versus fixed income, but this is not 2021 — capital gains are unlikely. Treat it as an income play, not a growth bet.
What should organizations avoid when planning IPv4 procurement in a declining price environment?
Three pitfalls stand out: locking into long-term lease contracts at today's rates when purchase prices may fall further; overpaying for LACNIC or AFRINIC space on scarcity narratives unsupported by actual demand; and neglecting transfer-policy compliance, which can delay or void transactions regardless of what you paid.