15 min read
This report analyzes the IPv4 transfer market for 2023, based on completed IPv4Center marketplace transactions and official RIR transfer records.
Executive Summary
The IPv4 transfer market processed 543 transactions in 2023, moving 1,661,696 addresses at a total value of $69.97 million. The average price per IP settled at $37.68, with the median just below at $37.50 — a tight spread that signals a mature, well-priced market. Prices drifted lower by 0.28% on trend, a soft decline but a decline all the same. ARIN accounted for 57.3% of transactional activity by count, and the average deal size came in at roughly 128,856 IPs per transaction — heavily skewed by a handful of large block trades. The market functioned efficiently, with no major dislocations or anomalous pricing events through the year.Market Overview
| Transactions | 543 |
| IP Addresses Traded | 1,661,696 |
| Estimated Market Value | $69,968,916 |
| Average Price / IP | $37.68 |
| Median Price / IP | $37.50 |
| RIR Transfers | 9,189 |
Price Dynamics
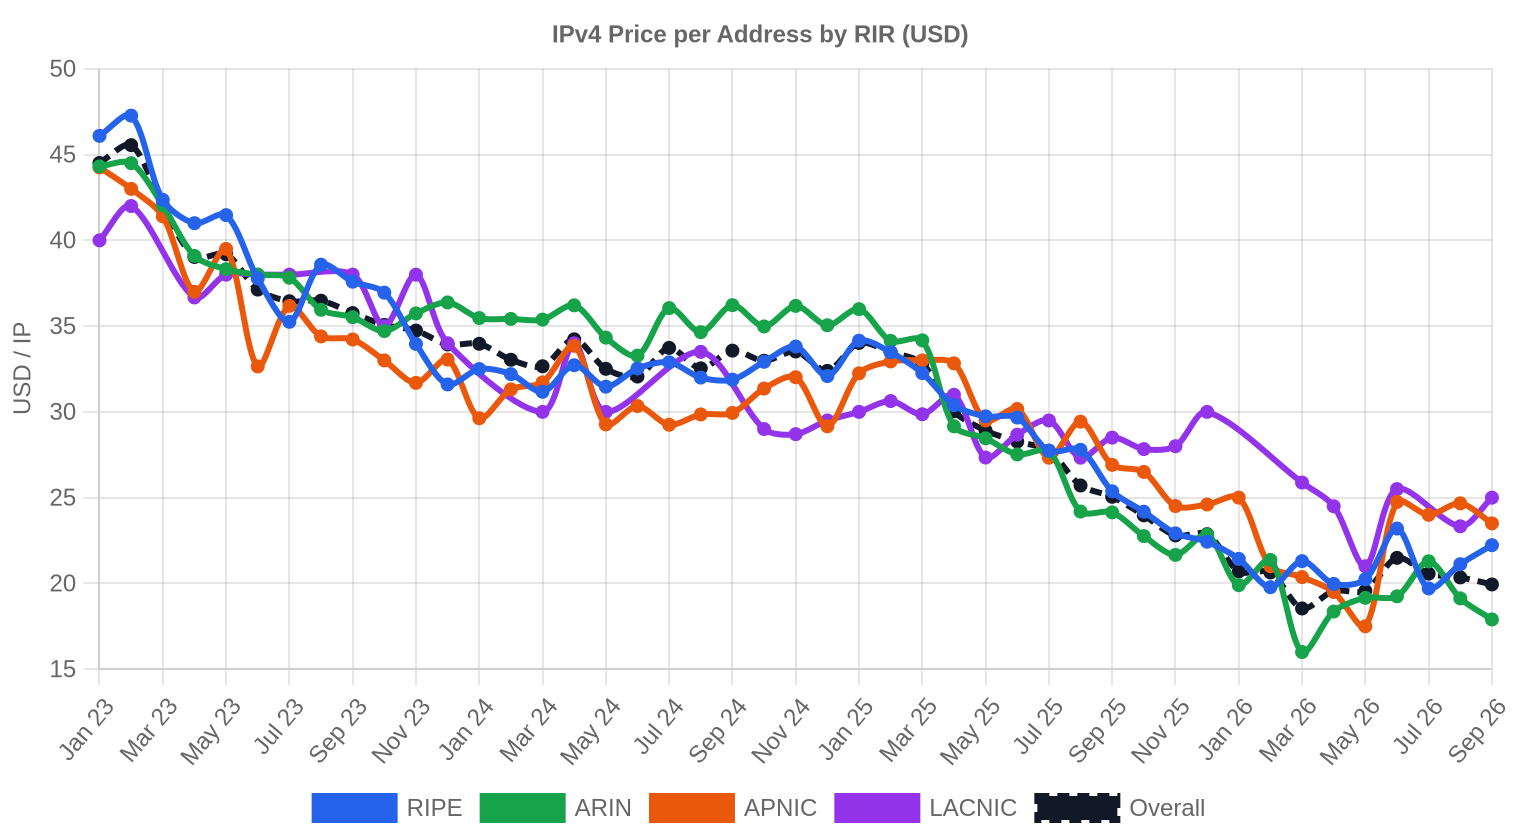
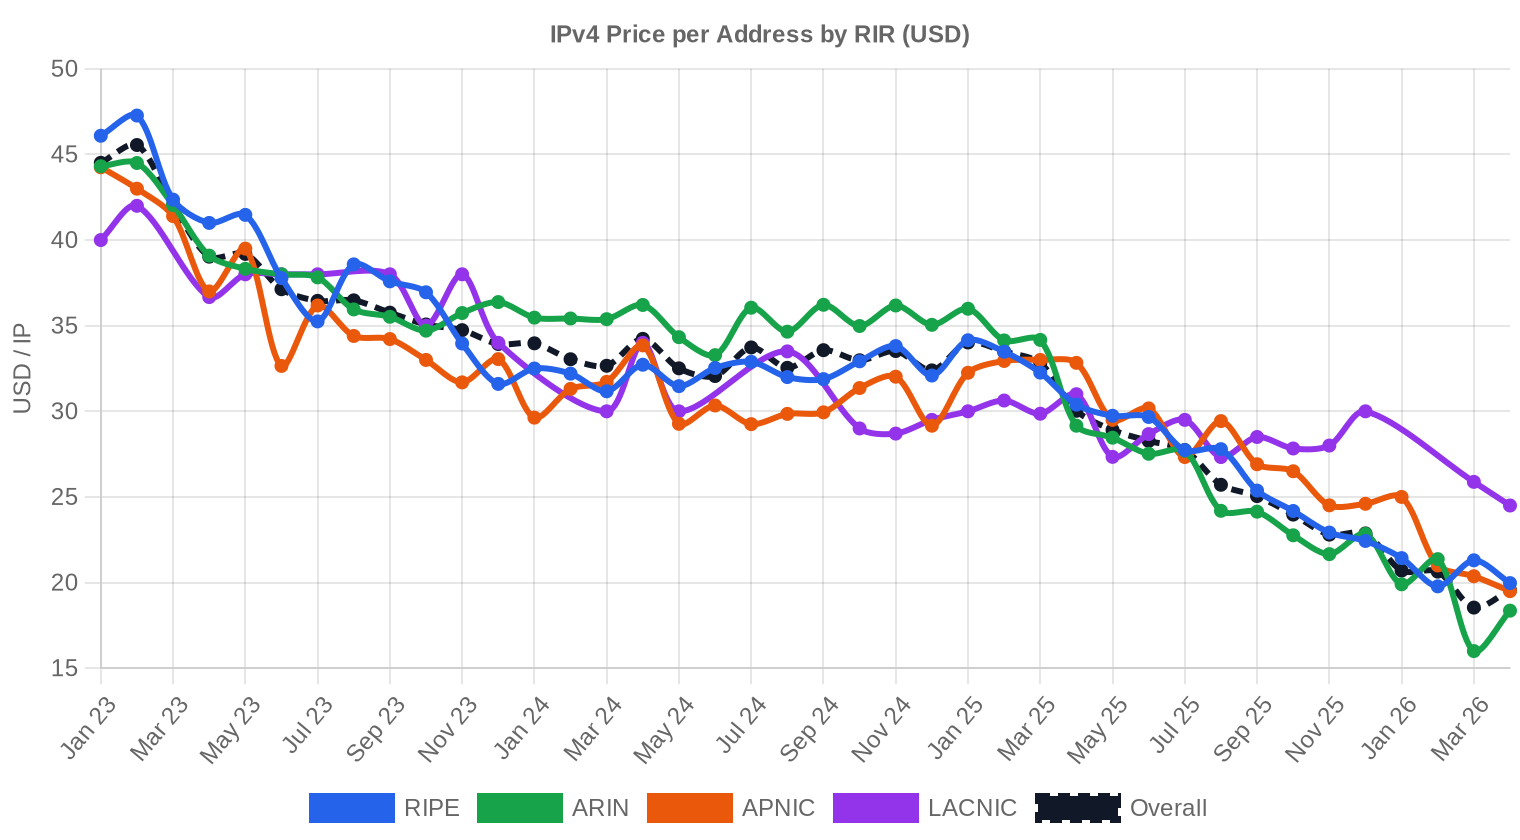
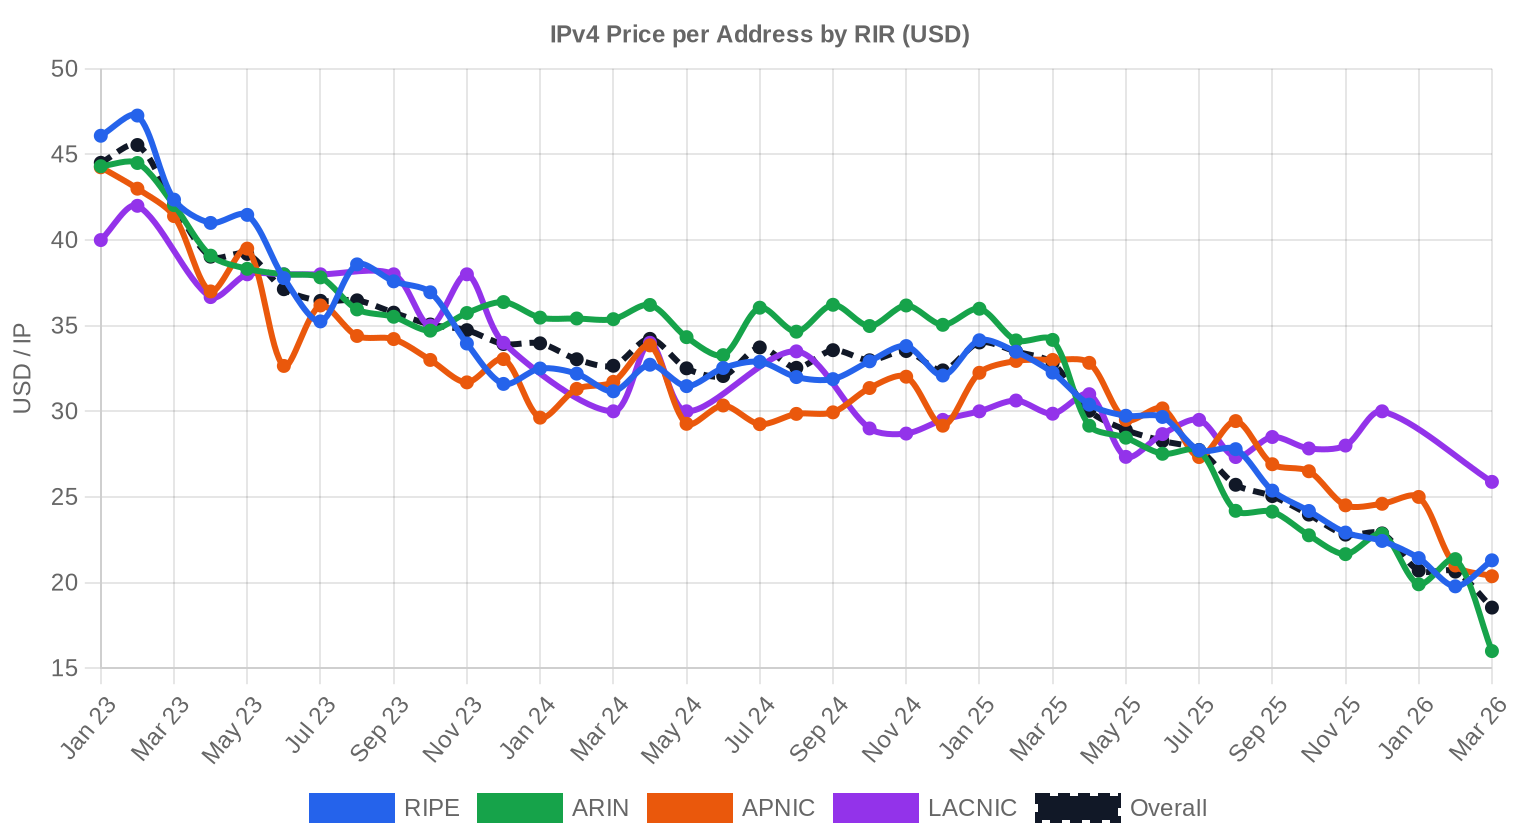
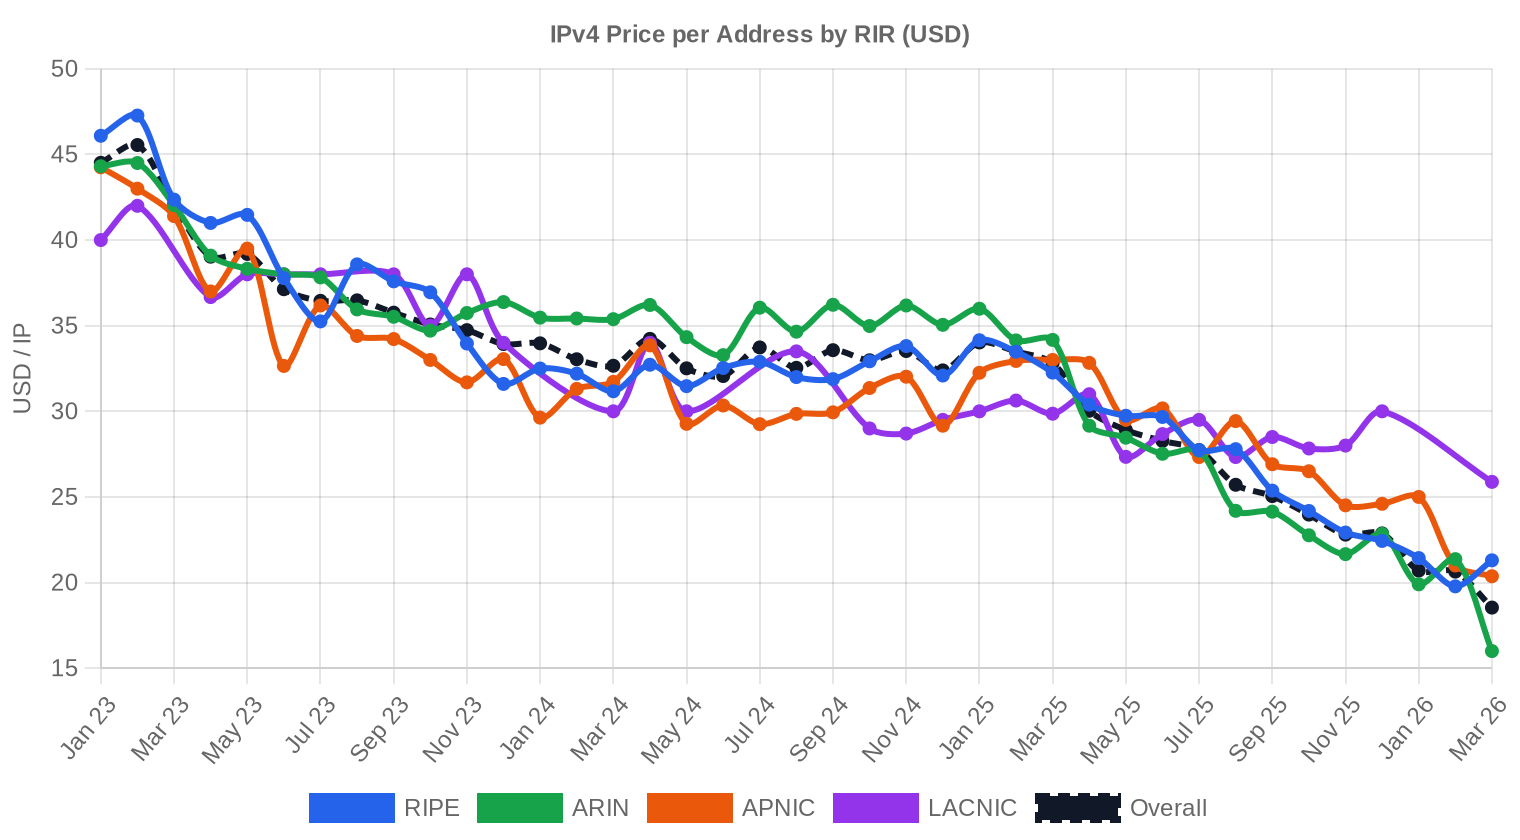
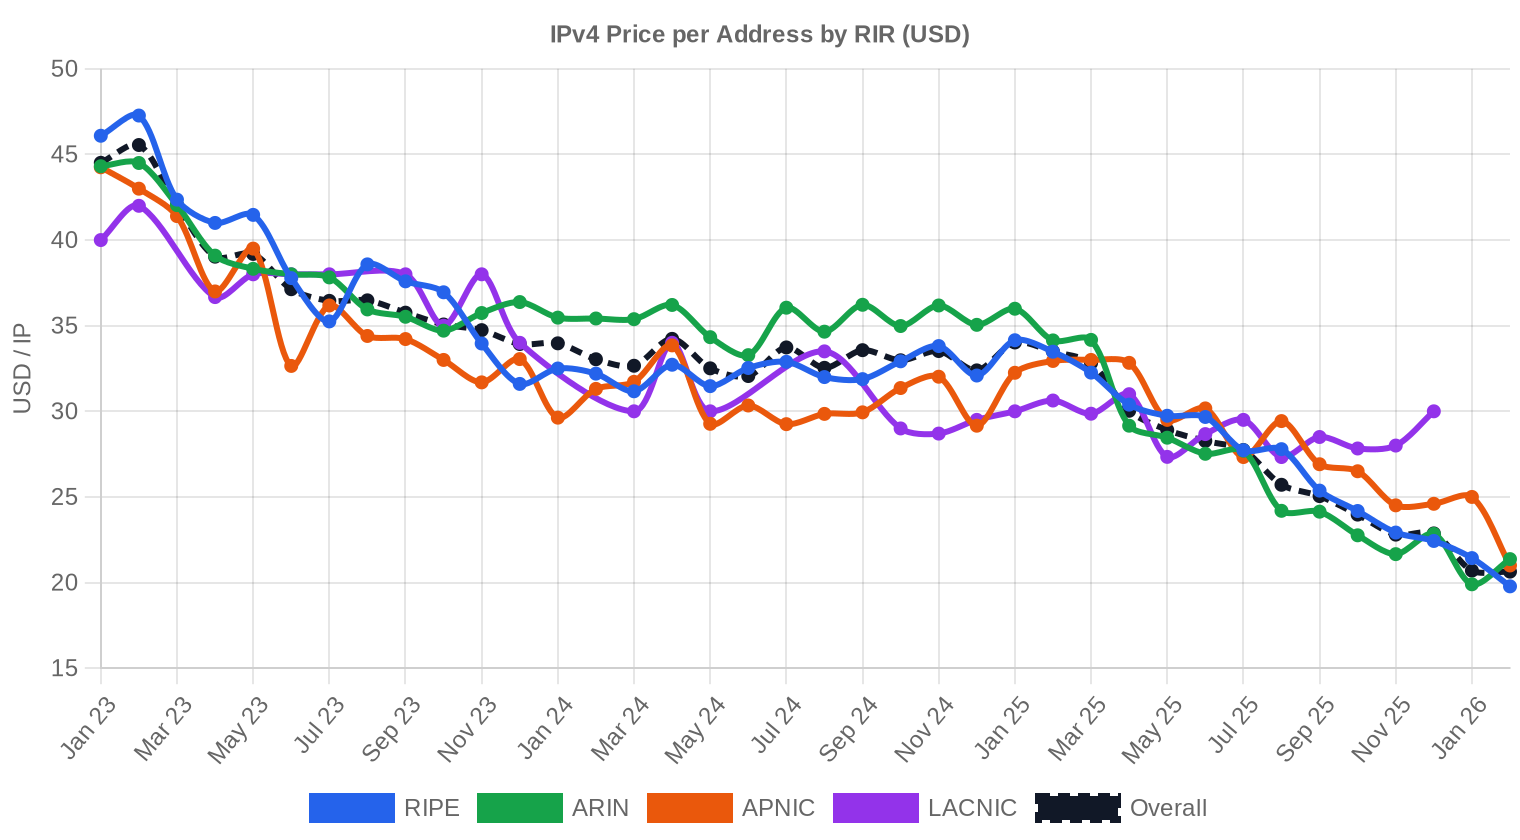
The per-IP range ran from $28 at the floor to $53 at the top — a $25 spread that reflects the persistent premium differential between small, clean blocks and larger legacy inventory moving at discount. The median of $37.50 sitting this close to the average of $37.68 tells us the distribution was fairly symmetric, without fat tails distorting the picture. The regression trend reads down, but at -0.28% it barely registers as directional — more plateau than retreat. What changed is the momentum. After years of upward grind, 2023 was the year the market stopped climbing and started thinking about where equilibrium actually lives. With buyers pushing back on $40+ asks and sellers unwilling to capitulate below the mid-$30s, we got a year of standoff.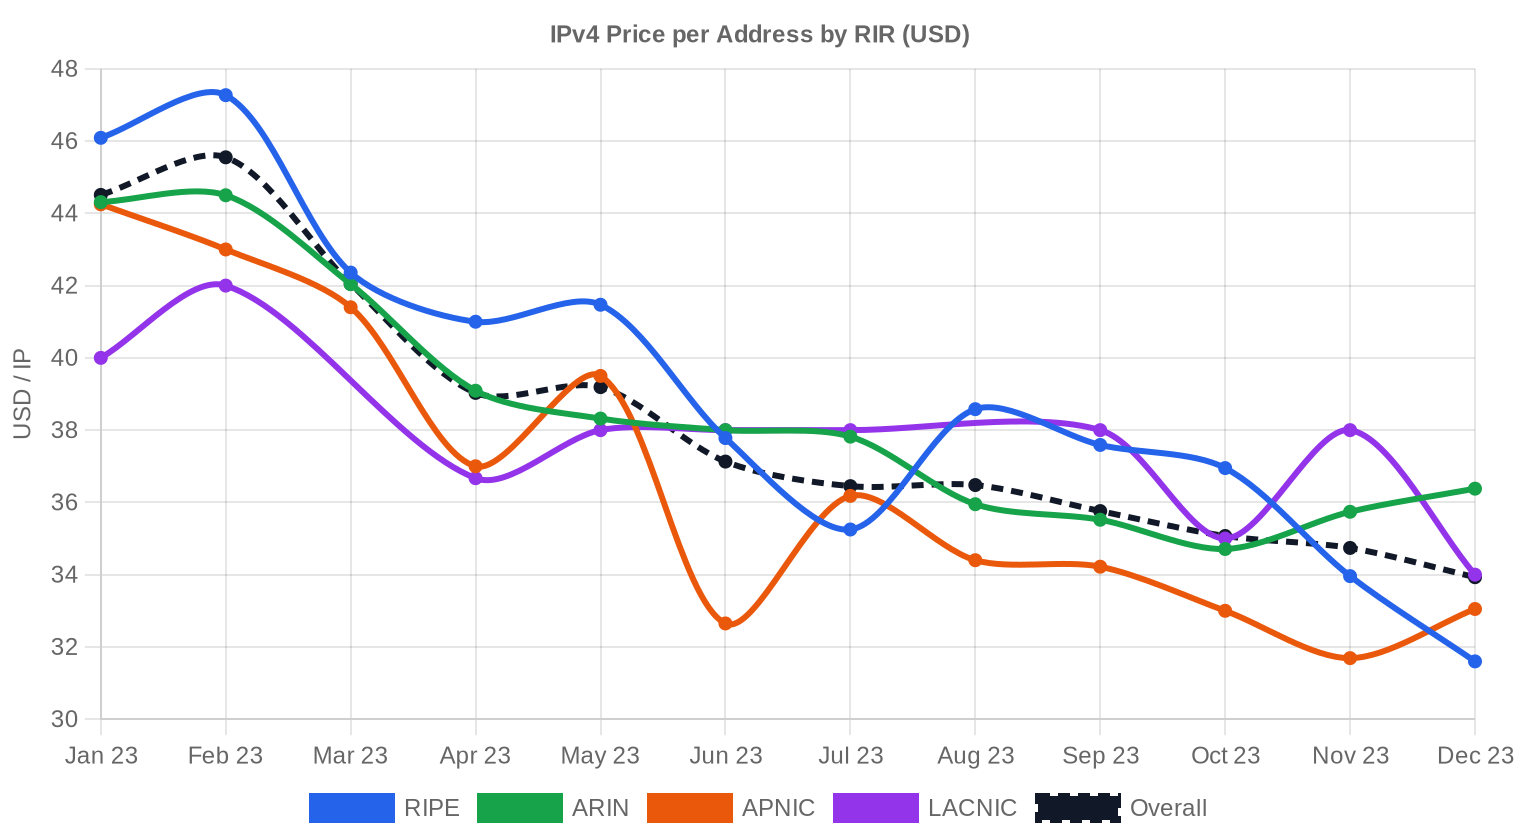
Pricing by RIR
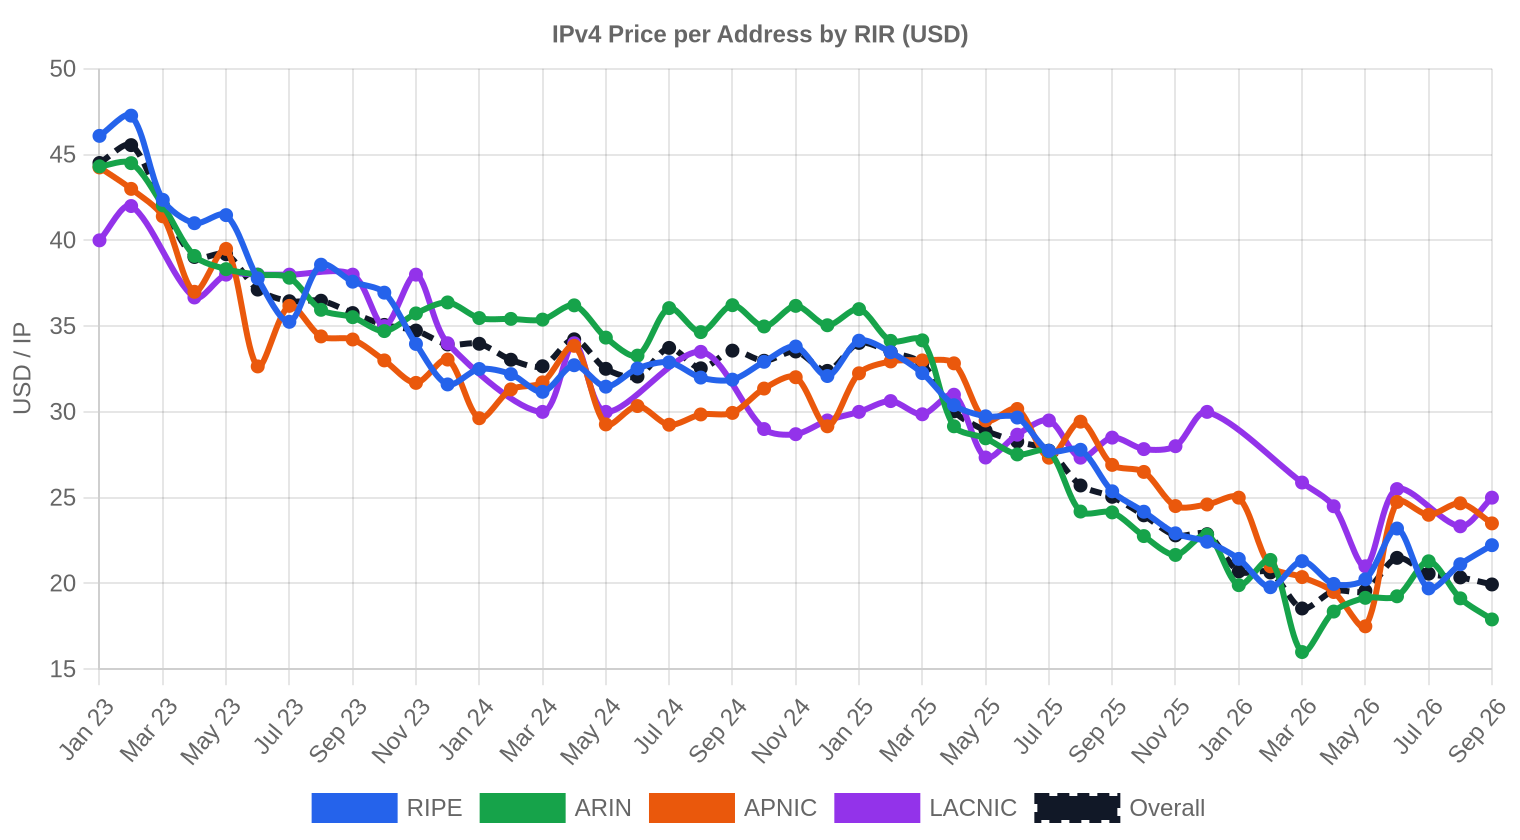
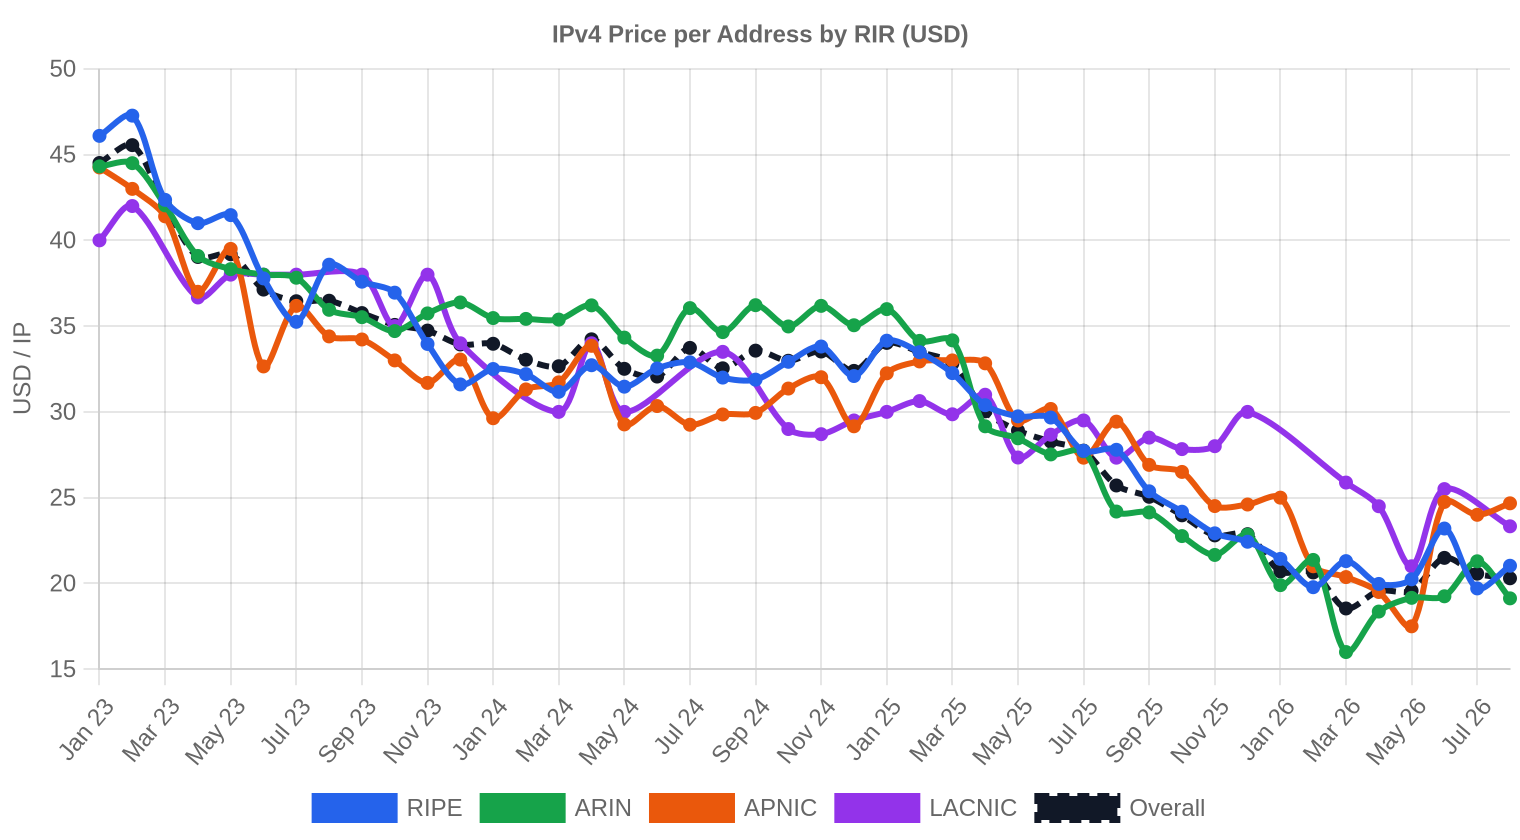
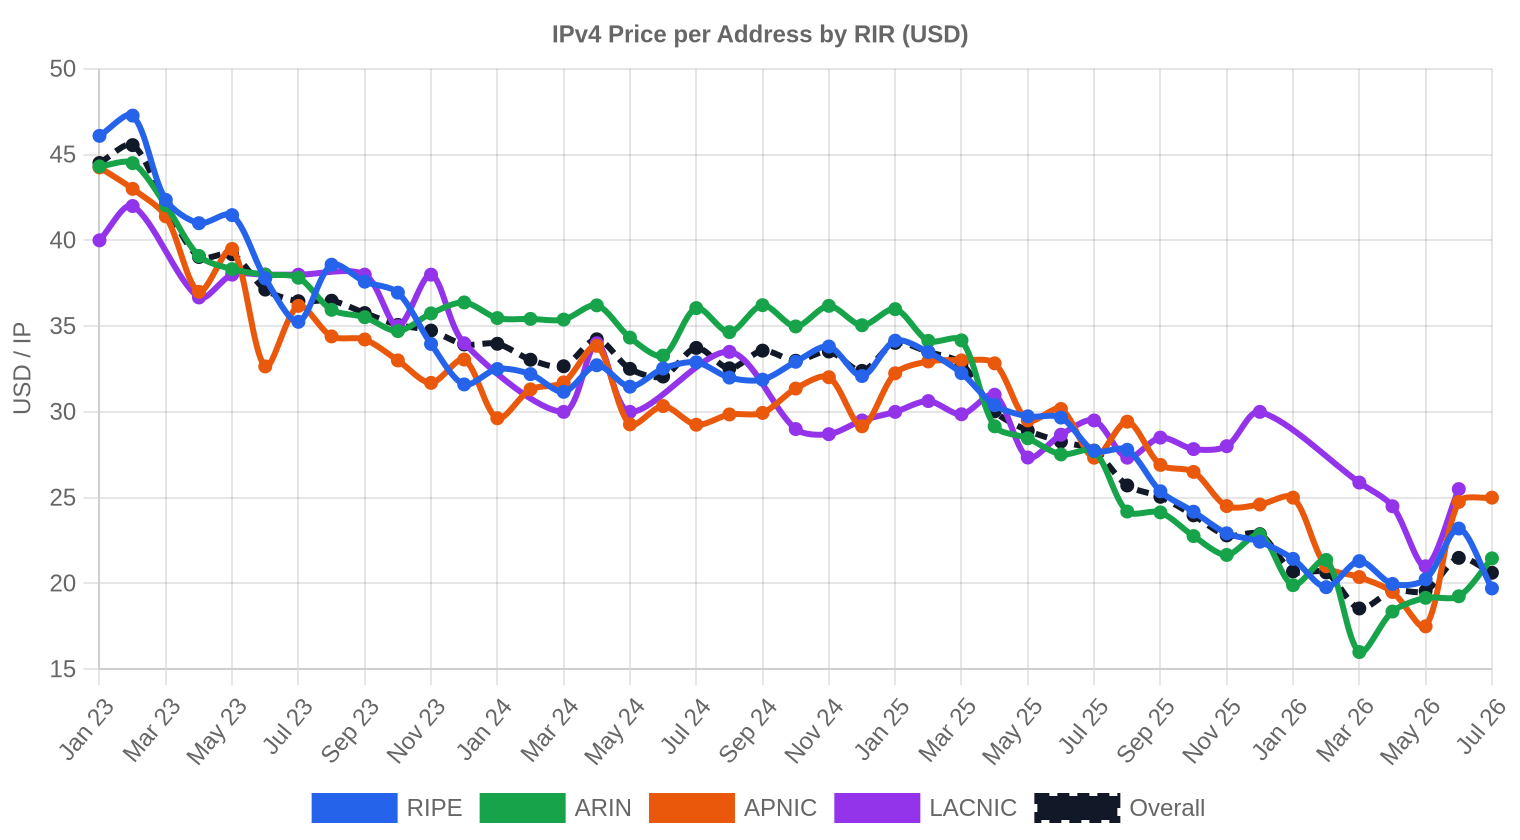
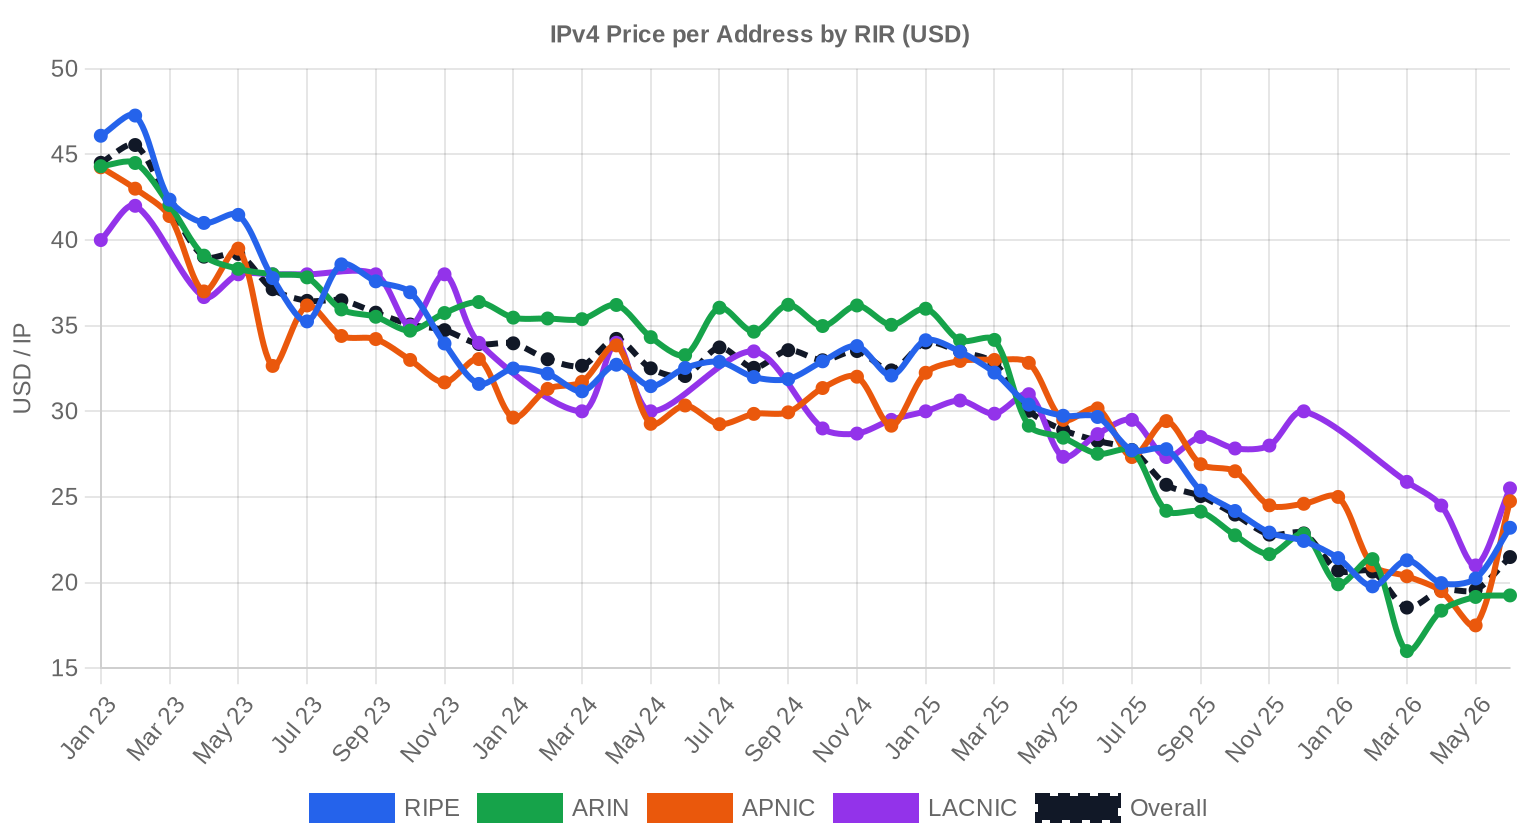
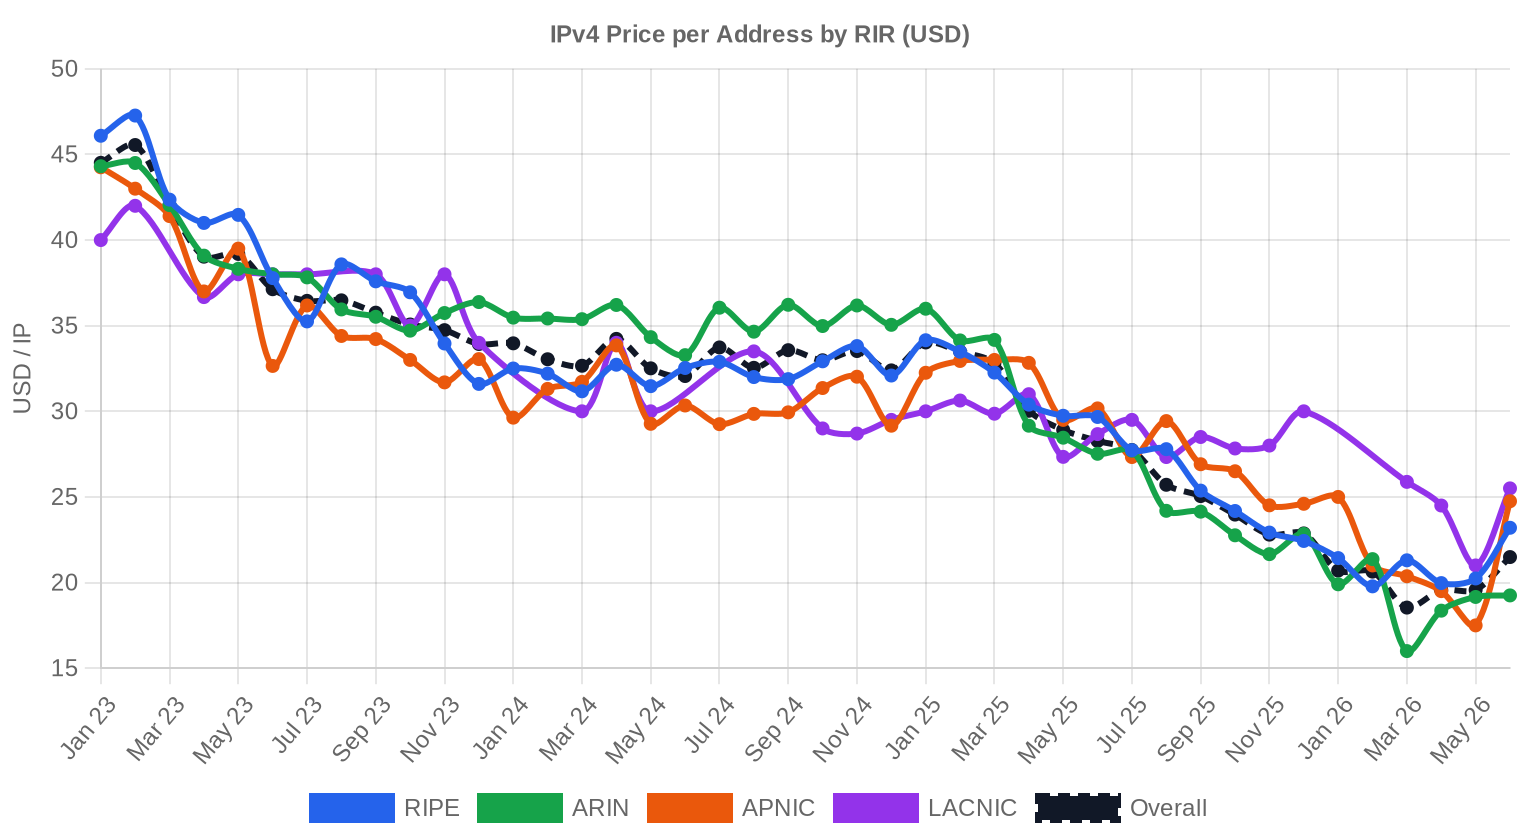
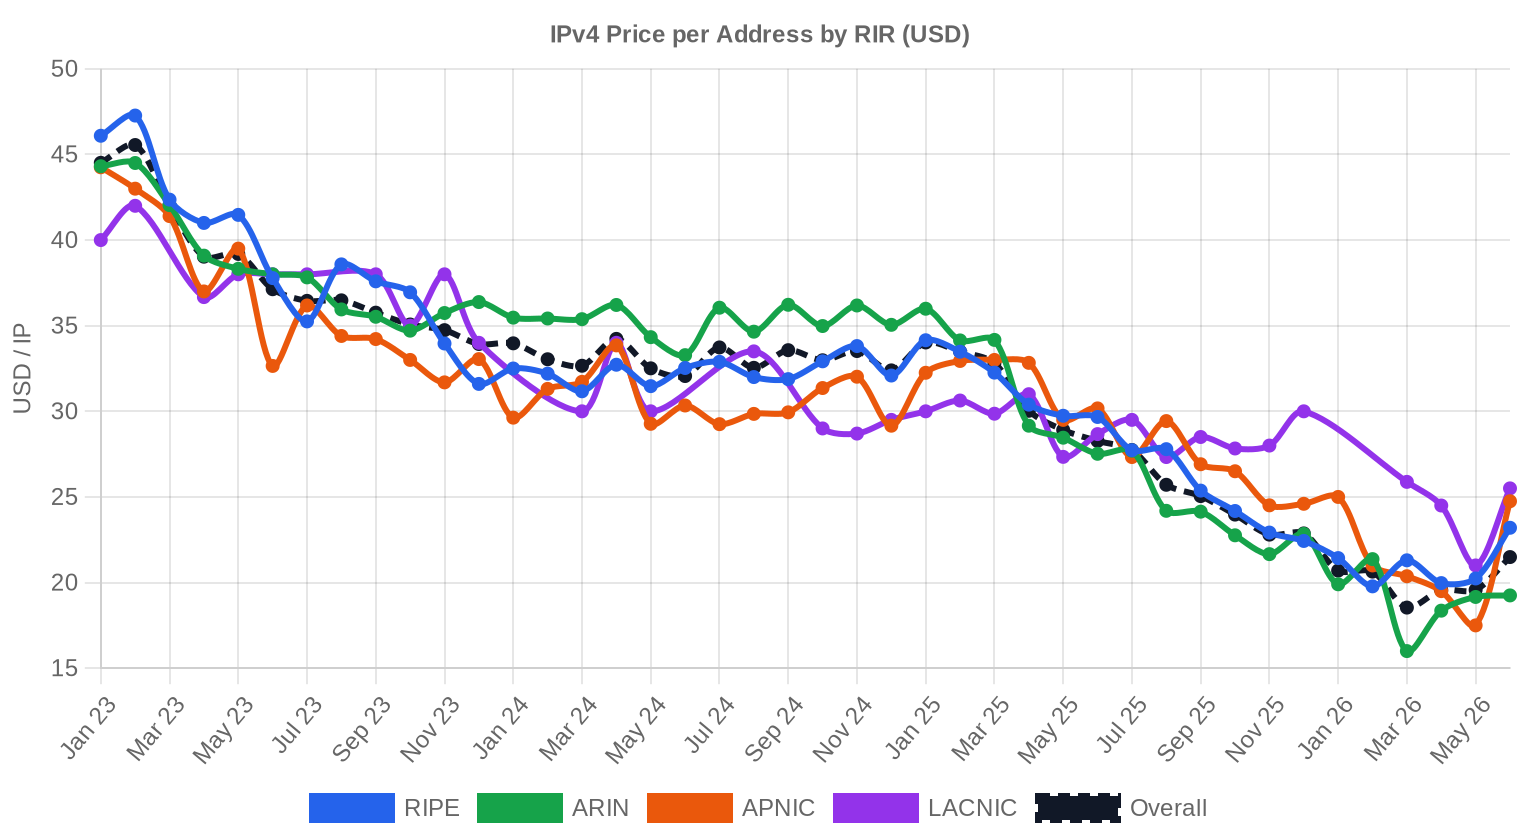
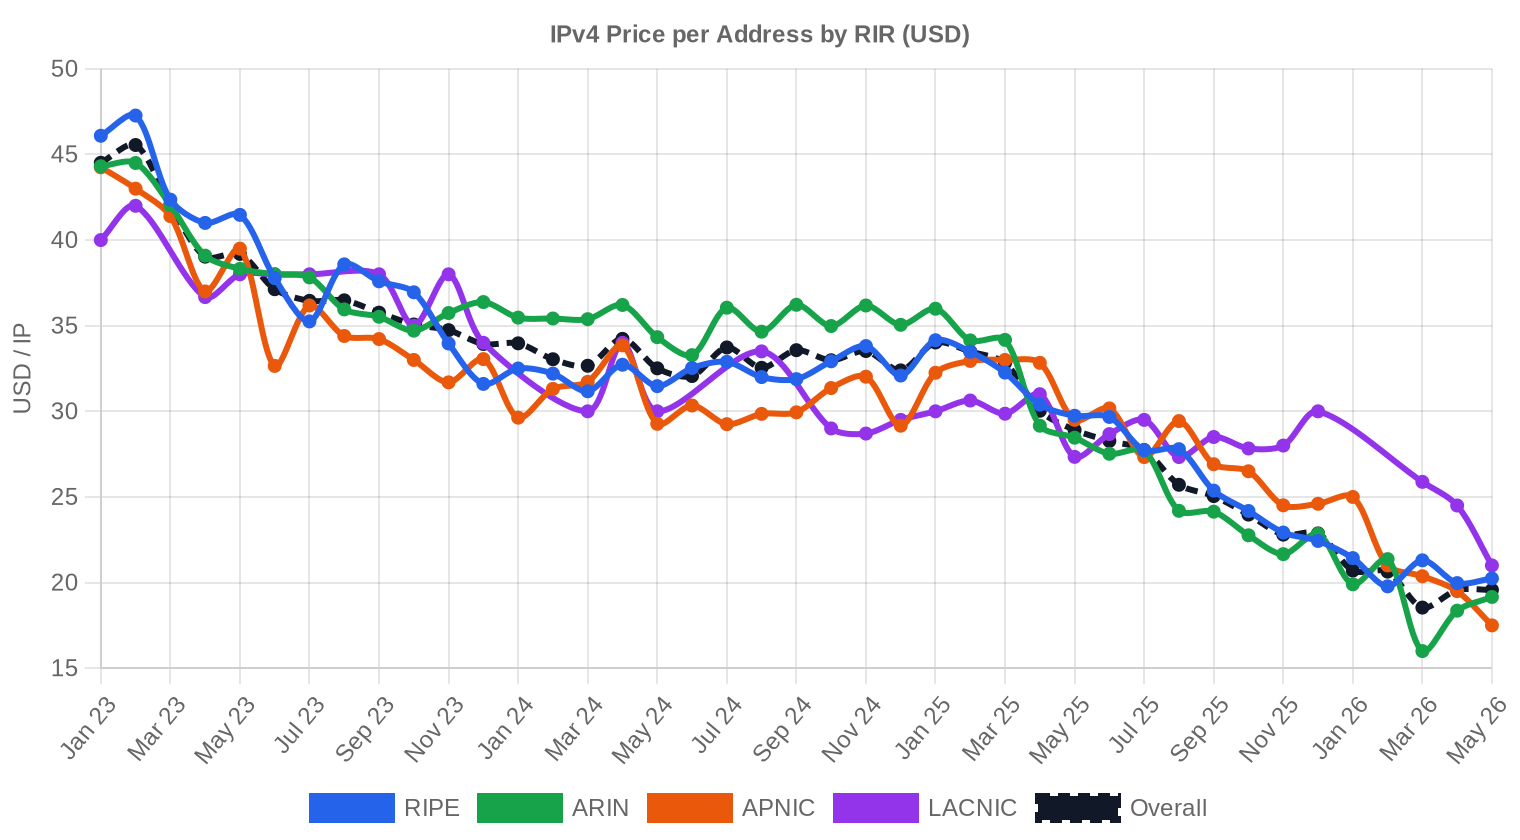
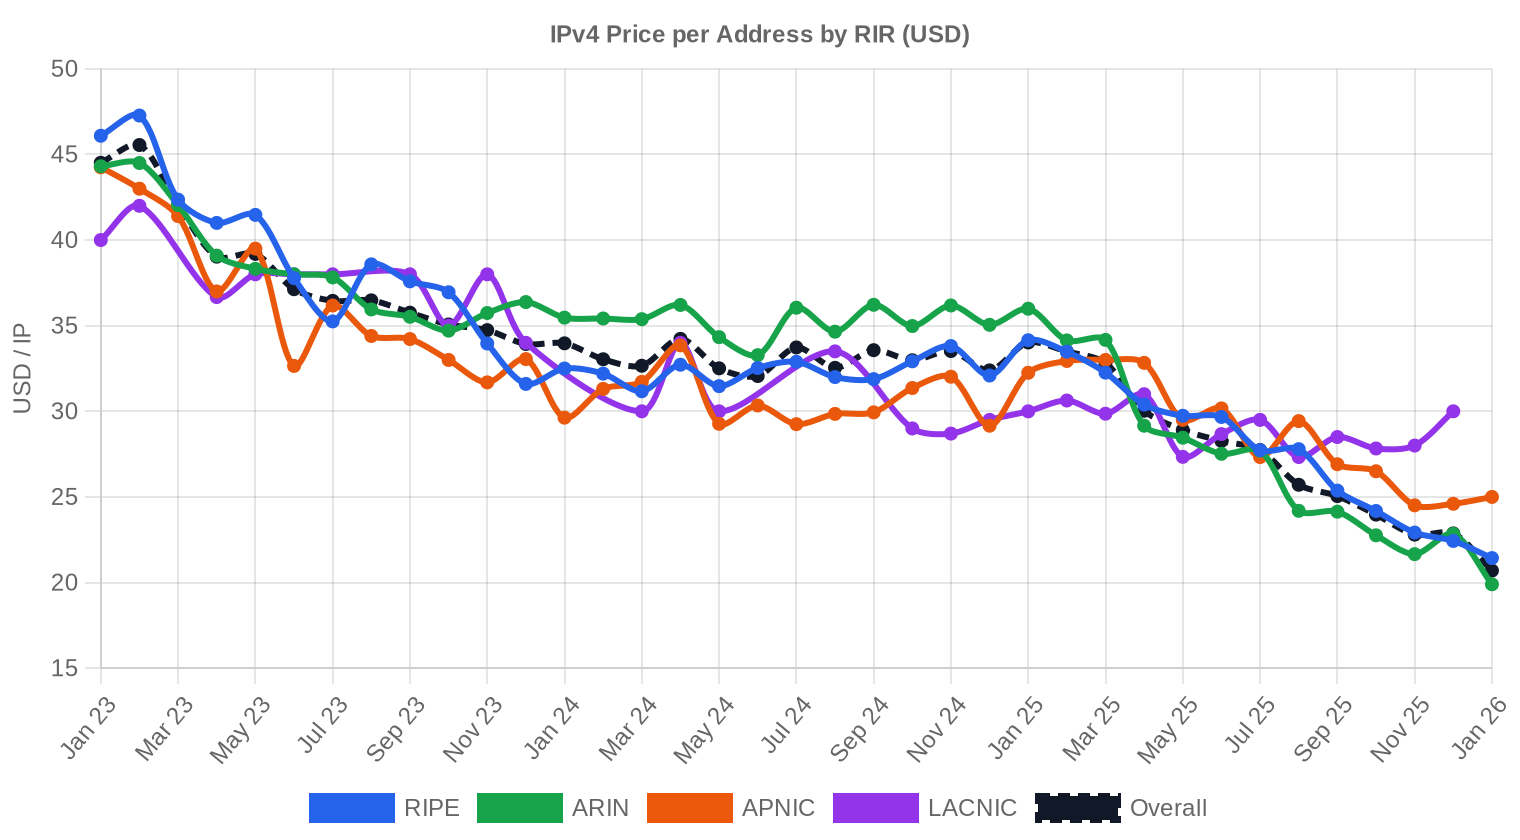
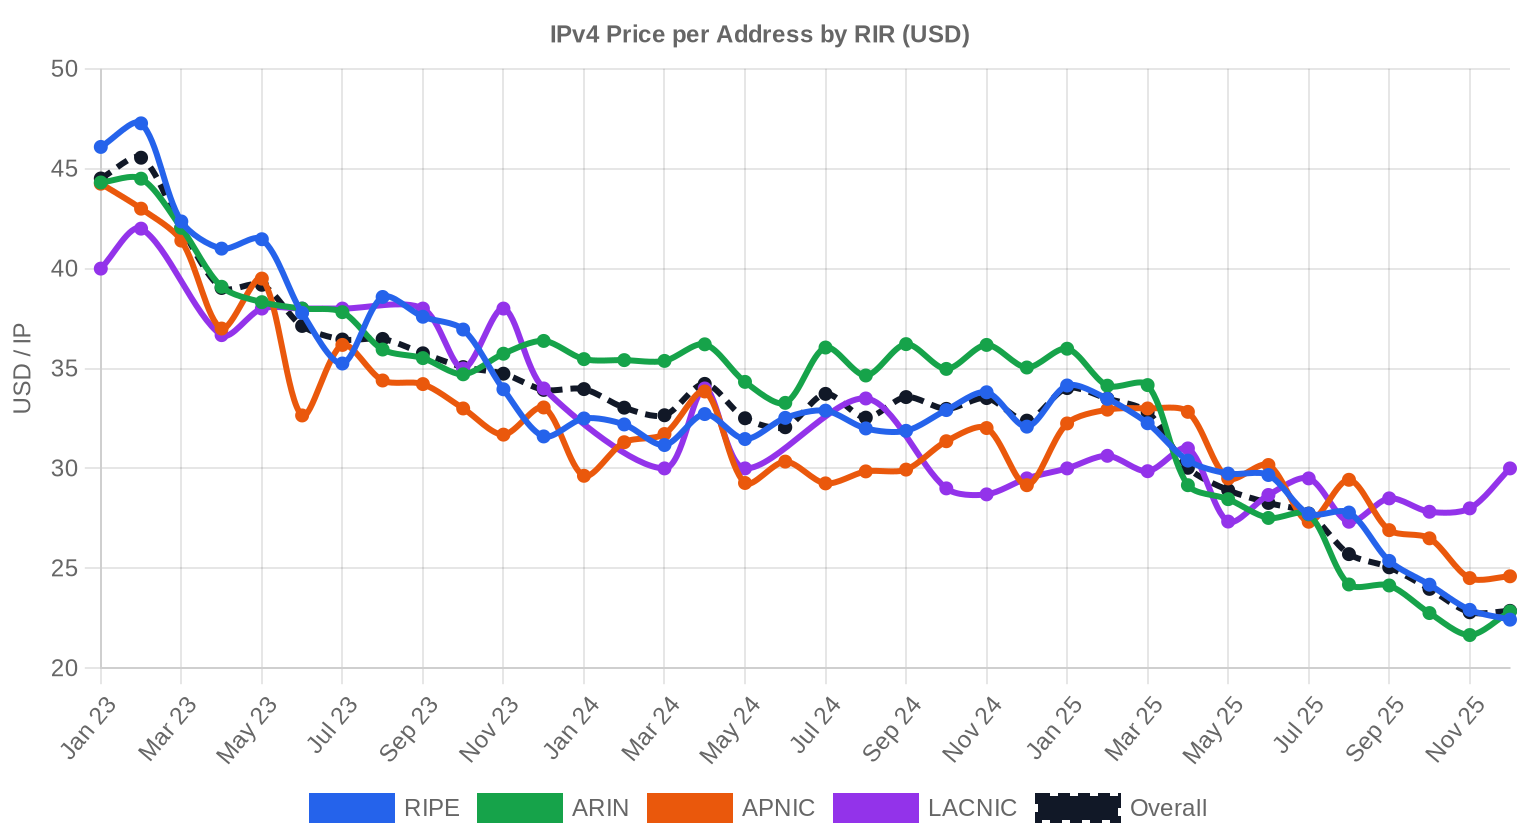
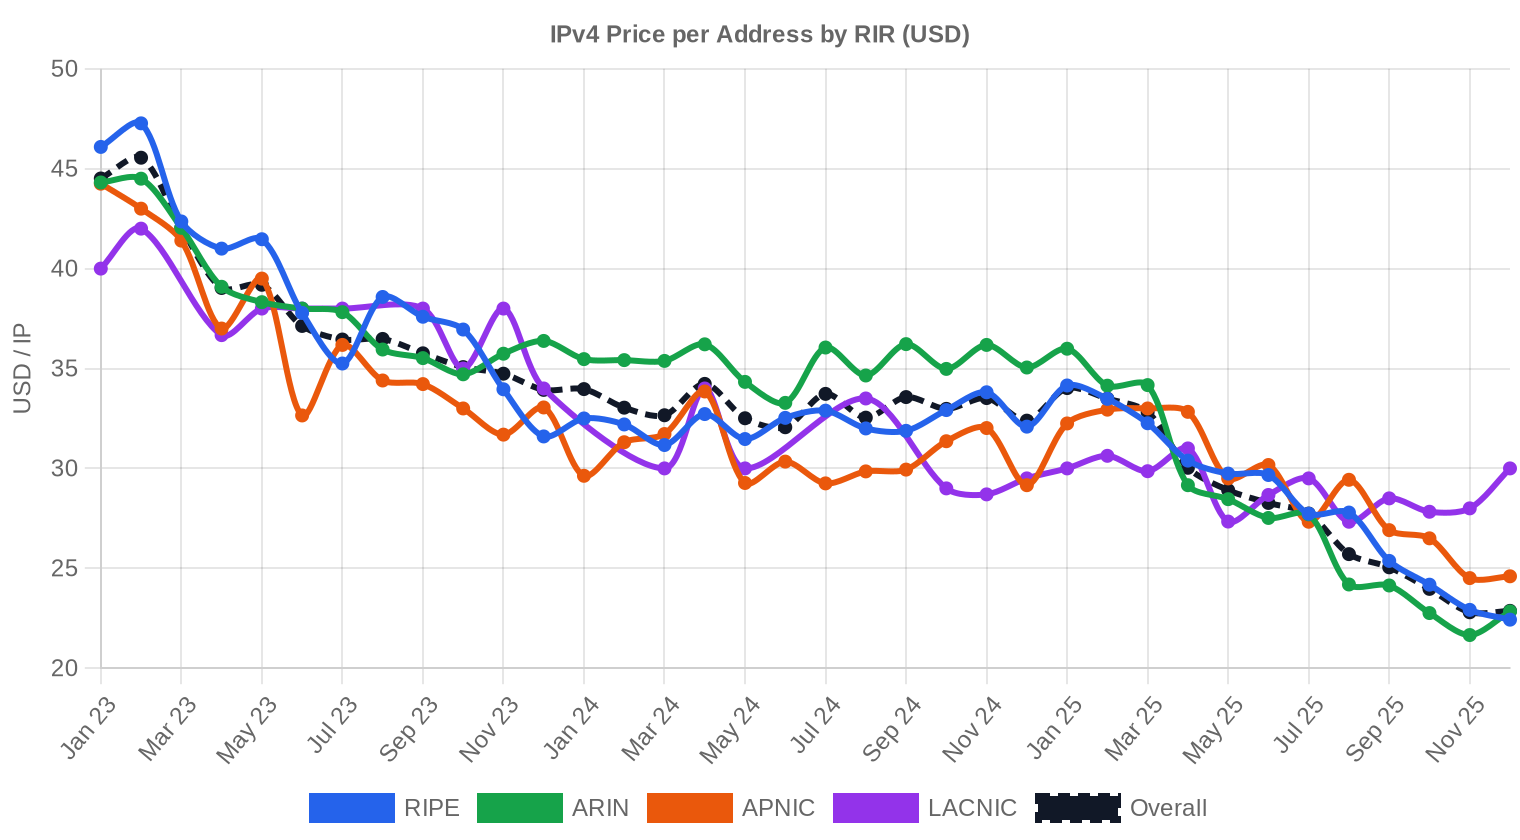
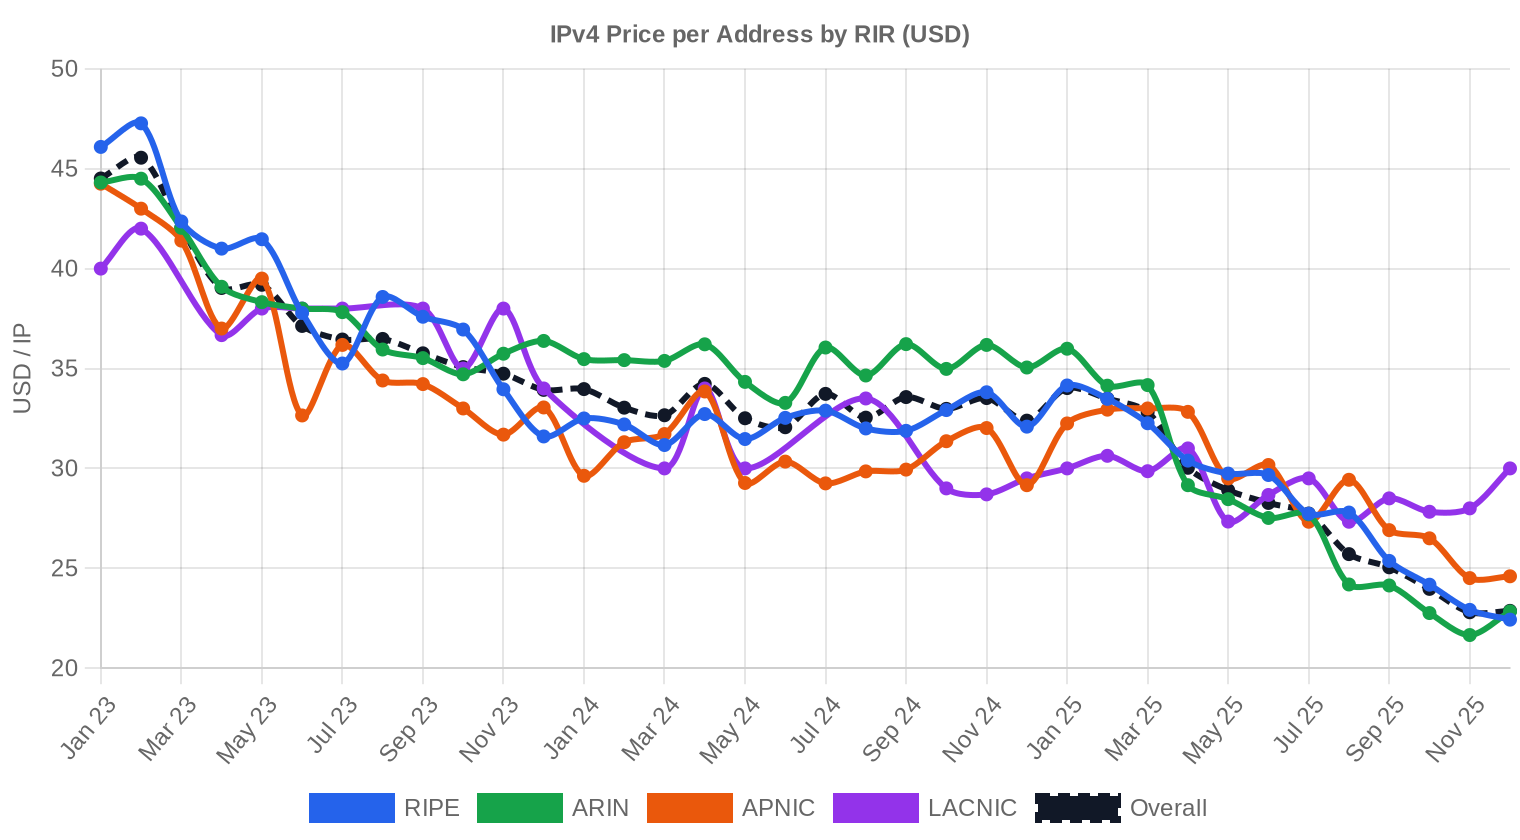
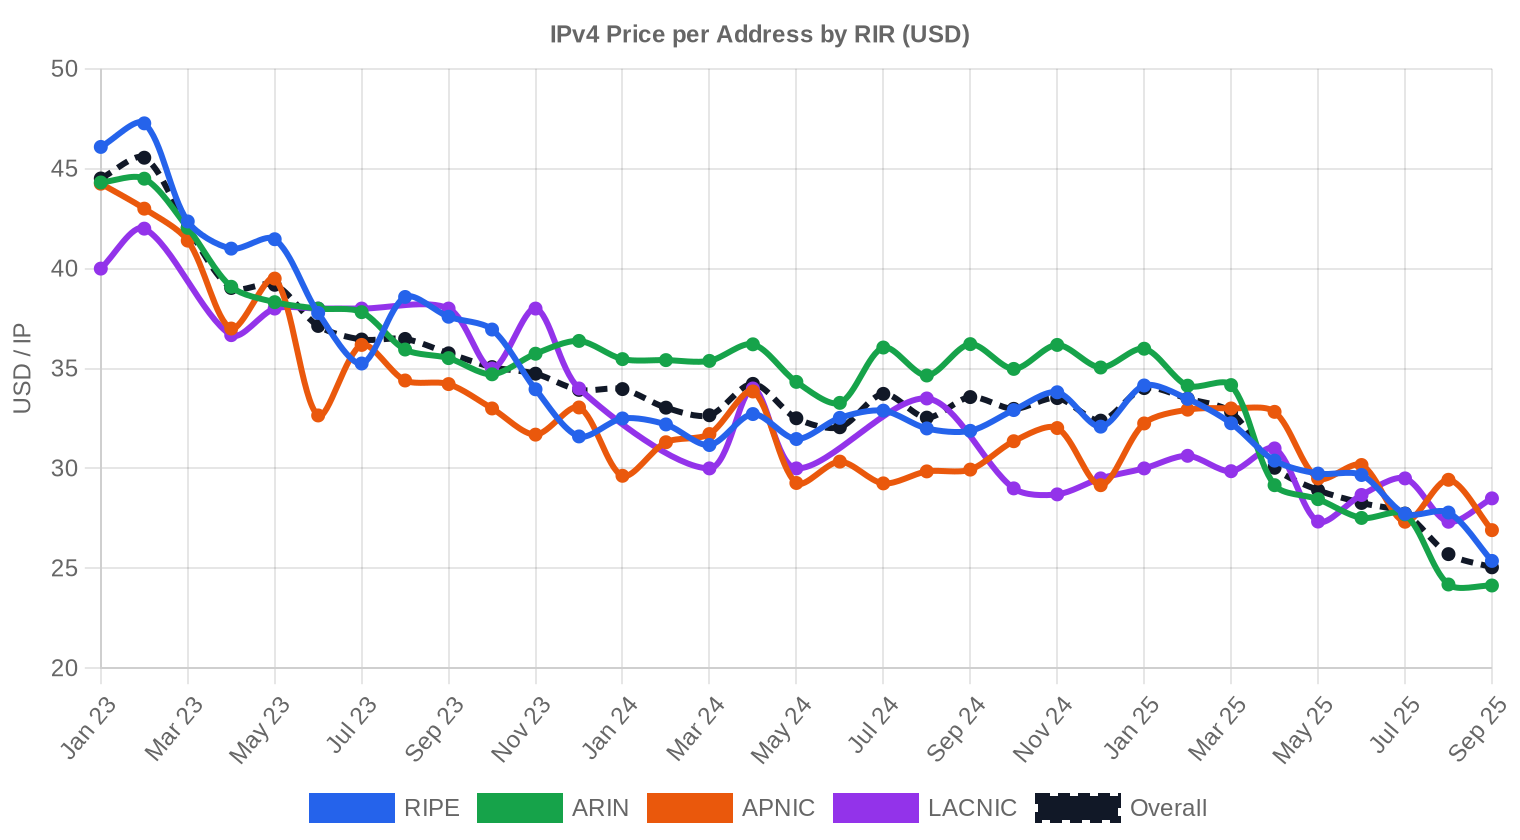
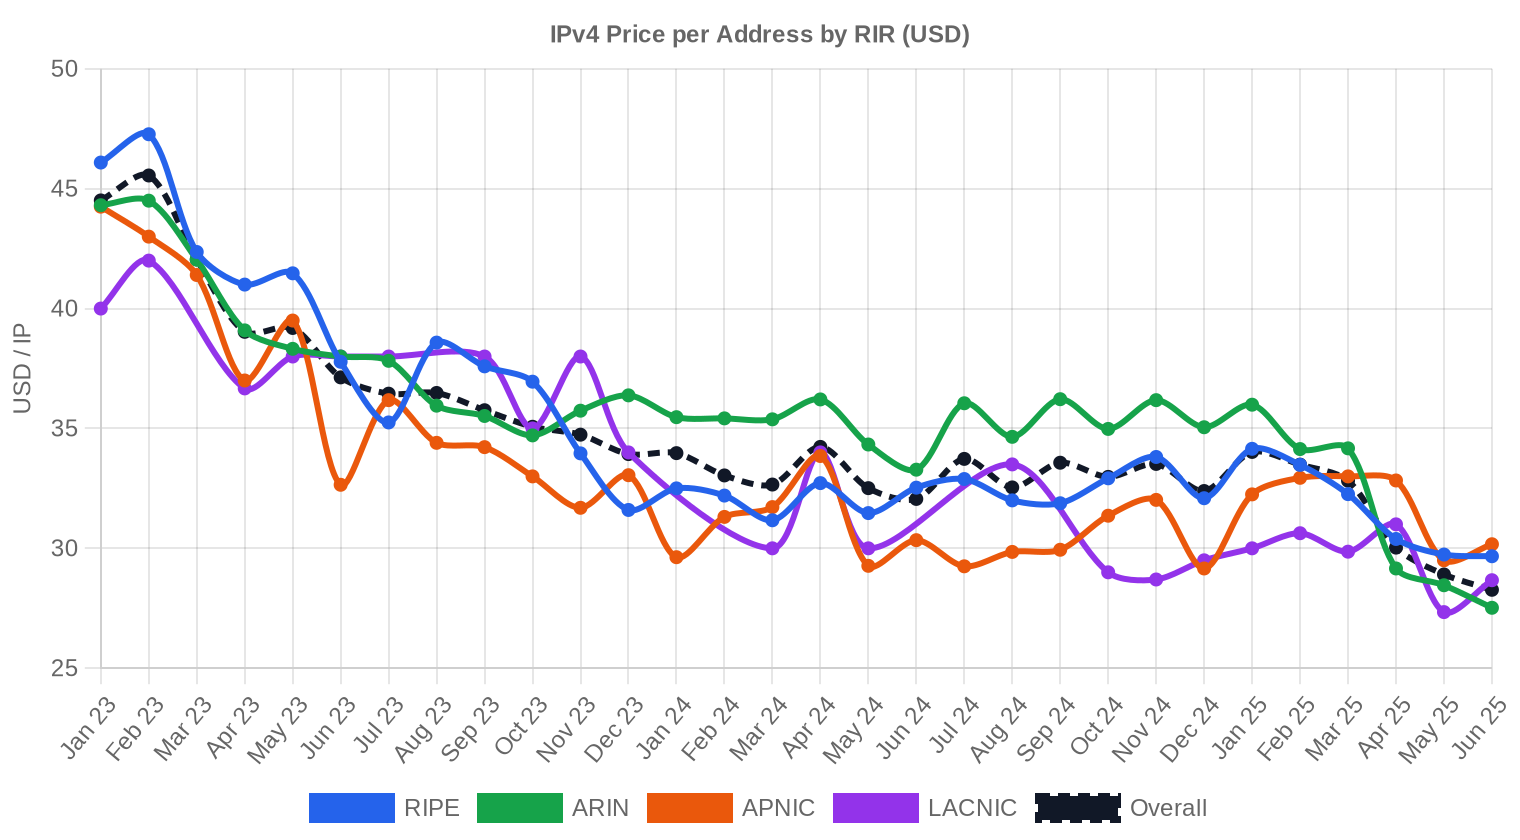
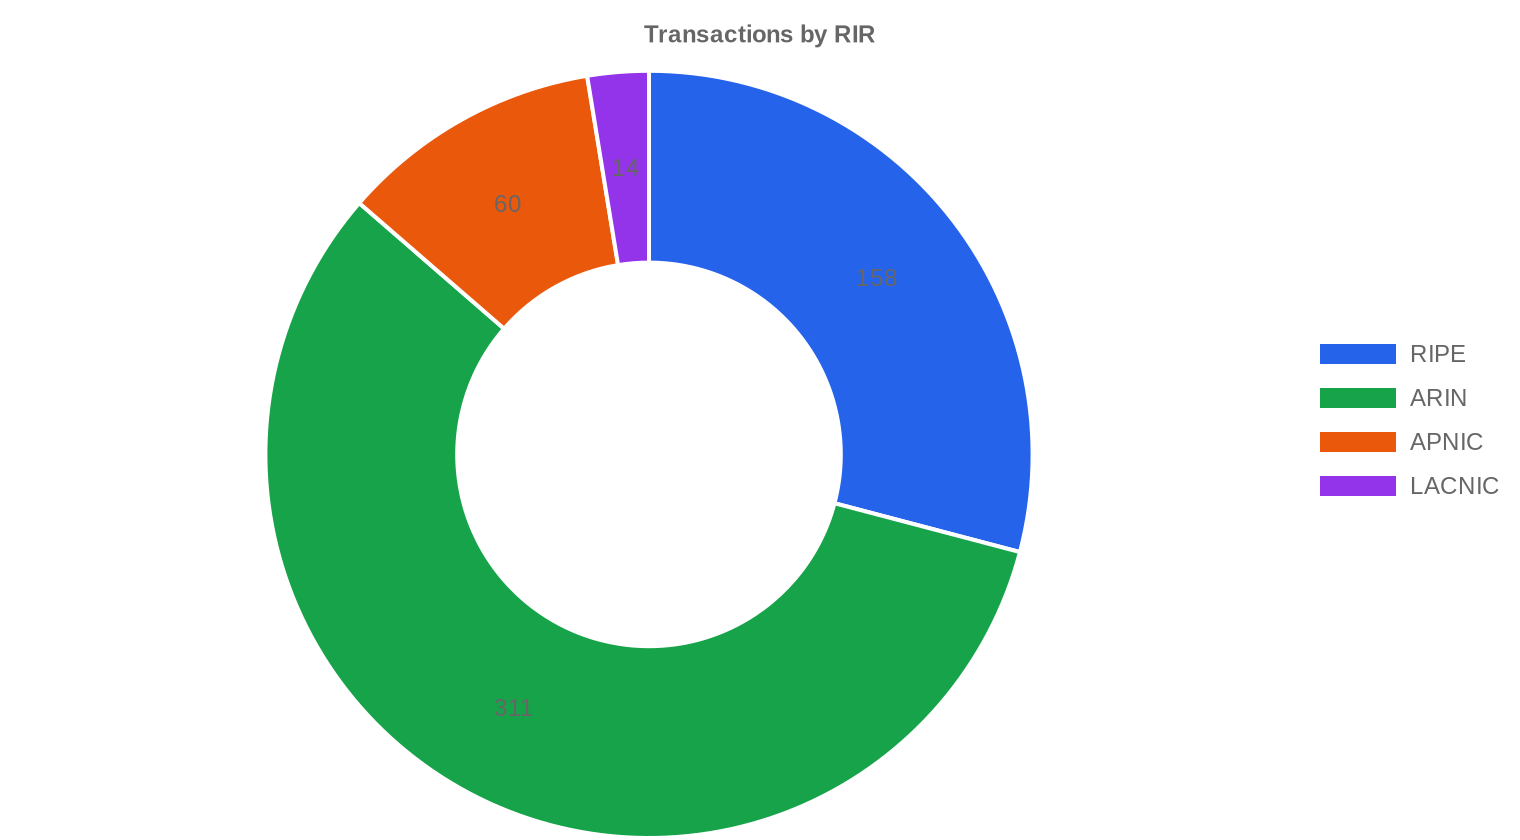
ARIN and RIPE ran nearly neck-and-neck on pricing for the first time, with ARIN averaging $37.94 versus RIPE at $37.83 — an $0.11 gap that's effectively noise. Historically ARIN space commanded a clear premium; that convergence is worth watching. APNIC lagged at $35.96 per IP, reflecting both smaller deal sizes and the regional pricing dynamic in Asia-Pacific. LACNIC, with only 14 transactions, printed $37.79 — surprisingly close to the North Atlantic markets, though the thin sample limits how much weight you can put on that number. AFRINIC recorded zero transactions, a continuation of the governance-driven paralysis in that registry.ARIN: $37.94/IP across 311 transactions (57.3% of volume). Median $38. Range $30–$53.
RIPE: $37.83/IP across 158 transactions (42.7% of IPs traded). Median $37. Range $28–$52.50.
APNIC: $35.96/IP across 60 transactions. Median $34. Range $30–$50.
LACNIC: $37.79/IP across 14 transactions. Median $38. Range $34–$45.
AFRINIC: No recorded transactions.
| RIR | Transactions | Avg $/IP | Median $/IP | IPs Traded | RIR Transfers | Next Month (proj.) | Year-End (proj.) |
|---|---|---|---|---|---|---|---|
| RIPE | 158 | $37.83 | $37.00 | 710,144 | 5,879 | $31.00 | $30.00 |
| ARIN | 311 | $37.94 | $38.00 | 818,688 | 3,310 | $34.50 | $34.00 |
| APNIC | 60 | $35.96 | $34.00 | 76,544 | 0 | $32.00 | $31.00 |
| LACNIC | 14 | $37.79 | $38.00 | 56,320 | 0 | $33.00 | $32.00 |
Transaction Volume
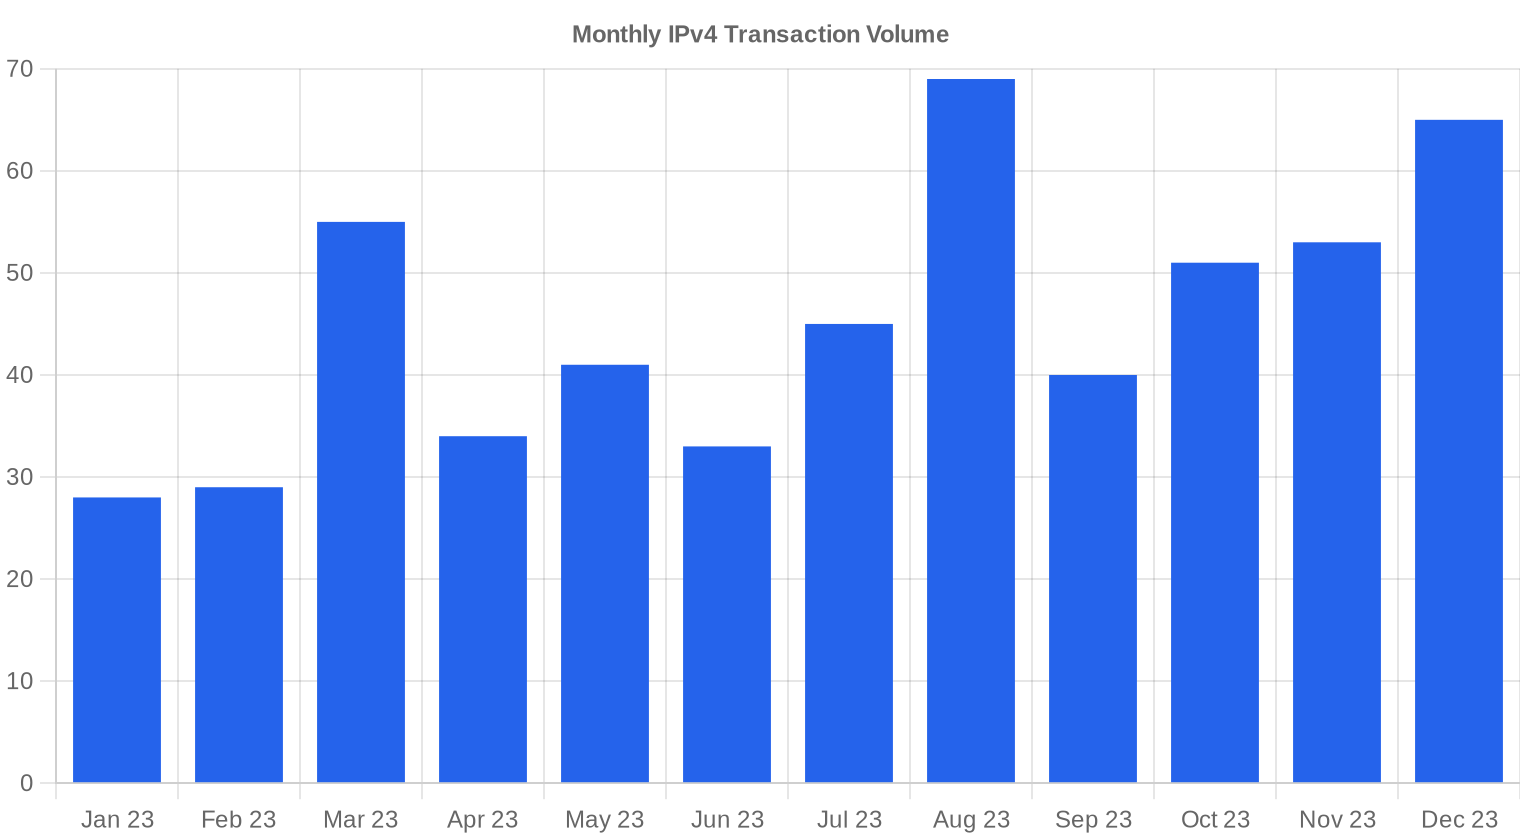
Supply & Block Sizes
The /24 block dominated the market with 229 transactions — 42% of all deals. That's the natural unit of commerce for small ISPs, hosting companies, and enterprises that need a routeable allocation without spending six figures. Larger blocks traded less frequently but accounted for the bulk of dollar volume: the 15 deals over $1 million represented $29.6 million, or 42% of total market value. Supply remains concentrated among legacy holders and companies shedding blocks they no longer need operationally.
Geographic Activity
Country-level distribution data was not reported at sufficient granularity for 2023. Based on RIR splits, the majority of activity clustered in North America (ARIN, 311 deals) and Europe (RIPE, 158 deals), with Asia-Pacific a distant third at 60 transactions. Latin America's 14 deals suggest a market still in early stages of adoption for inter-party transfers.Registry Transfer Activity
Official RIR transfer registries logged 9,189 total transfers across the trailing 12-month window. RIPE dominated with 64% of all transfers (5,879), compared to ARIN's 36% (3,310). The gap between commercial transactions (543) and total recorded transfers is substantial — the difference captures intra-organization movements, subsidiary transfers, and re-registrations that don't involve a market sale.Long-Run Transfer Trends
October 2023 marked the peak month for transfer activity, consistent with the pattern of Q4 budget deployment and year-end housekeeping we've seen in prior years. The 9,189 total transfers across 12 months represent a healthy pipeline, though the commercial slice — 543 priced deals — suggests that most transfers remain non-market in nature. RIPE's outsized share of raw transfers relative to its share of commercial deals (64% vs. 29% of deal count) likely reflects intra-EU consolidation and the mechanics of LIR-to-LIR movements under RIPE policy.| RIR | RIR Transfers |
|---|---|
| RIPE | 5,879 |
| ARIN | 3,310 |
| RIR Transfers | 9,189 |

Outlook & Forecast
Forecasting each block-size band and RIR separately with our AI model:
The overall average price per IP is projected to reach $32.87 by December 2024, with a next-month estimate of $33.43 per IP.
2023 year-end expectation: $34.00 · 2024 year-end expectation: $32.87 per IP.
- RIPE: projected at $31.00 per IP next month, trending toward $30.00 by December 2024.
- ARIN: projected at $34.50 per IP next month, trending toward $34.00 by December 2024.
- APNIC: projected at $32.00 per IP next month, trending toward $31.00 by December 2024.
- LACNIC: projected at $33.00 per IP next month, trending toward $32.00 by December 2024.
- AFRINIC: insufficient data for a reliable forecast.

Forecast by Block Size
| Block | Current $/IP | Next Month | Year-End | Confidence |
|---|---|---|---|---|
| /24 | $34.00 | $34.00 (0.0%) | $33.00 (-2.9%) | medium |
| /23 | $32.50 | $32.00 (-1.5%) | $31.00 (-4.6%) | medium |
| /22 | $33.00 | $33.00 (0.0%) | $33.00 (0.0%) | medium |
| /21 | $33.25 | $33.00 (-0.8%) | $32.00 (-3.8%) | low |
| /20 | $32.50 | $32.00 (-1.5%) | $33.00 (+1.5%) | medium |
| /19 | $34.50 | $34.00 (-1.4%) | $34.00 (-1.4%) | low |
| /18-/16 | $37.50 | $37.00 (-1.3%) | $38.00 (+1.3%) | low |
| /15-up | $51.50 | $50.00 (-2.9%) | $52.00 (+1.0%) | low |
Editor's Take: Buy vs. Lease
The buy-versus-lease math tilted decisively toward buying in 2023. At $37.68 per IP and a RIPE lease rate of $0.59/month, the breakeven sits at 64.3 months — just under 5.4 years. That's a reasonable payback period for any organization with a planning horizon beyond five years, and the implied annual yield of 18.7% makes ownership attractive from a capital allocation perspective. With prices expected to soften toward $32.87 through 2024, prospective buyers face the classic timing question: lock in today's price or wait for a better entry point. Our view is that the 12.8% projected decline is modest enough that organizations with immediate deployment needs should buy now rather than speculate on timing. Leasing makes sense for short-term projects, lab environments, or companies testing market entry — but the math says ownership wins over any multi-year hold.| /24 Purchase price | $9,646 |
| /24 Lease price | $150 / mo |
| Payback period | 64.3 mo (5.4 yr) |
| Gross annual yield | 18.7% |

What This Means for You
Buyers: The market is tilting your way for the first time in years. Average prices are down, and the forecast suggests further softening into 2024. If you've been waiting for better entry pricing on /24 or /23 blocks, the window is opening. Don't expect a crash — this is a grind, not a collapse — but negotiating leverage has shifted.Sellers: The days of automatic annual appreciation are behind us. If you're sitting on blocks you don't need operationally, 2023 pricing still represents strong value relative to historical norms. Holding for higher prices carries increasing risk as the forecast points to $32.87 by end of 2024.
Leasers: At $0.59/month per IP, leasing remains expensive relative to ownership for long-duration needs. The breakeven is 64 months. If your requirement is under three years, leasing avoids capital commitment and depreciation risk. Beyond that, buying is the better play.
Block Holders: The 18.7% implied annual yield from leasing makes your assets competitive with most alternative investments. If selling doesn't fit your strategy, a structured lease program converts dormant blocks into recurring revenue without giving up long-term optionality.
Browse verified IPv4 blocksSell IPv4 →
List your blocks with managed transferLease IPv4 →
Flexible short-term capacityLease Out IPv4 →
Turn idle blocks into recurring revenue
IPv4 Pricing by Block Size
The /24 block — 256 IPs — remains the bread-and-butter unit of the market, accounting for 229 of 543 transactions. Per-IP premiums on /24s run well above the market average due to fixed transaction costs and the scarcity premium small routeable blocks command. At the other end, /16 blocks and larger trade at meaningful per-IP discounts, but total dollar values can exceed $1 million, limiting the buyer pool. The 15 deals above $1M averaged roughly $1.98 million each, suggesting most large-block trades landed in the /16 to /15 range.| Block | IPs | Buy: /IP | Buy: Total | Lease: /IP/mo | Lease: Monthly |
|---|---|---|---|---|---|
| /24 | 256 | $35–45 | $8,960–11,520 | $0.38–0.50 | $97–128 |
| /22 | 1,024 | $28–38 | $28,672–38,912 | $0.33–0.45 | $338–461 |
| /20 | 4,096 | $22–32 | $90,112–131,072 | $0.30–0.40 | $1,229–1,638 |
| /18 | 16,384 | $20–30 | $327,680–491,520 | $0.30–0.38 | $4,915–6,226 |
| /16 | 65,536 | $18–28 | $1,179,648–1,835,008 | $0.30–0.35 | $19,661–22,938 |
IPv4 Price History: 2011–2026
IPv4 addresses traded near zero when IANA exhausted its free pool in 2011. Prices climbed steadily through the 2010s, accelerating after 2015 as cloud adoption drove demand past $20/IP and eventually through $30 in 2019-2020. The market peaked in the low $50s for premium blocks during 2021-2022, fueled by pandemic-era infrastructure spending. AWS's February 2024 decision to charge $0.005/hour for public IPv4 addresses injected a new variable — enterprise users suddenly had a financial reason to return or sell unused space, and the resulting supply loosened the market's upward trajectory.| Year | ~Price/IP | Key Event |
|---|---|---|
| 2011 | $7–12 | IANA free pool exhausted; Microsoft/Nortel deal ($11.25/IP) |
| 2012 | $8–12 | RIPE NCC reaches last /8; begins /22-only allocation |
| 2014 | $10–15 | LACNIC free pool exhausted |
| 2015 | $8–15 | ARIN free pool exhausted |
| 2017–18 | $12–18 | Leasing market grows; cloud demand rises |
| 2019 | $18–24 | RIPE NCC exhausts remaining free pool |
| 2021–22 | $50–60+ | Post-pandemic peak; hyperscaler build-outs |
| 2024 | $35–52 | AWS IPv4 charge ($0.005/IP/hr); large block correction |
| 2025–26 | $18–45 | Market bifurcation; /16s below $20 for first time since 2019 |
Market Structure: Who Is Buying & Selling
The buy side is dominated by cloud infrastructure providers, mid-tier ISPs expanding footprint, and hosting companies that need routeable space for customer deployments. Enterprise buyers — companies needing addresses for VPN, IoT, or hybrid cloud architectures — represent a growing but still secondary segment. Sellers remain predominantly legacy holders (universities, government agencies, early corporate allocators) and companies emerging from M&A or bankruptcy with surplus allocations they can monetize.IPv4 vs. Other Asset Classes
At an implied yield of 18.7% annually from leasing, IPv4 addresses outperformed nearly every conventional asset class in 2023. Investment-grade bonds returned 5-6%, the S&P 500 delivered roughly 26% on a mark-to-market basis, and commercial real estate cap rates hovered around 6-8%. The IPv4 yield comes with a caveat: it assumes consistent lease utilization and no price depreciation on the underlying asset — a risk that's real given our $32.87 year-end 2024 forecast. Still, for yield-seeking capital, IPv4 blocks remain a compelling niche allocation.| Asset Class | Typical Yield | Liquidity | Primary Risk |
|---|---|---|---|
| IPv4 | 18.7% | Moderate | IPv6 adoption, block quality |
| Commercial Real Estate | 5–8% | Low | Vacancy, rate cycle |
| Investment-Grade Bonds | 4–5% | High | Duration, credit risk |
| S&P 500 | ~1,3% | High | Market volatility |
| Money Market / T-Bills | ~4–5% | High | Rate cycle changes |
IPv6 Adoption & Why IPv4 Remains Essential
IPv6 adoption continues to grow at the edges — Google reports over 40% of traffic arriving via IPv6 — but the enterprise core remains stubbornly IPv4-dependent. Legacy applications, firewall configurations, and vendor ecosystem support all anchor the installed base to IPv4 for the foreseeable future. The coexistence period is measured in decades, not years, and every new network deployment that requires backward compatibility extends the economic life of IPv4 address blocks.AI & Cloud Infrastructure Demand
The buildout of AI training clusters and inference infrastructure is creating net-new demand for IPv4 addresses, particularly from hyperscalers and GPU cloud providers standing up new data center capacity. Each cluster requires management networks, API endpoints, and customer-facing infrastructure that consumes routeable IPv4 space. While the per-cluster address requirement is modest compared to a major ISP, the pace of deployment — dozens of new AI-focused facilities announced in 2023 alone — adds meaningful incremental demand to a supply-constrained market.What Determines IPv4 Block Value
Block valuation depends on several concrete factors: blacklist cleanliness (a block appearing on Spamhaus or similar feeds trades at a 10-20% discount), allocation vintage (older blocks with clean history command premiums), RIR registry (ARIN and RIPE space is most liquid), and whether the block can be transferred without policy complications. Blocks with prior spam or abuse history require remediation that can take months, and buyers increasingly demand escrow-period blacklist verification before closing.Sell vs. Lease: A Decision Framework
In a declining price environment — and -0.28% trend with a $32.87 forecast for 2024 tells you that's where we are — the calculus shifts toward selling sooner rather than later for holders who don't need the addresses. At 18.7% annual yield, leasing remains attractive if you believe prices will stabilize, since you earn income while retaining the asset. The decision hinges on your view of where prices bottom: if $32-33 is the floor, leasing and waiting makes sense; if the decline has further to run, taking $37-38 today looks smart in hindsight.| /24 Purchase price | $9,646 |
| /24 Lease price | $150 / mo |
| Payback period | 64.3 mo (5.4 yr) |
| Gross annual yield | 18.7% |
RIPE NCC 24-Month Transfer Restriction
RIPE NCC's 24-month holding requirement before re-transfer continues to function as a supply brake in the European market. Blocks acquired speculatively or through bulk purchases cannot be flipped for two years, which constrains short-term supply and supports price stability. The rule also discourages pure arbitrage players, keeping the RIPE market more end-user-driven than ARIN, where no comparable holding period exists.Deal Size Distribution
The market was heavily bottom-weighted: 407 of 543 deals (75%) came in under $50,000, totaling $7.6 million. The mid-market — $50K to $250K — accounted for 83 deals and $9.0 million, while the $250K-$1M band captured 38 transactions worth $16.4 million. The top tier — 15 deals above $1 million — represented just 2.8% of transactions but 42.3% of total dollar volume at $29.6 million. This concentration at the top means a handful of large trades can move market-wide averages significantly.Top Trading Countries
Country-level trade data was not available at sufficient resolution for 2023. RIR distribution serves as a proxy: ARIN's 311 transactions point to the U.S. and Canada as the dominant geography, followed by Europe (RIPE, 158 deals) and the Asia-Pacific region (APNIC, 60 deals). Demand patterns suggest that U.S. cloud and hosting providers remain the single largest buyer cohort globally.BEAD Broadband Program Impact
The $42.45 billion BEAD program is beginning to filter into IPv4 demand as grant recipients — primarily regional ISPs and fixed wireless operators — plan network buildouts that require routeable address space. These buyers typically need /22 to /20 blocks, the mid-size range where supply is already thin. As BEAD funding disbursements accelerate through 2024-2025, we expect this program to put measurable upward pressure on blocks in the 1,024-to-4,096 IP range, potentially creating a pricing divergence between small and mid-size allocations.Hyperscaler IPv4 Holdings
Amazon, Microsoft, and Google collectively hold tens of millions of IPv4 addresses — Amazon alone controls an estimated 100+ million. These holdings are effectively locked up; none of the major hyperscalers are net sellers. AWS's decision to charge for public IPv4 usage signals a shift toward monetizing address space indirectly rather than releasing it to the open market. Any change in hyperscaler strategy — say, a major sell-off driven by IPv6 migration — would fundamentally reshape supply dynamics, but we see zero evidence of that happening in 2023 or the near-term forecast period.Macroeconomic Conditions & Market Impact
Central bank tightening through 2023 pushed enterprise IT budgets into rationalization mode, with CIOs scrutinizing every infrastructure expenditure including IPv4 procurement. Higher discount rates make the implicit cost of holding idle address blocks more expensive, which should theoretically shake loose supply from corporate balance sheets. At the same time, reduced venture funding for startups and cloud-native companies dampened one source of buy-side demand that was robust in 2021-2022.Model Update & Calibration
As part of our continuous improvement process, we backtested previous forecasts against realised prices and fine-tuned the model accordingly. Recent months now carry more influence than older data, and the confidence bands have been widened or narrowed based on how well they captured actual outcomes in the past. You can see the full backtest results in the table and chart below.
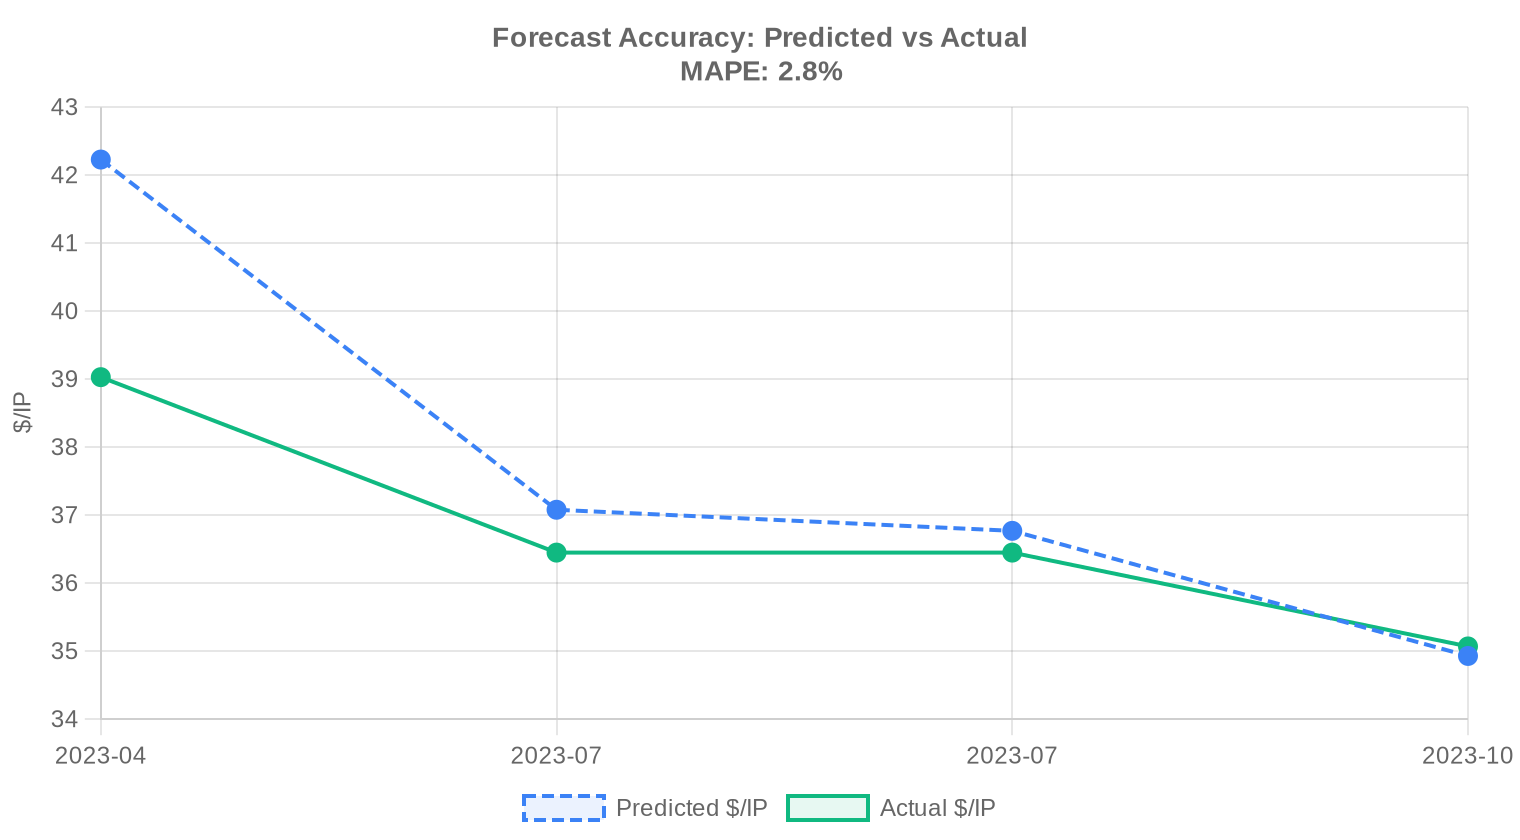
| Report Period | Target Month | Predicted | Actual | Deviation |
|---|---|---|---|---|
| 2023-Q1 | 2023-04 | $42 | $39 | +8% |
| 2023-H1 | 2023-07 | $37 | $36 | +2% |
| 2023-Q2 | 2023-07 | $37 | $36 | +1% |
| 2023-Q3 | 2023-10 | $35 | $35 | 0% |
Methodology
Figures are based on completed IPv4Center marketplace transactions and RIR transfer statistics. Prices are in US dollars per IP address. Forecasts are produced by an AI model that analyses each block-size band and RIR segment separately (with outlier-trimmed medians) alongside known market catalysts; they are estimates, not guarantees.
Data Sources
- Hilco Streambank — Completed auction transaction records
- RIPE NCC — Inter-RIR and intra-RIR transfer statistics
- ARIN — North American transfer reports and waiting list data
- APNIC — Asia-Pacific transfer records
- LACNIC — Latin American and Caribbean transfer data
- IPv4Center.com — Proprietary marketplace transaction and lease pricing data
This report is generated automatically for informational purposes only and does not constitute financial advice.
Frequently Asked Questions
What was the average price per IPv4 address in 2023?
The market-wide average landed at .68 per address across 543 recorded transactions, with the median at .50 — an unusually tight spread that signals a mature, well-arbitraged market. The floor was and the ceiling was , a range of roughly 47%.
How much total IPv4 inventory changed hands in 2023?
Approximately 1.66 million addresses moved in priced transactions, generating nearly million in aggregate deal value. The average deal size was roughly 128,856 addresses, suggesting the market remains dominated by institutional-scale block trades.
Which RIR region commanded the highest prices in 2023?
ARIN blocks were the priciest, averaging .94 per IP with a median of .00 and a ceiling of .00. RIPE trailed slightly at .83 average. APNIC blocks were notably cheaper at .96 — roughly a 5% discount to ARIN space, likely reflecting more limited routability requirements in certain APNIC sub-regions.
How did ARIN and RIPE compare in transaction volume?
ARIN dominated priced transactions with 311 deals (57.3% market share) covering 818,688 IPs, while RIPE logged 158 priced deals covering 710,144 IPs. However, RIPE accounted for 64% of all recorded transfers (5,879 of 9,189) — the discrepancy likely reflects RIPE's intra-RIR transfer activity and corporate restructurings that don't always carry a reported price.
Were there any transactions in the AFRINIC region?
Zero. AFRINIC recorded no priced transactions and no transfer activity in 2023. The region's ongoing governance challenges and transfer policy restrictions continue to make it effectively illiquid.
What was the most common block size traded in 2023?
/24 blocks (256 addresses) were the most frequently transacted prefix, accounting for 229 of 543 deals — roughly 42% of all transactions. This is the smallest independently routable block on most networks, making it the retail unit of the IPv4 market.
Is the IPv4 market trending up or down heading into 2024?
Down, modestly. Prices declined approximately 0.28% over the period. Our model projects a year-end 2024 price of .87, implying roughly 12–13% further erosion from the 2023 average. The forecast is flagged as reliable.
What is the near-term price forecast for IPv4 addresses?
The model projects a near-term price of .43 and a December 2024 exit price of .87 per IP. That trajectory implies the market is entering a slow, grinding deflation — not a crash, but enough to erode returns for speculative holders.
Should organizations buy or lease IPv4 addresses at current rates?
Buy, if the holding period exceeds roughly 5.4 years (64 months). At .68 per IP versus .5859 per IP per month in lease costs, the breakeven is about 64 months. At current lease rates, leasing generates an implied 18.7% annual yield for block owners — attractive for sellers, expensive for long-term tenants.
What does a /24 block cost to buy versus lease in 2023?
Buying a /24 runs approximately ,646 at the market average. Leasing the same block costs roughly 0 per month or ,800 annually. If you need the space for more than 5.4 years, the purchase is the rational choice on a pure-cost basis.
How large was the M-plus deal segment of the market?
Fifteen transactions exceeded million in value, yet those 15 deals accounted for nearly .6 million — roughly 42% of total market value. The IPv4 market exhibits classic Pareto dynamics: fewer than 3% of deals drive more than two-fifths of the dollar volume.
What share of deals were small-ticket transactions under K?
A full 75% of deals (407 of 543) were under ,000, but they represented only .6 million in aggregate — about 11% of total market value. This is your /24 and small /23 market: high frequency, low notional, largely retail and SMB buyers.
What mistakes should buyers avoid in the current IPv4 market?
Three common errors: overpaying for APNIC blocks when the regional average is .96 versus .94 in ARIN; locking into long-term leases when the breakeven favors purchase at 64 months; and ignoring the downward price trend — the 2024 forecast suggests further erosion, so urgency premiums are rarely justified.
What are the risks of holding IPv4 blocks as a speculative investment?
With prices trending down 0.28% in 2023 and the model projecting .87 by year-end 2024, the capital appreciation thesis is effectively dead. Holding costs (WHOIS maintenance, annual RIR fees, abuse management) further erode returns. The remaining play is yield — leasing at 18.7% annualized — but that depends on sustained lease demand.
What risks does IPv6 adoption pose to IPv4 valuations?
IPv6 remains the long-tail risk. Every major cloud provider and mobile carrier now runs dual-stack or IPv6-preferred architectures. The 2024 price forecast of .87 already reflects gradual demand erosion. A sudden enterprise migration catalyst — regulatory mandate, major outage, or hyperscaler policy change — could accelerate the decline.
Why is the LACNIC region so thinly traded?
Only 14 priced transactions were recorded in LACNIC during 2023, covering 56,320 addresses worth roughly .1 million. The region's restrictive transfer policies, smaller installed base, and lower enterprise density keep it peripheral. Pricing, however, was competitive: .79 average, essentially at parity with ARIN and RIPE.
How many total transfers (including non-priced) occurred in 2023?
A total of 9,189 transfers were recorded across all RIRs, of which only 543 carried a disclosed price. RIPE dominated total transfer activity at 64% share (5,879 transfers), while ARIN accounted for 36% (3,310). The gap between total transfers and priced transactions reflects intra-company reorganizations, mergers, and transfers without public price discovery.
Which month saw the most transfer activity in 2023?
October 2023 was the peak month for transfer volumes. Year-end budget cycles and Q4 infrastructure provisioning typically drive a seasonal bulge in activity, and 2023 was no exception.
What is the current monthly lease rate for IPv4 addresses?
Based on a sample of 44 lease transactions, the market rate is approximately .59 per IP per month, or about 0 per month for a /24 block. Available data is concentrated in the RIPE region; ARIN, APNIC, and LACNIC lease pricing remains opaque.
What yield can IPv4 block owners expect from leasing?
At the current purchase price of .68 per IP and a lease rate of .5859 monthly, the implied annual yield is 18.7%. That is an attractive return by any fixed-income standard — but it carries counterparty risk, abuse liability, and the secular risk of IPv6 displacement eroding future demand.
What does the tight spread between average and median price indicate?
The average of .68 versus the median of .50 — a gap of just .18 — indicates a well-distributed market with limited outlier distortion. Price discovery in IPv4 has matured considerably; extreme premiums or fire-sale discounts are increasingly rare.
Are there risks to buying from less-active RIR regions like APNIC or LACNIC?
The discount is real — APNIC averaged .96 versus .94 for ARIN — but so are the complications. Inter-RIR transfers add regulatory steps, longer settlement timelines, and potential routing acceptance issues. Buyers should confirm upstream acceptance before committing to cross-region acquisitions.
How should enterprise buyers think about the 0K–M deal segment?
This band captured 38 deals totaling .4 million in 2023 — the sweet spot for mid-market enterprises acquiring /16-range blocks. Buyers in this tier have enough volume to negotiate modest discounts off posted rates but not enough to command the institutional pricing available on M-plus trades.
What should sellers know about current market conditions before listing?
Prices are softening, with a projected decline to .87 by end-2024. Sellers with discretionary inventory should consider accelerating dispositions rather than waiting for a rebound that the data does not support. Alternatively, leasing at 18.7% annualized yield offers a carry-while-you-wait strategy, but assumes continued lease-market demand.
Is the IPv4 market becoming more or less concentrated?
More concentrated by value, less so by count. The 15 deals above M represented 42% of total dollar volume but under 3% of transactions. Meanwhile, 407 sub-K deals confirm a robust retail layer. The market is bifurcating into institutional block trades and small-lot retail — with surprisingly little middle ground.