15 min read
This report analyzes the IPv4 transfer market for Q2 2024, based on completed IPv4Center marketplace transactions and official RIR transfer records.
Executive Summary
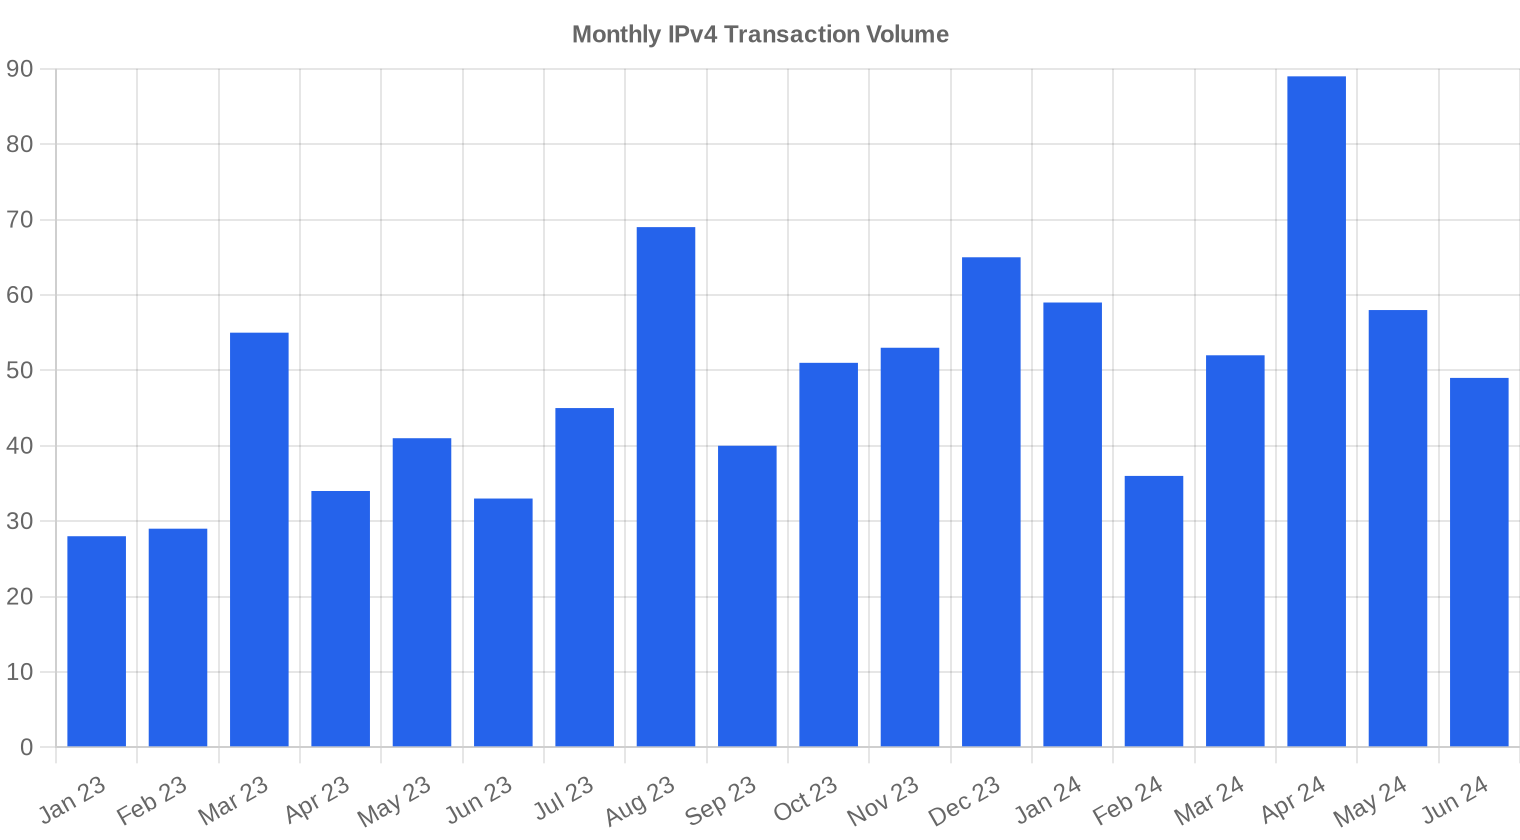
The IPv4 transfer market moved 393,984 addresses across 196 transactions in Q2 2024, generating $13.3 million in aggregate deal value. Average pricing landed at $33.18 per IP, down just $0.30 from Q1 2024 — a modest 0.29% decline that masks a much sharper 13.8% drop from Q2 2023's levels. The real story this quarter is volume: transaction count jumped 33.3% versus Q1, the largest quarter-over-quarter acceleration we've tracked in recent memory. Median pricing held at $32.50 while the floor-to-ceiling range spanned $26 to $50, reflecting persistent segmentation across RIRs and block quality. The market is trading more but paying less — a dynamic consistent with a maturing secondary market where supply is loosening at the margins.Market Overview
| Transactions | 196 |
| IP Addresses Traded | 393,984 |
| Estimated Market Value | $13,283,978 |
| Average Price / IP | $33.18 |
| Median Price / IP | $32.50 |
| RIR Transfers | 2,243 |
Year-over-Year Comparison
| Metric | This period | A year earlier (Q2 2023) | Change |
|---|---|---|---|
| Transactions | 196 | 108 | +81.5% |
| IP Addresses Traded | 393,984 | 169,728 | +132.1% |
| Estimated Market Value | $13,283,978 | $6,544,968 | +103.0% |
| Average Price / IP | $33.18 | $38.51 | -13.8% |
| RIR Transfers | 2,243 | 2,385 | -6.0% |
Price Dynamics
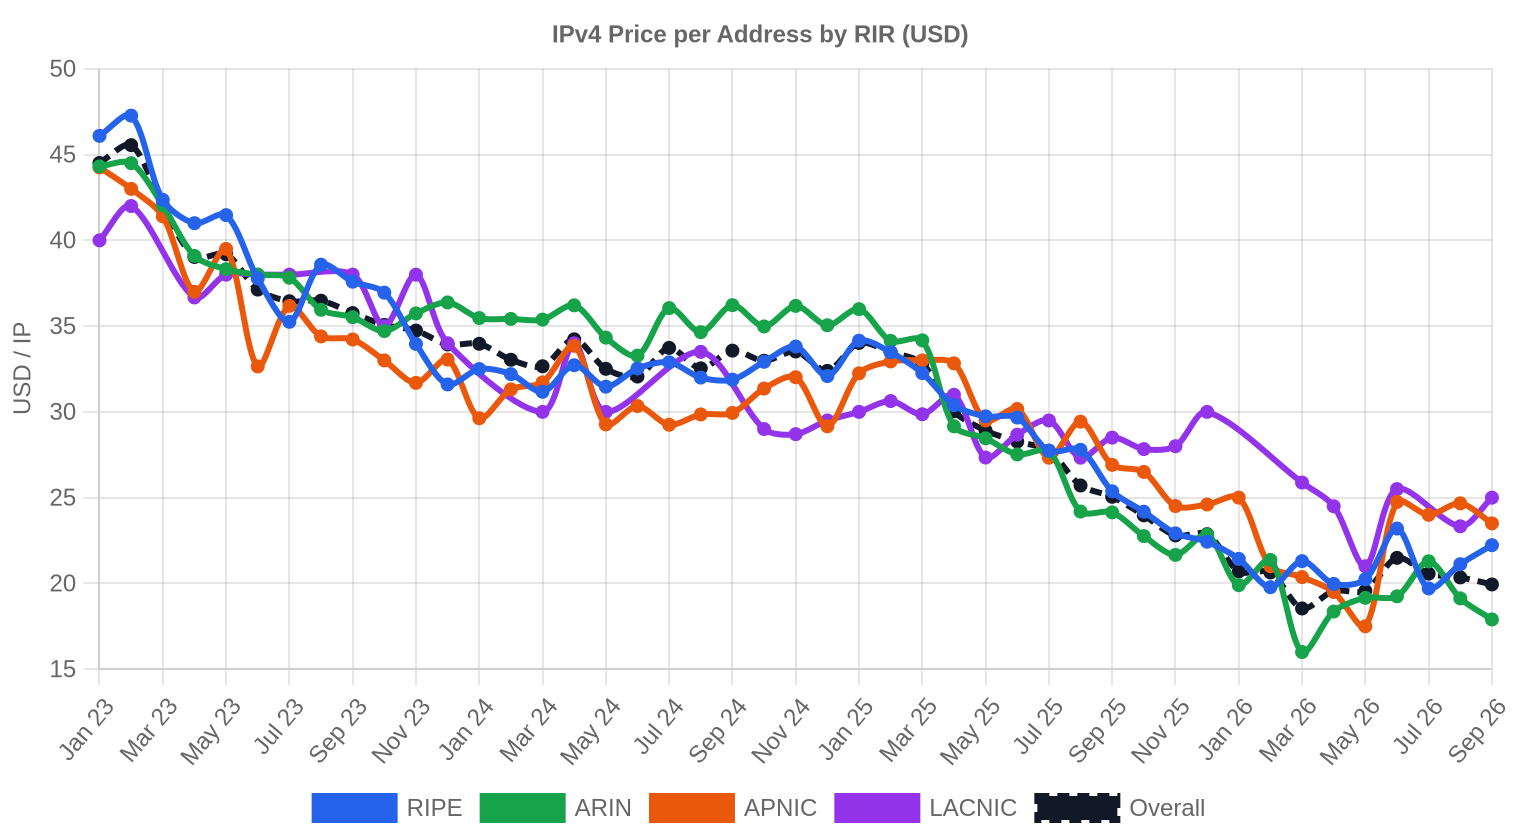
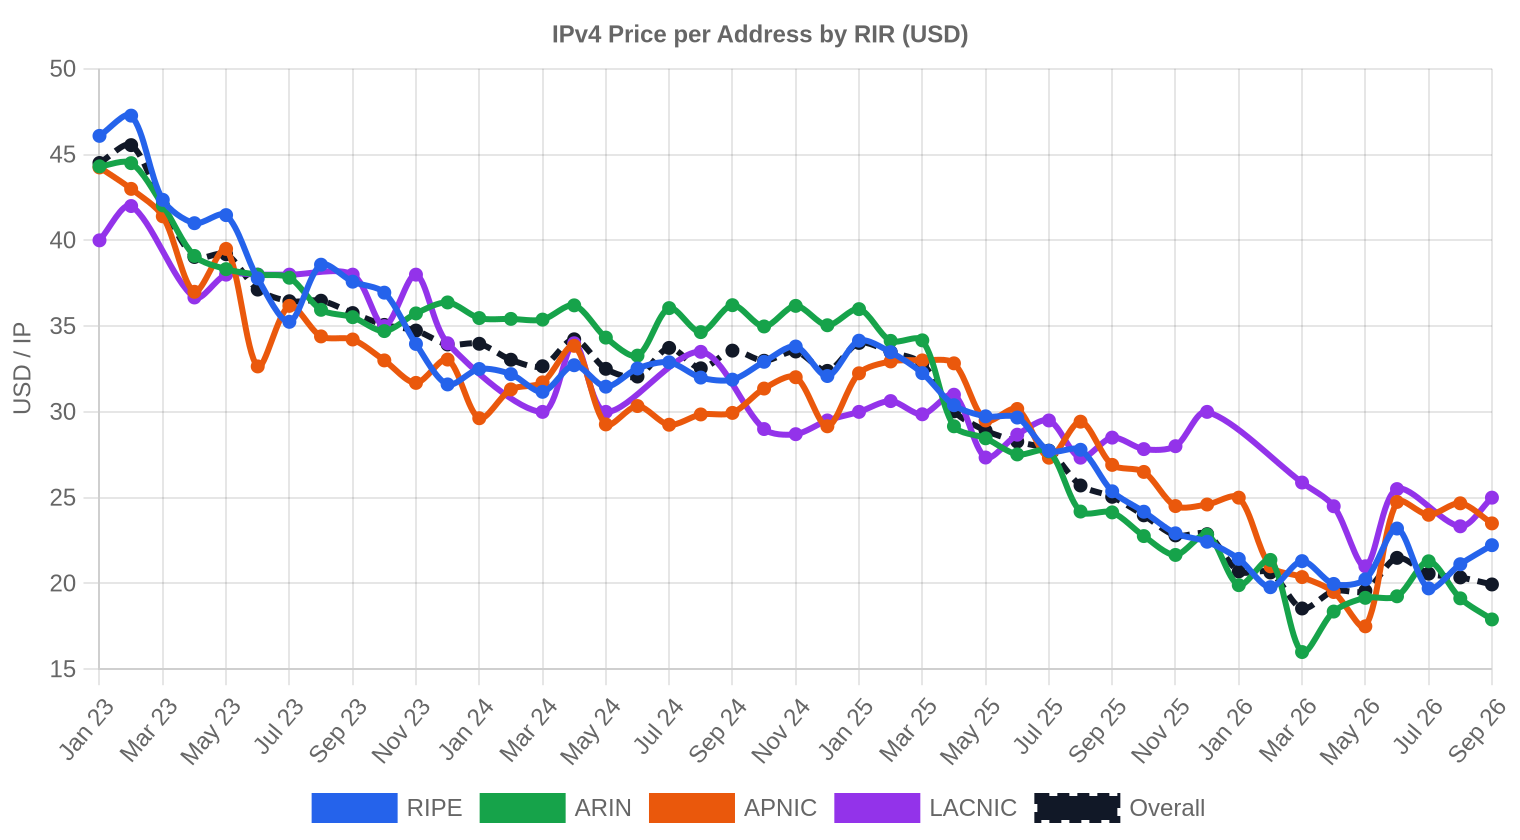
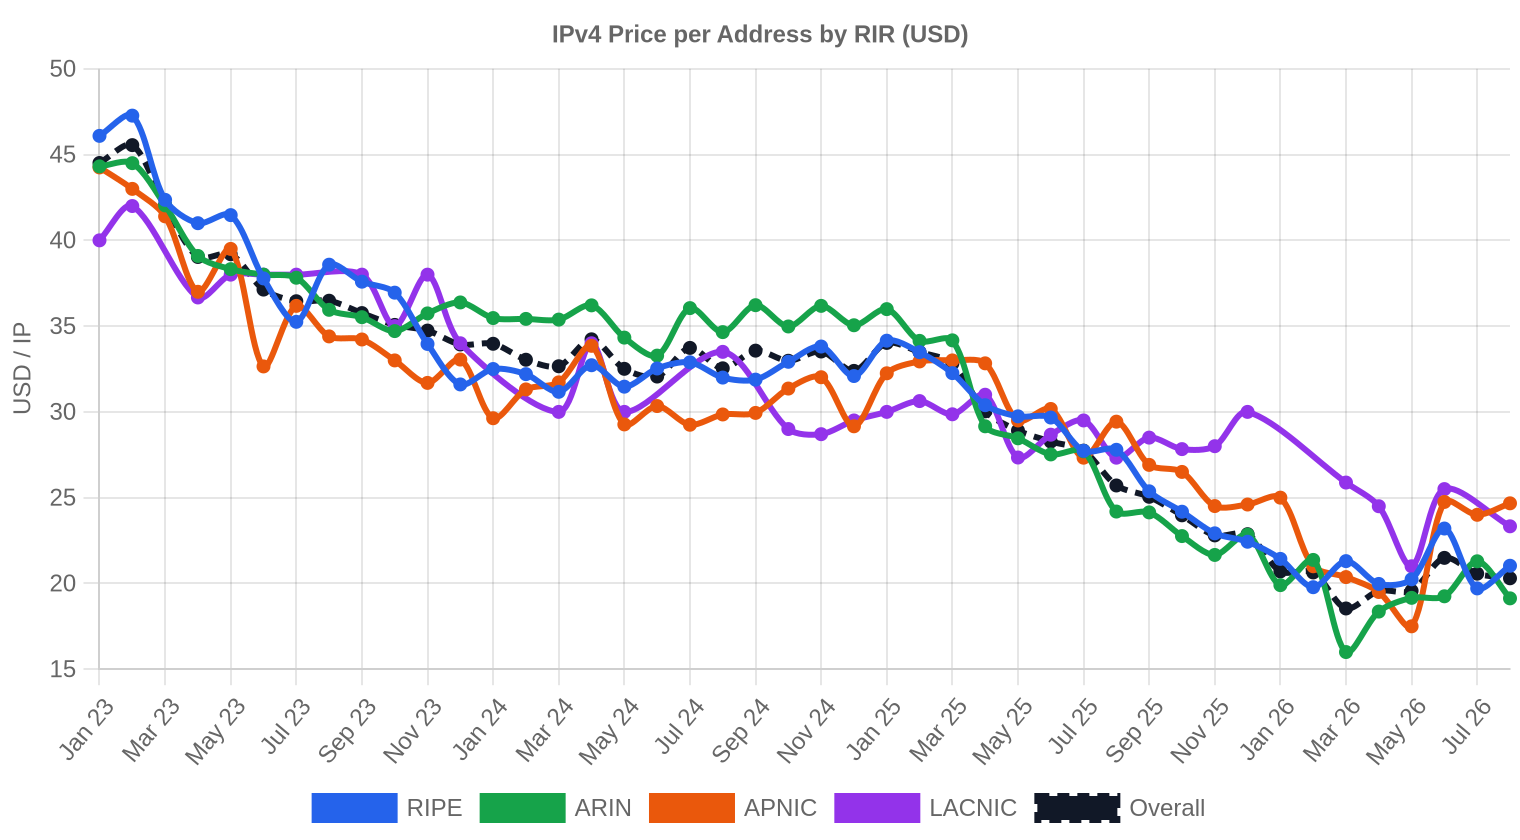
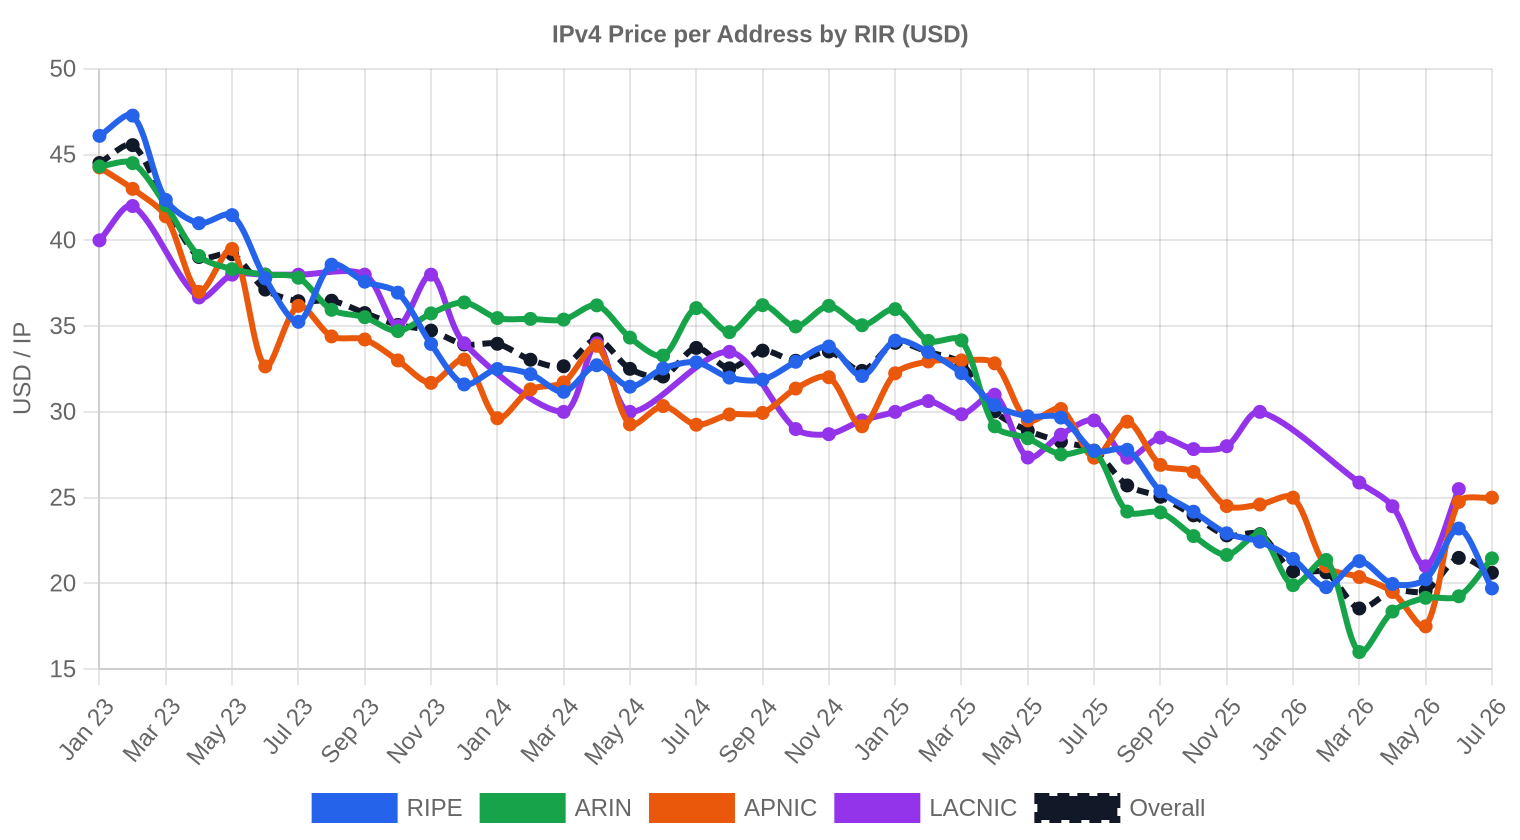
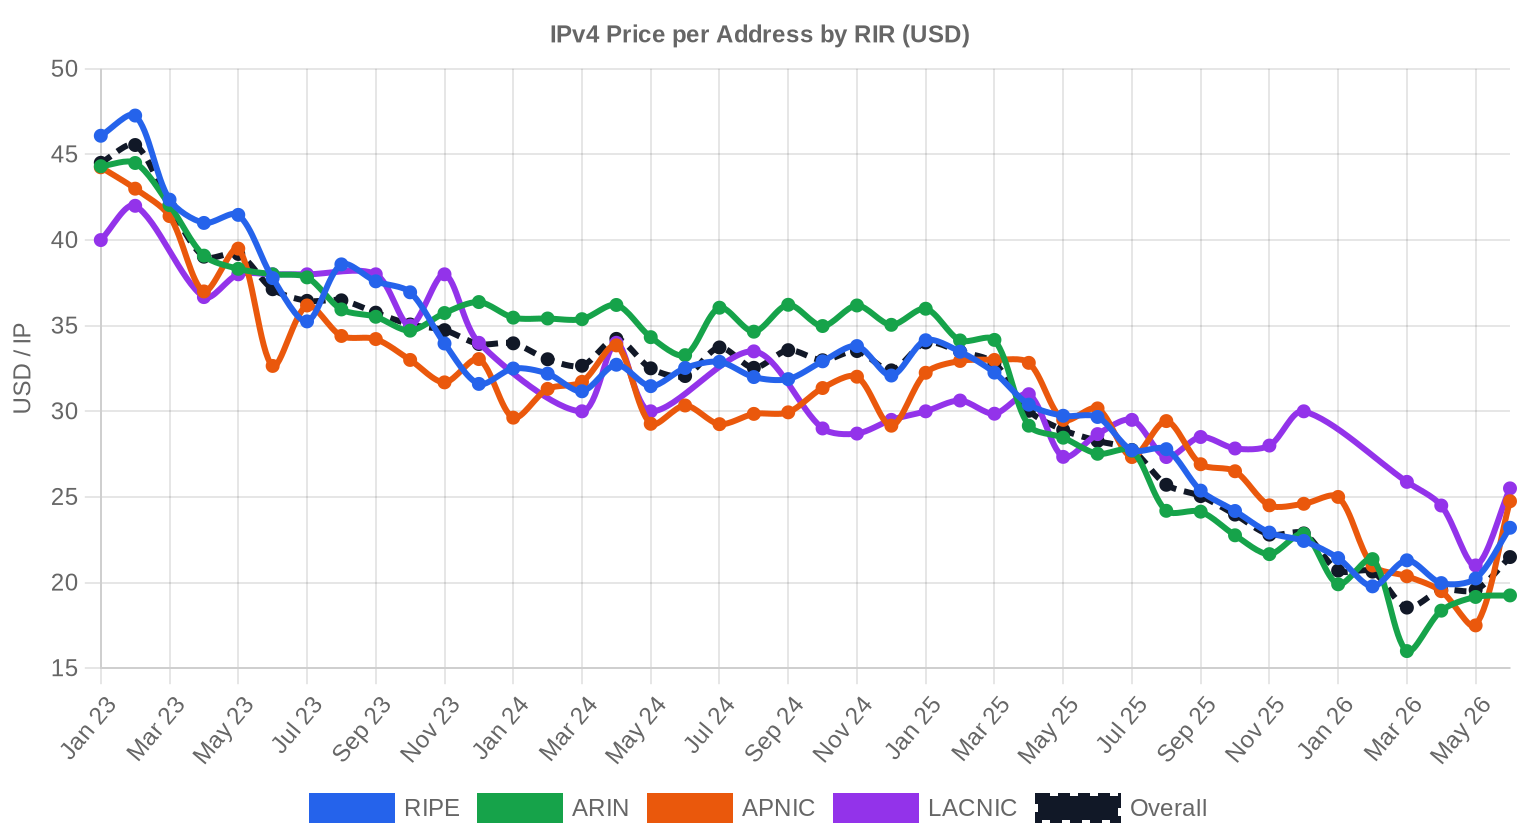
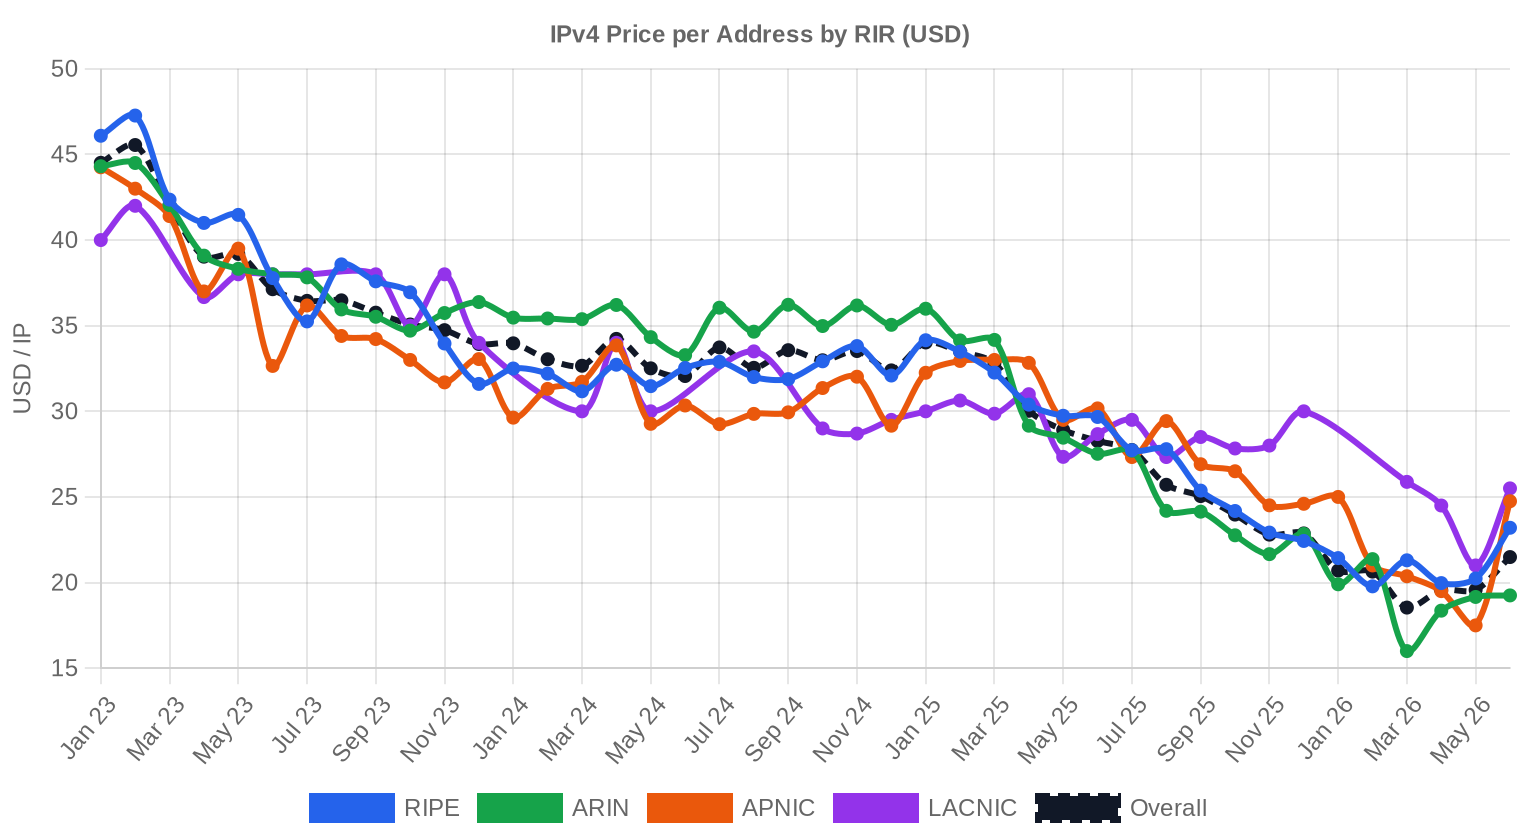
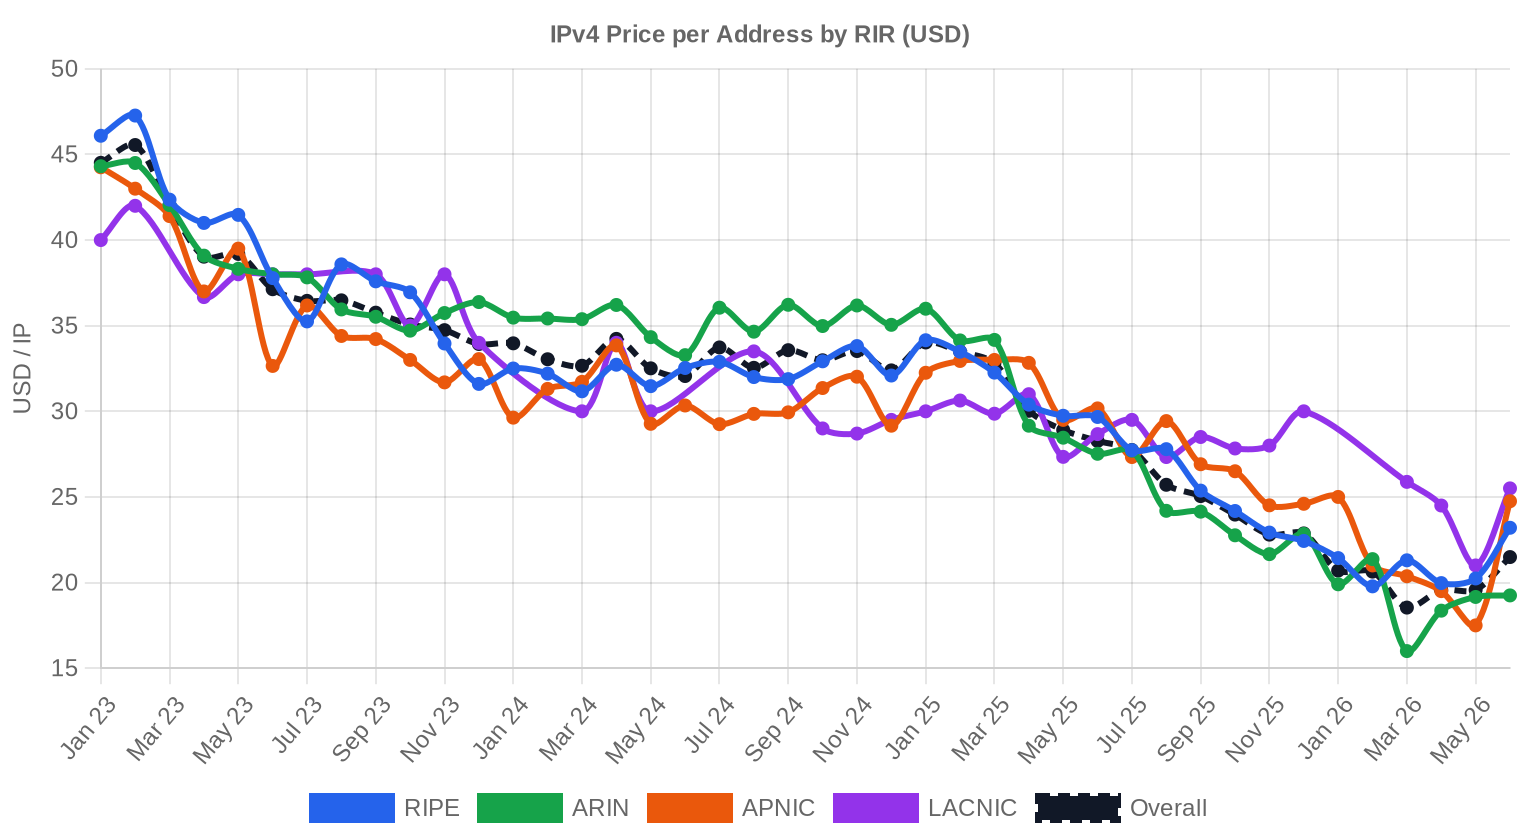
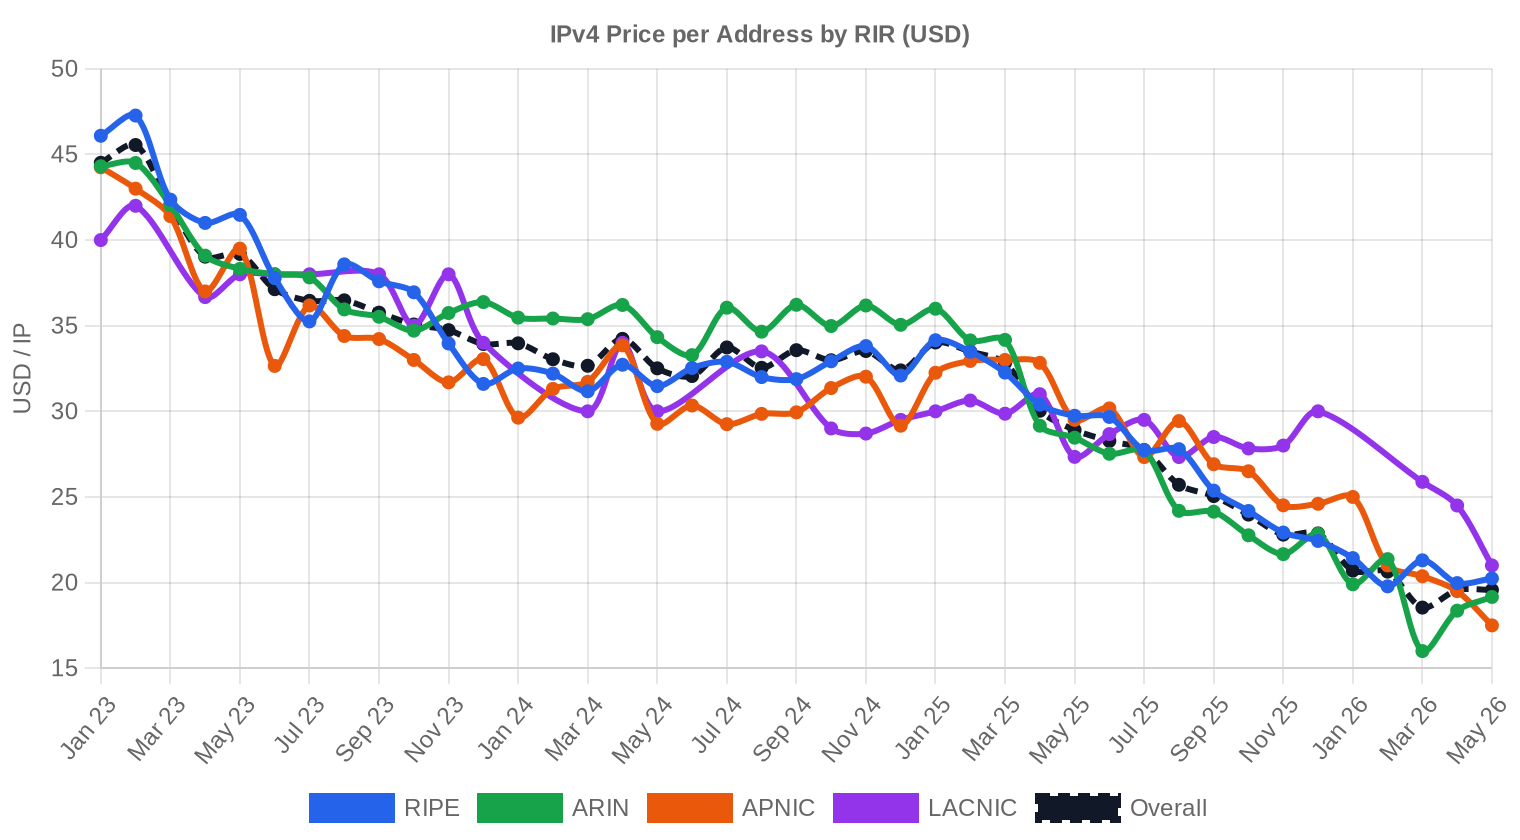
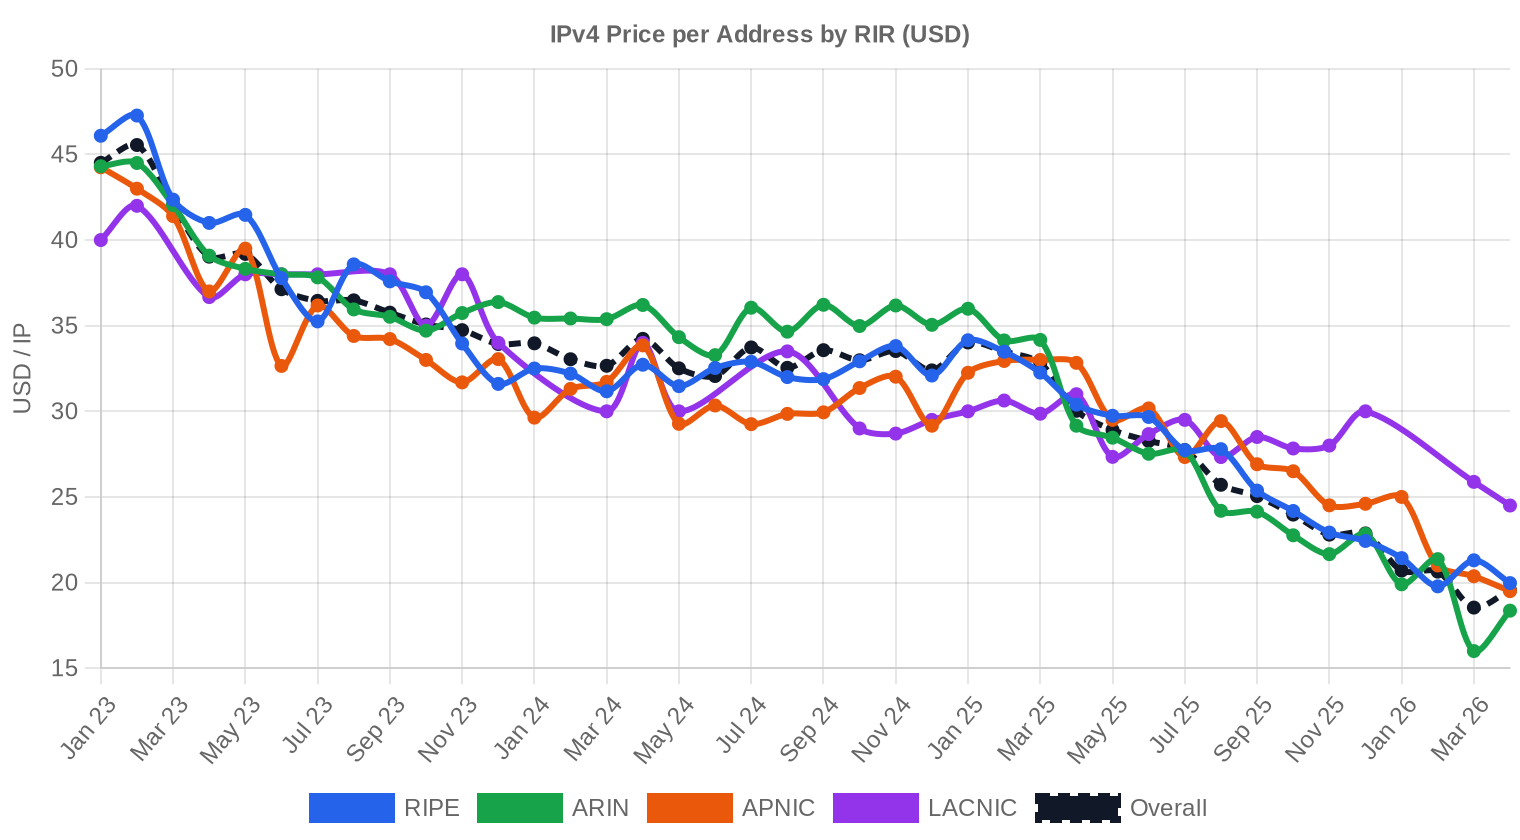
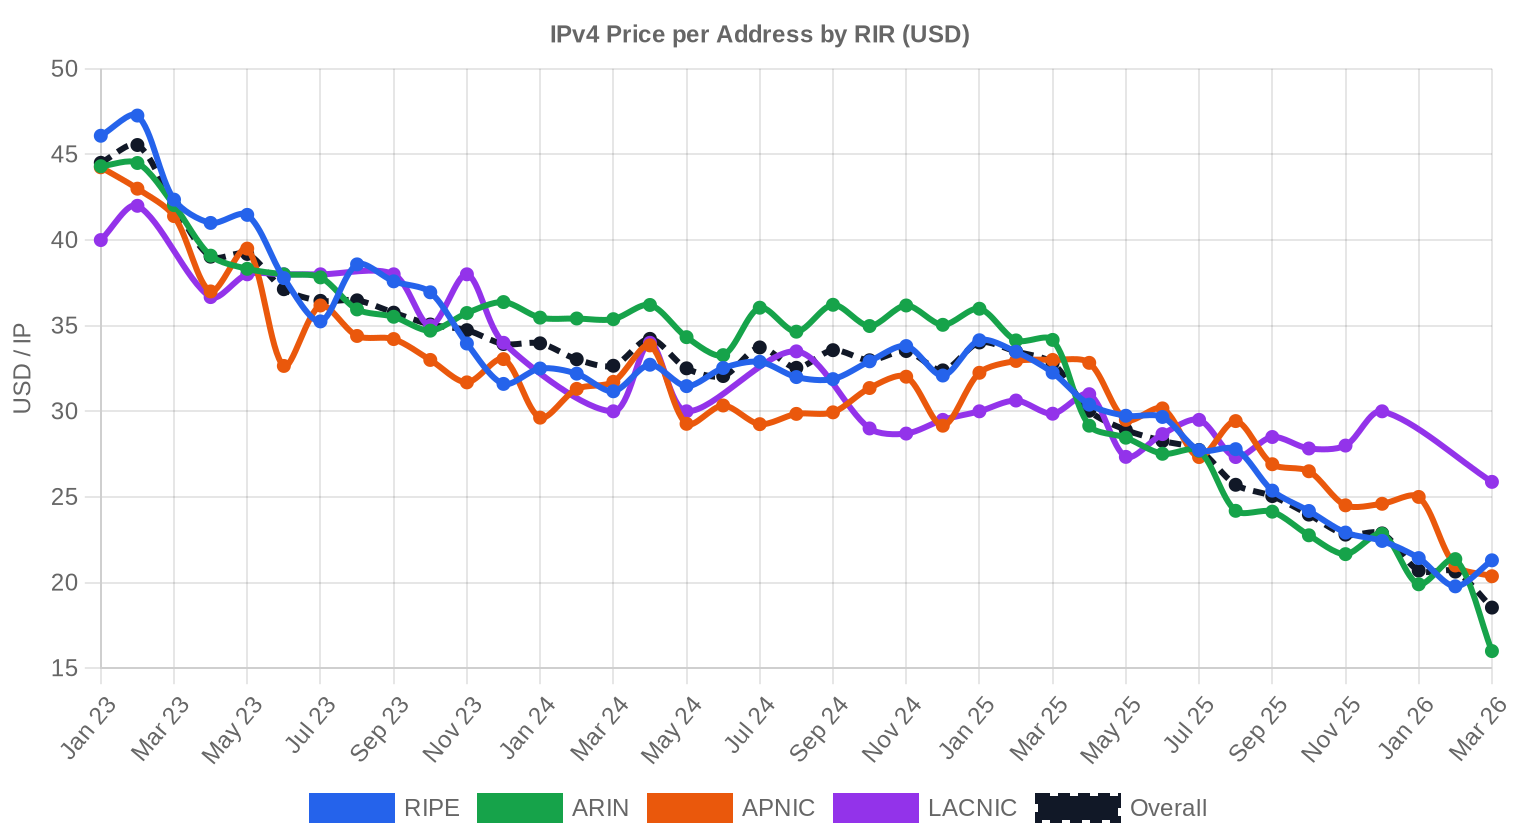
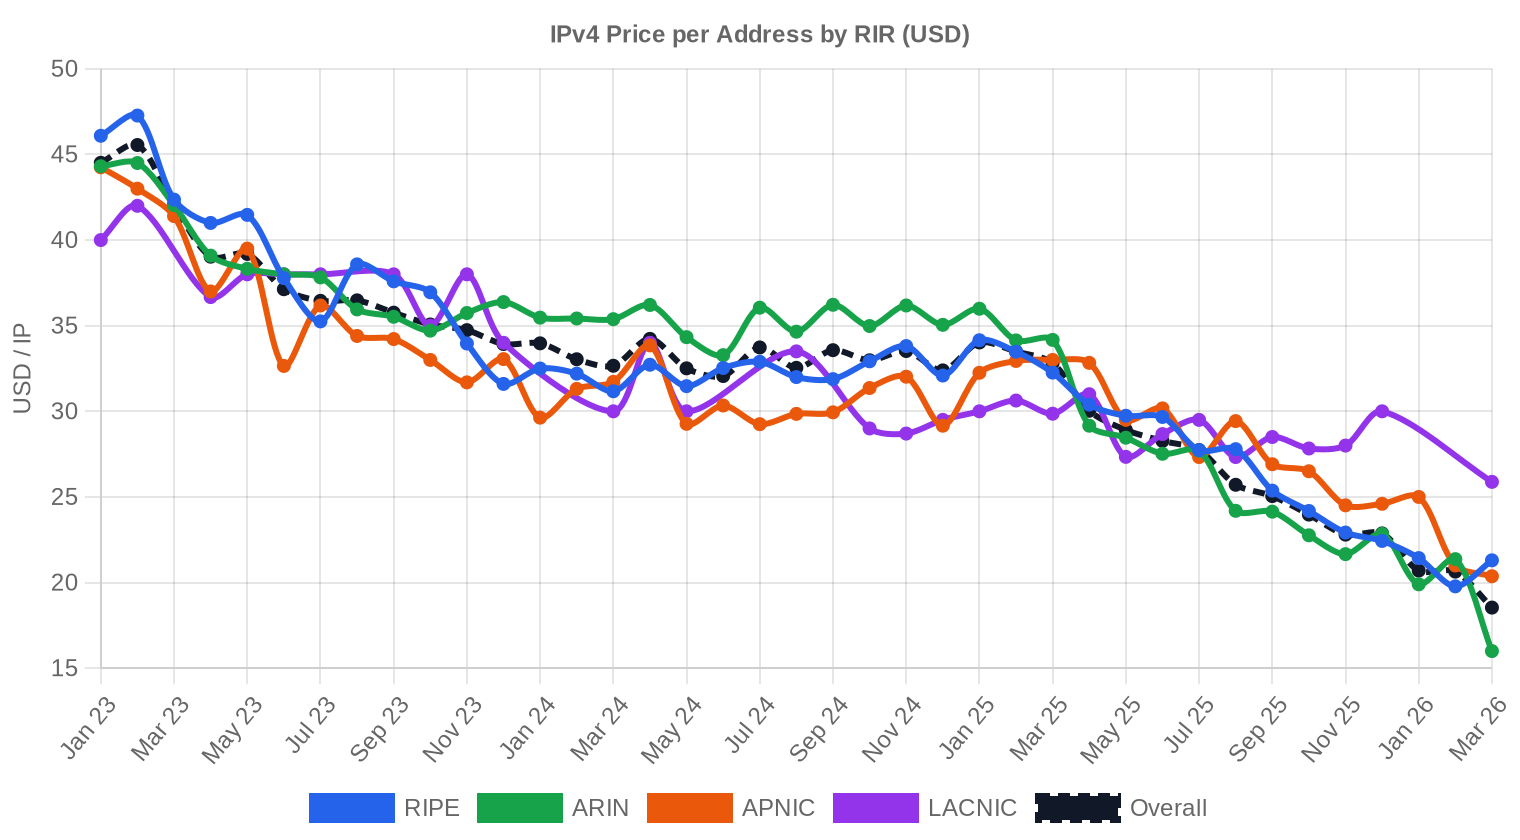
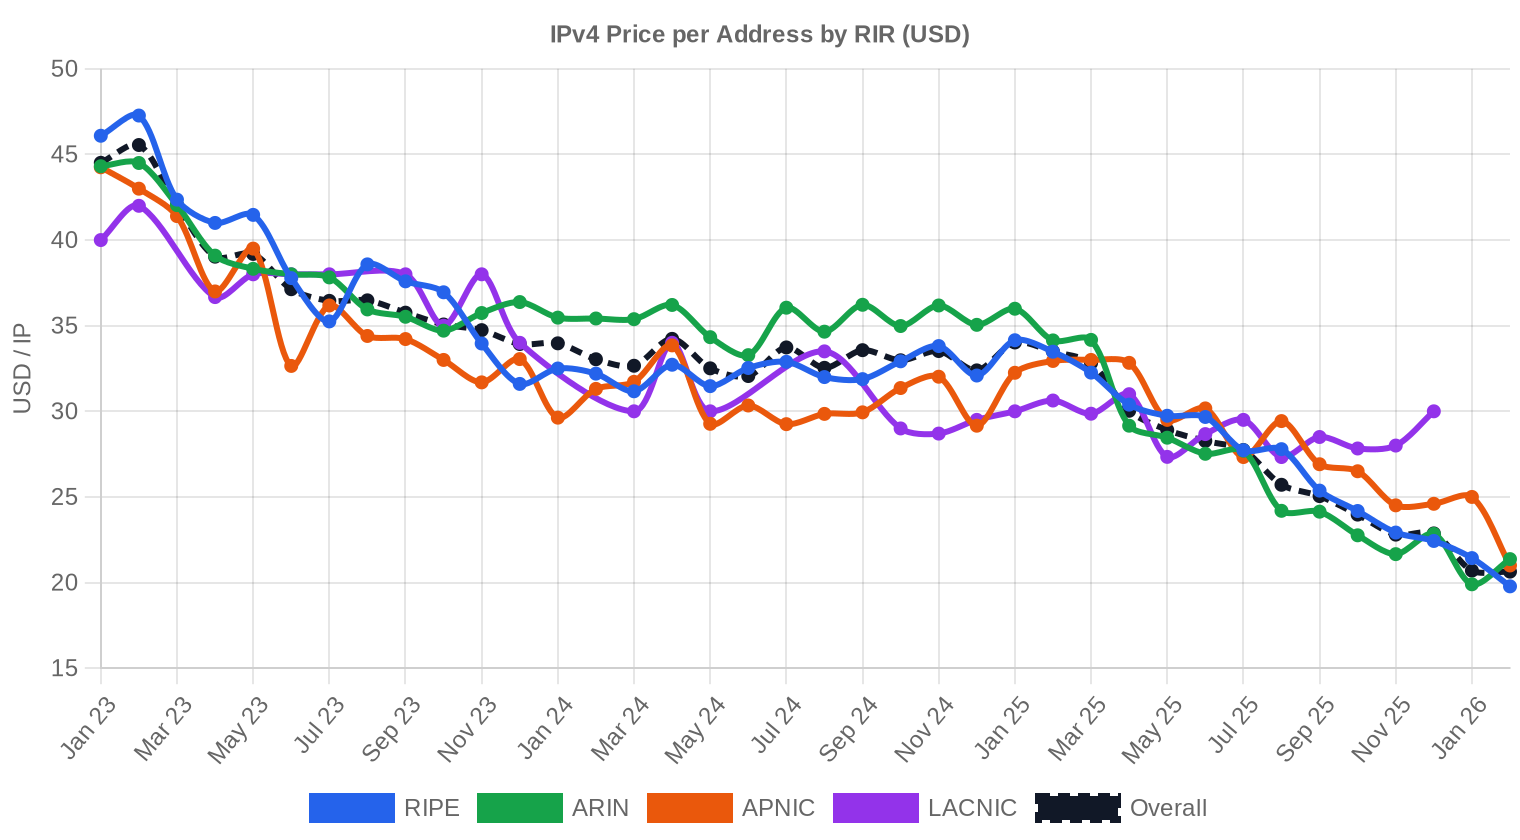
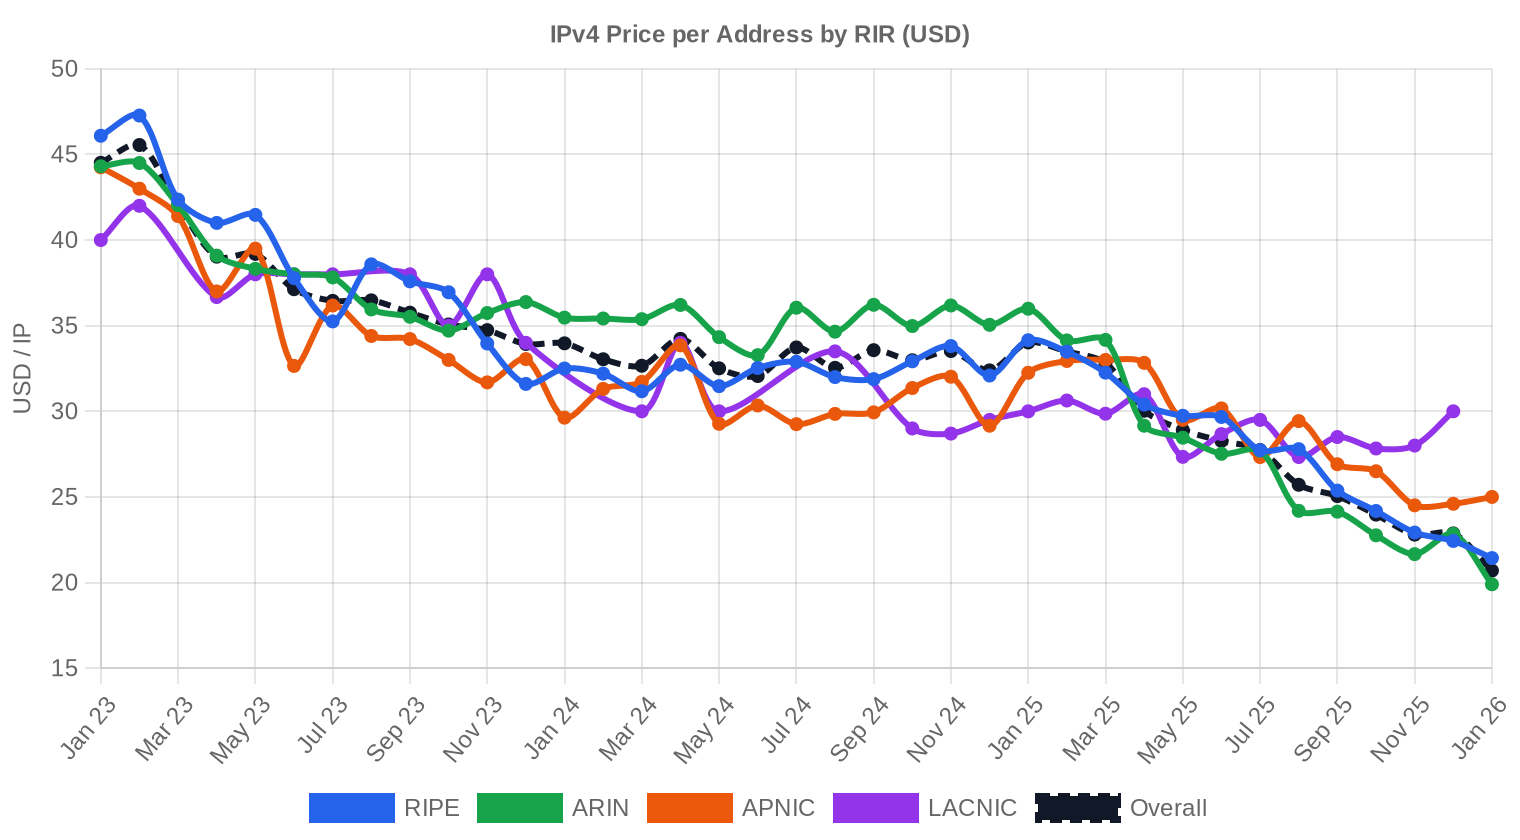
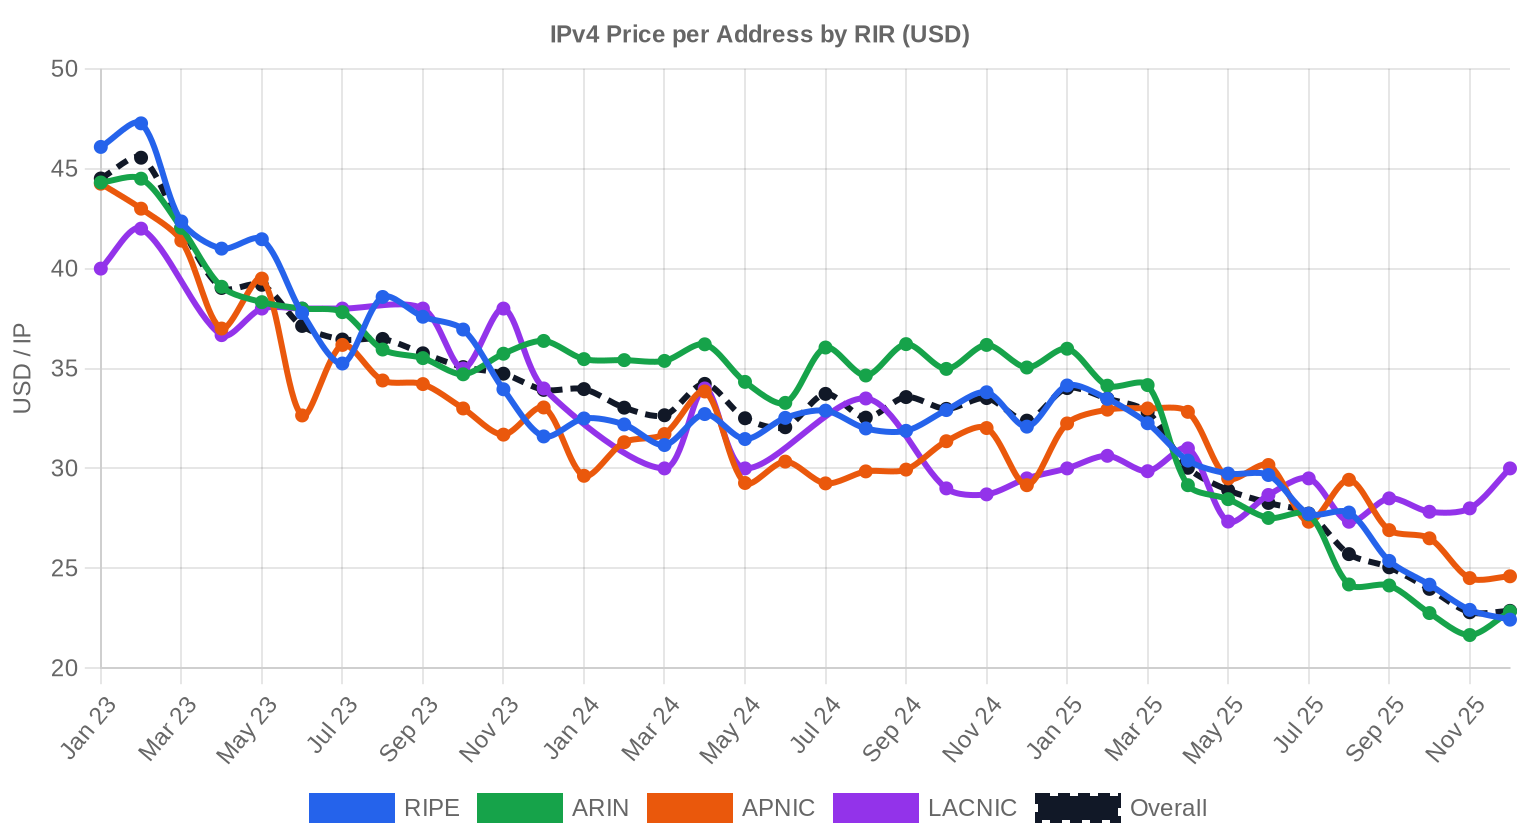
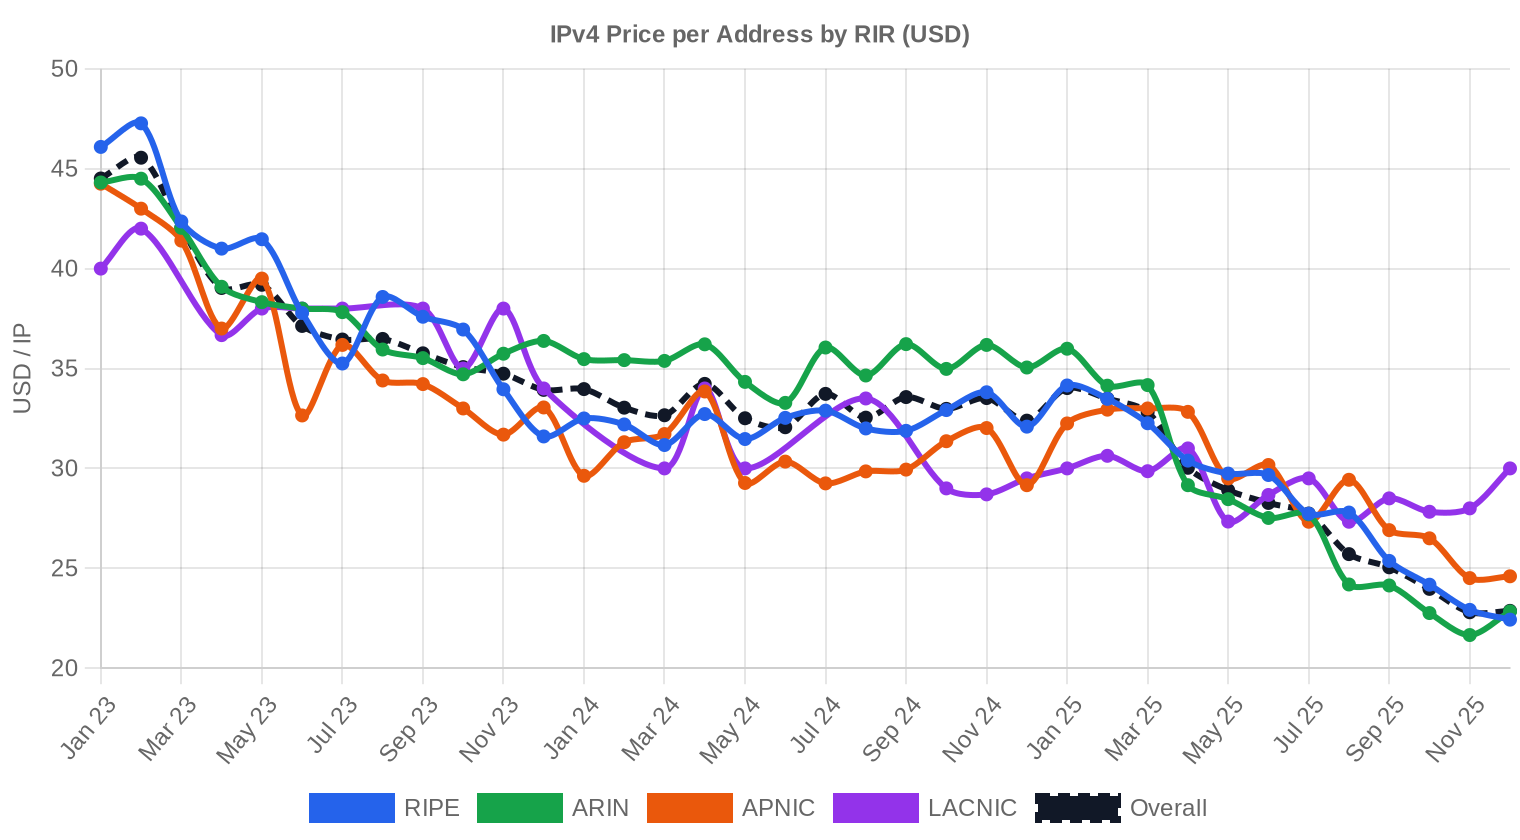
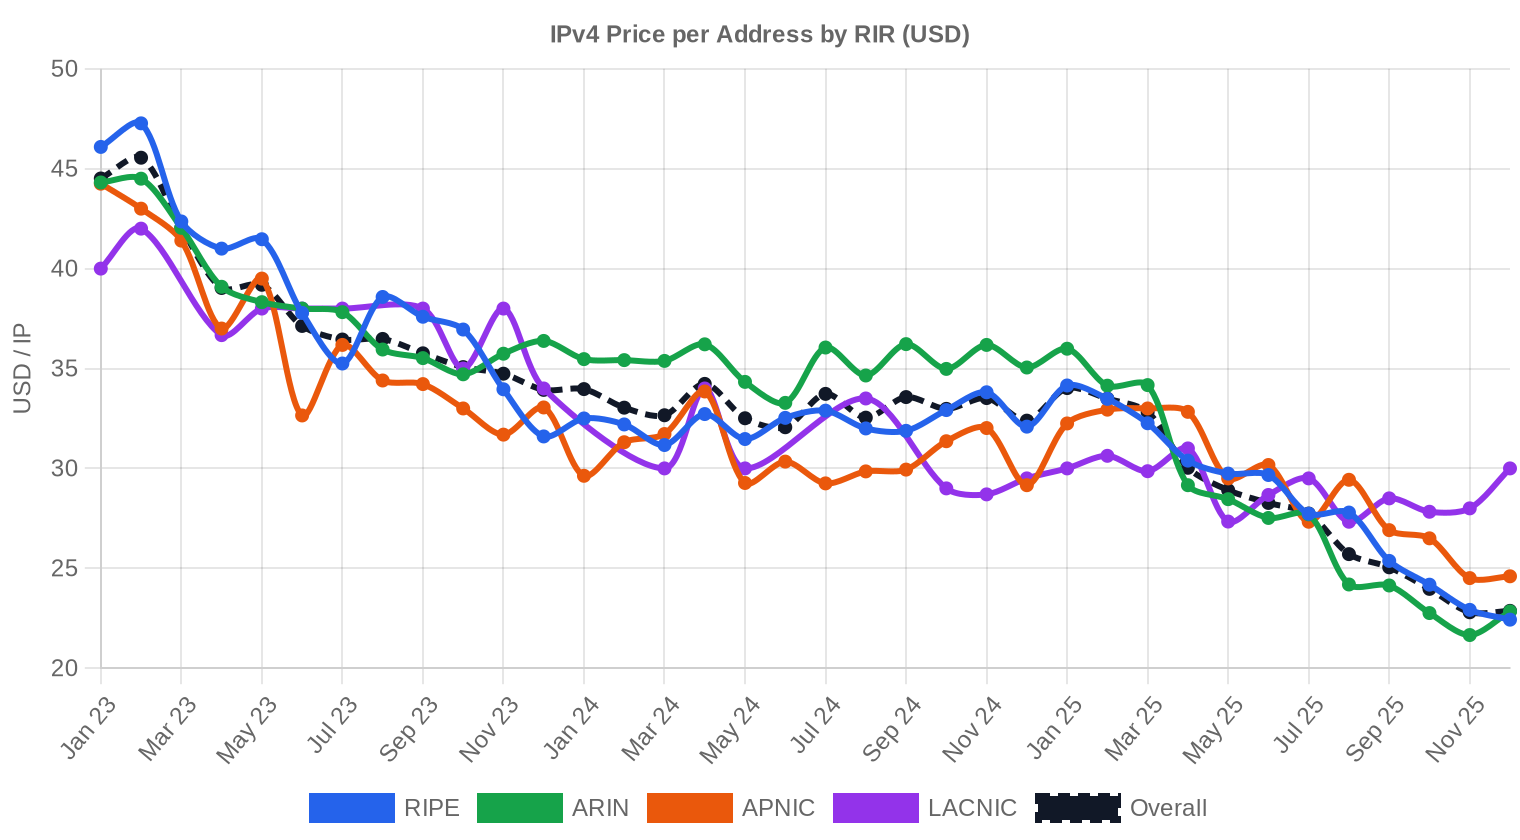
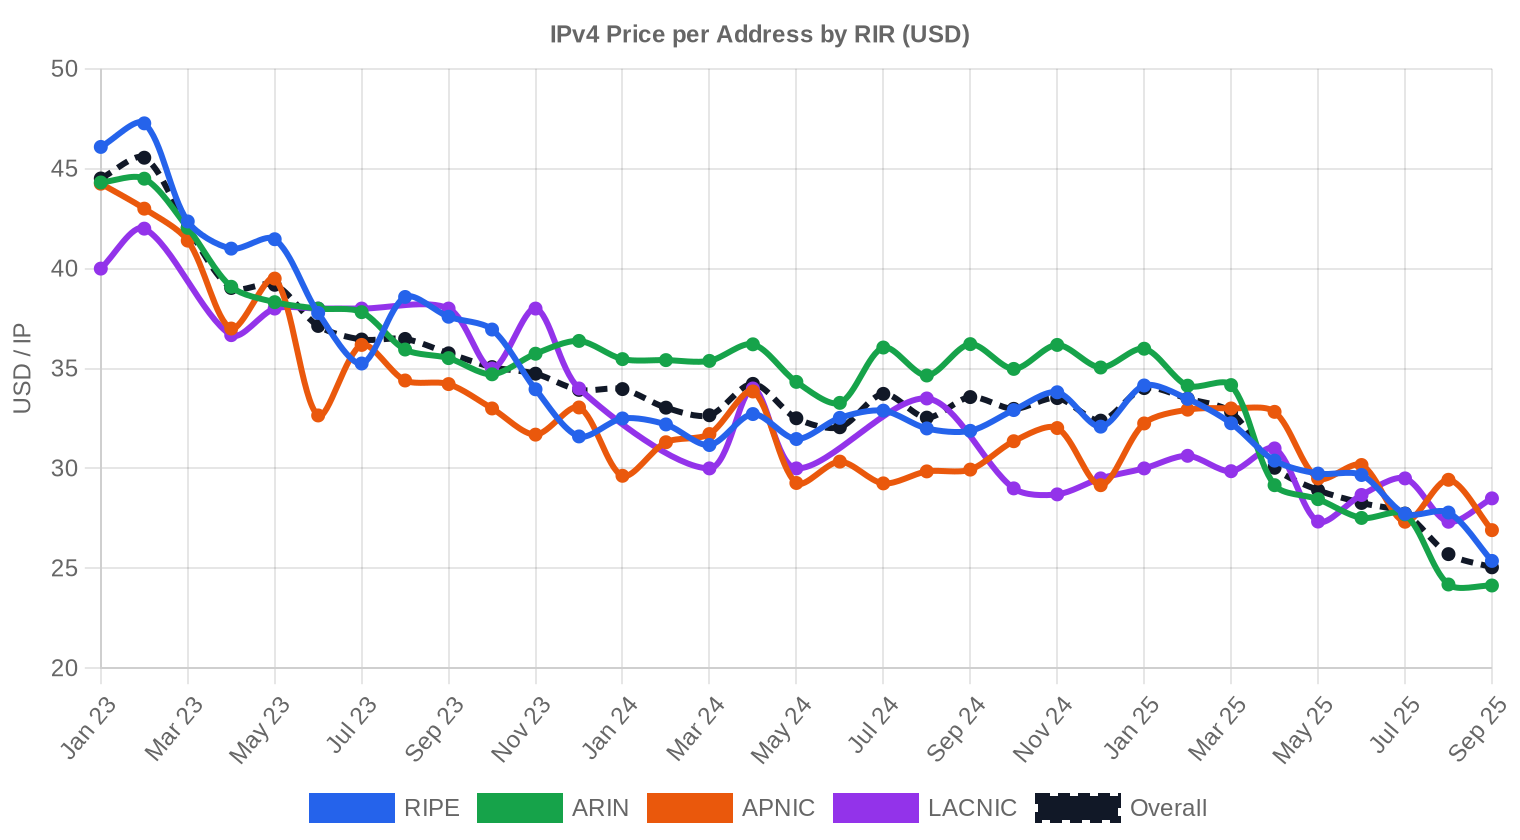
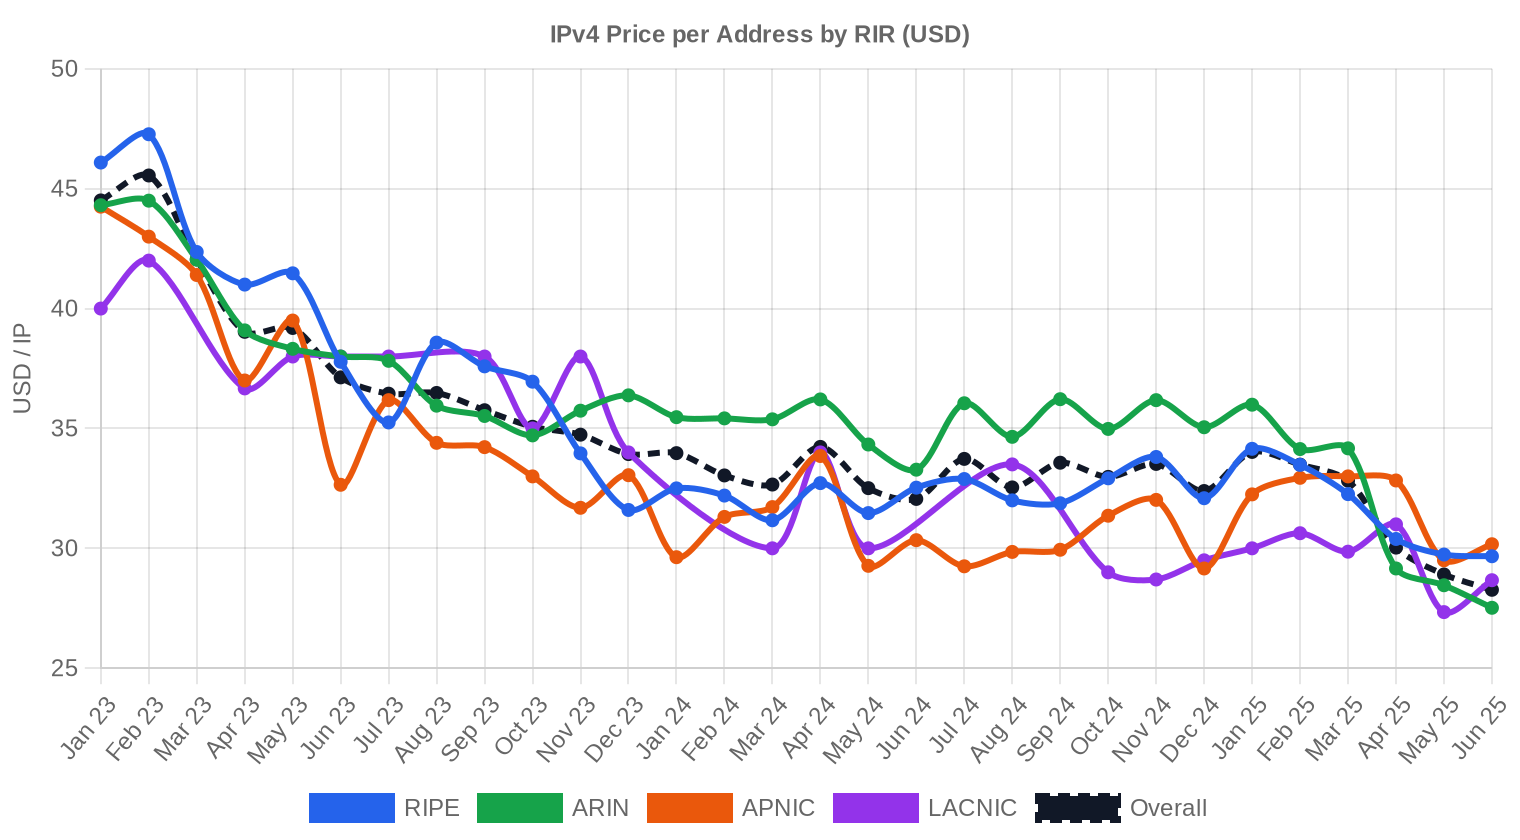
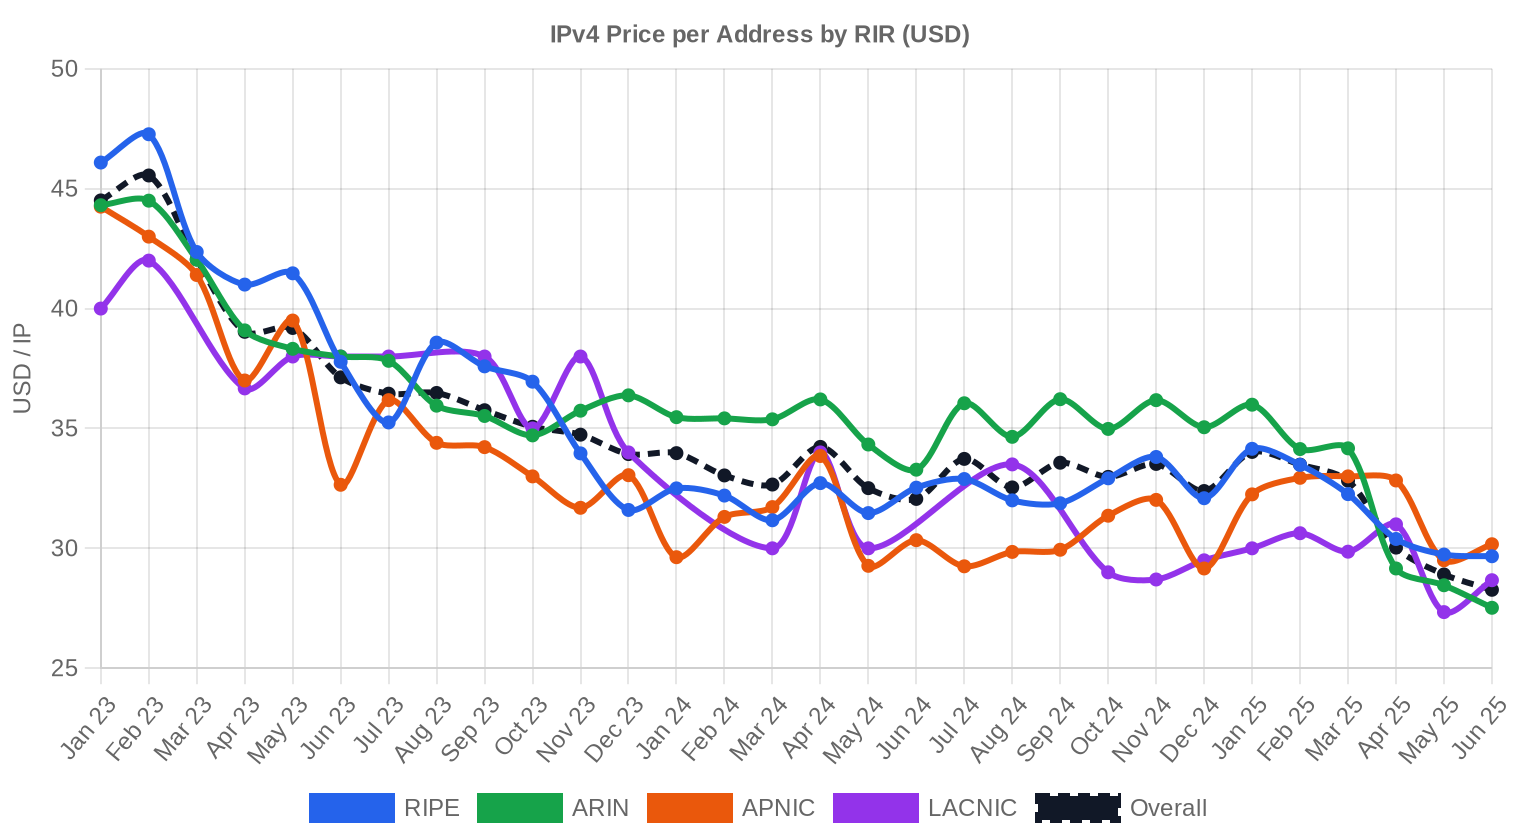
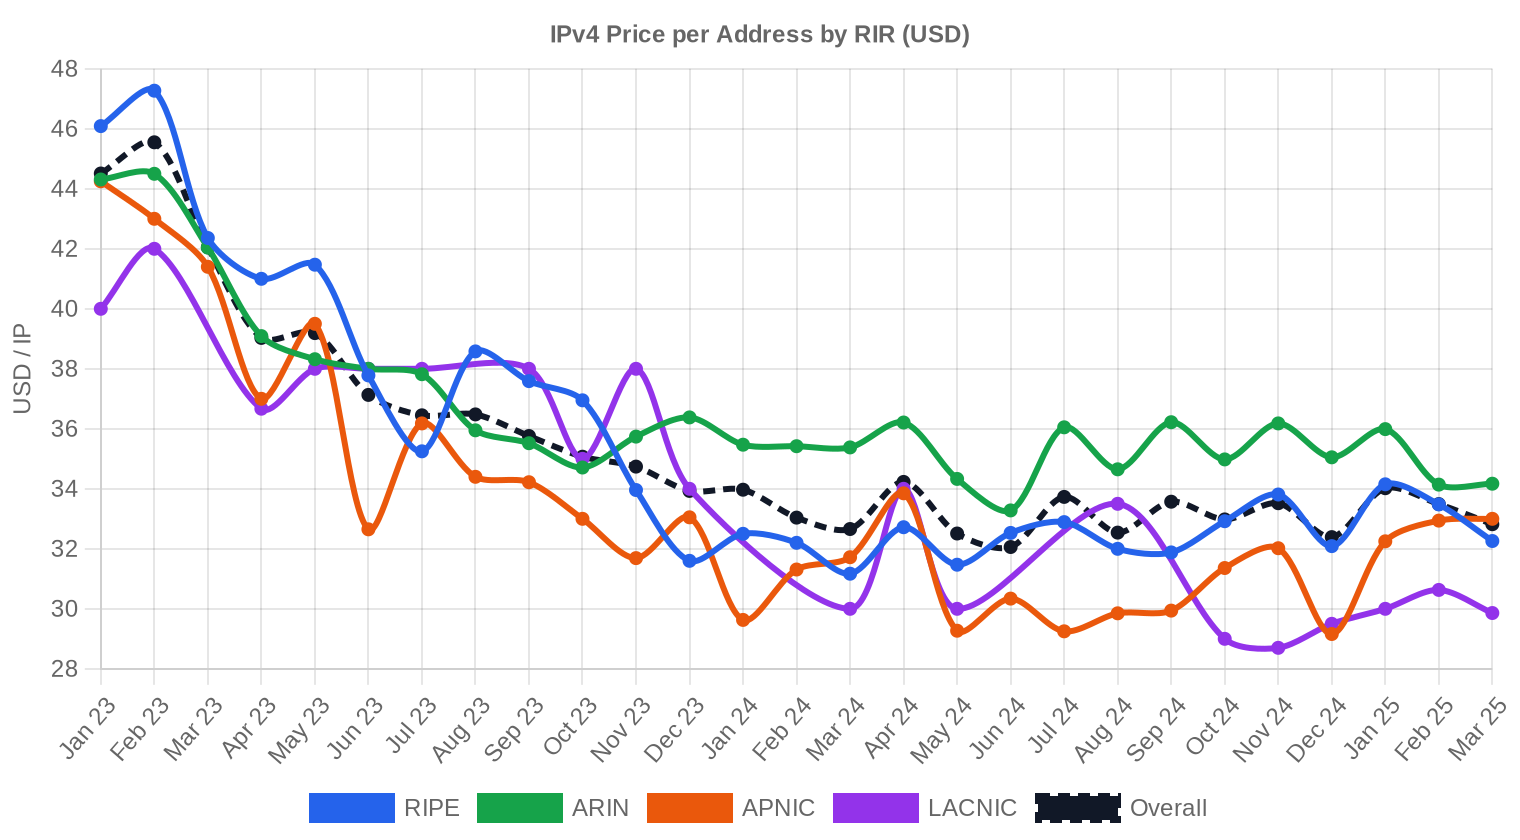
The $24 spread between the quarter's low ($26) and high ($50) tells a story of two markets. Clean, small ARIN blocks with verified provenance are still commanding $50 per IP at the top end, while larger APNIC and bulk RIPE inventory is clearing closer to the low-$30s. The weighted average slipped $0.30 from Q1's $33.48, barely registering as a move — but the year-over-year trajectory is unmistakable: we're down 13.8% from Q2 2023. The regression trend points firmly downward. Buyers who waited 12 months saved roughly $5.30 per address, which on a /16 block translates to nearly $347,000 in avoided cost. The pricing compression between RIRs is tightening too — RIPE's $32.35 average and APNIC's $32.02 are now within 33 cents of each other, leaving only ARIN as the clear premium registry.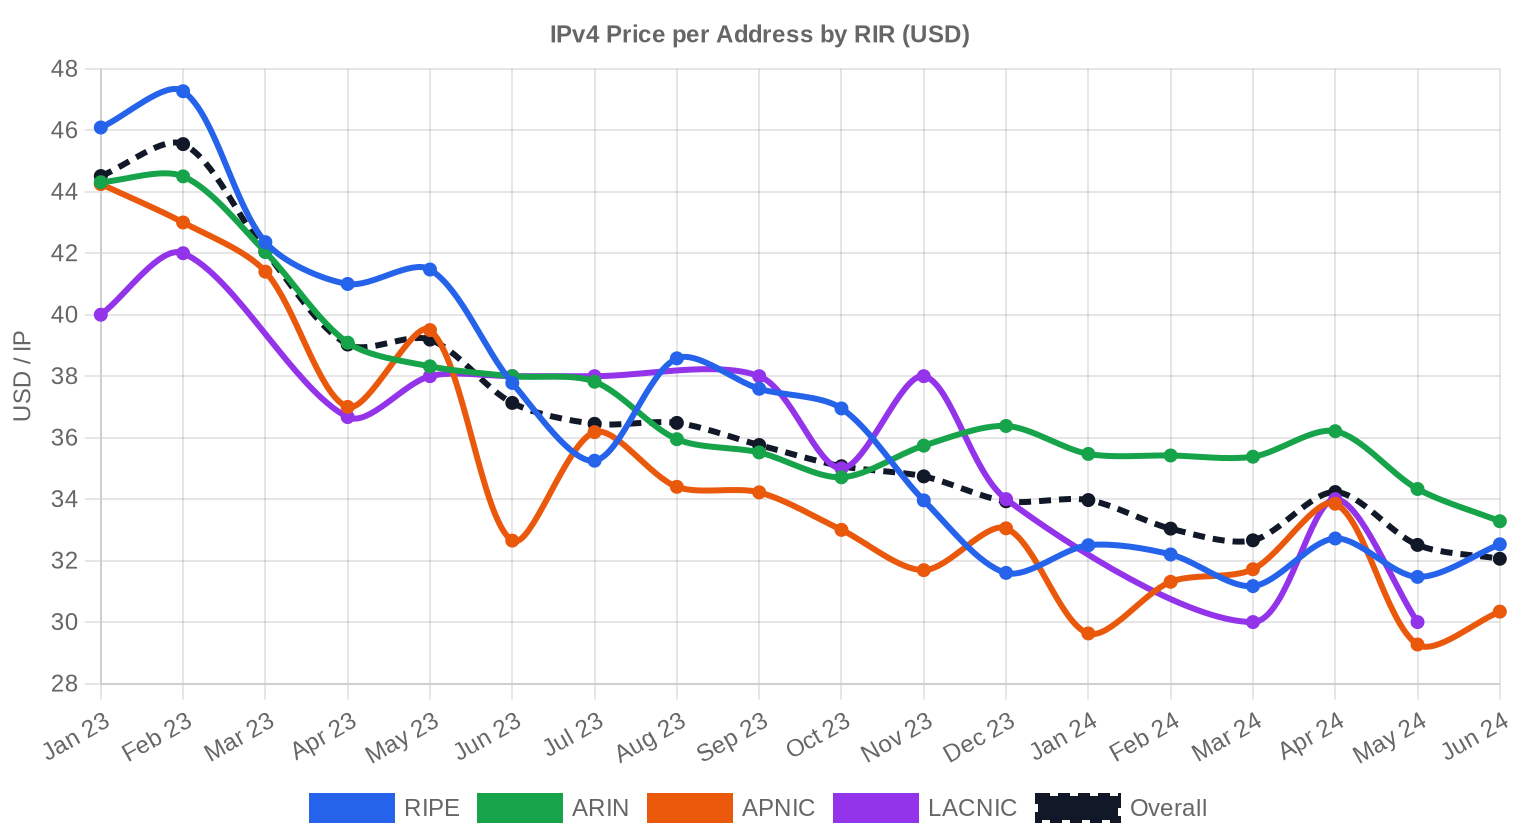
Pricing by RIR
ARIN led on transaction count with 74 deals but commanded the highest average price at $34.82 per IP — a $2.47 premium over the market-wide average. That premium reflects the ongoing regulatory familiarity and legal clarity that North American buyers prize, plus the broader max range hitting $50 on select blocks. RIPE came in second with 62 transactions at $32.35 average, its tight $29–$36.50 band suggesting a more commoditized, liquid market. APNIC quietly moved the most IPs — 136,704 addresses across 58 deals — at the lowest average of $32.02, making Asia-Pacific the value play this quarter. LACNIC contributed two transactions at a flat $32 average, too thin to draw conclusions but consistent with that registry's historically sparse secondary activity. AFRINIC recorded zero transactions.ARIN: $34.82/IP across 74 transactions (37.8% of volume).
RIPE: $32.35/IP across 62 transactions (31.6% of volume).
APNIC: $32.02/IP across 58 transactions (29.6% of volume).
LACNIC: $32.00/IP across 2 transactions (1.0% of volume).
AFRINIC: No recorded transactions.
| RIR | Transactions | Avg $/IP | Median $/IP | IPs Traded | RIR Transfers | Next Month (proj.) | Year-End (proj.) |
|---|---|---|---|---|---|---|---|
| RIPE | 62 | $32.35 | $32.50 | 122,624 | 1,541 | $32.50 | $32.00 |
| ARIN | 74 | $34.82 | $34.00 | 125,440 | 702 | $33.00 | $32.00 |
| APNIC | 58 | $32.02 | $31.00 | 136,704 | 0 | $29.00 | $28.50 |
| LACNIC | 2 | $32.00 | $32.00 | 9,216 | 0 | $30.00 | $29.00 |
Transaction Volume

Supply & Block Sizes
/24 blocks dominated the quarter with 67 transactions — roughly a third of all deals. This tracks with the ongoing fragmentation of larger legacy allocations into retail-sized chunks, and it reflects the buyer base: mid-market enterprises and regional ISPs that need a single /24 for mail reputation, BGP announcements, or a small service deployment. The sub-$50K deal tier accounted for 123 of 196 transactions, confirming that the market's center of gravity sits firmly in the small-block space.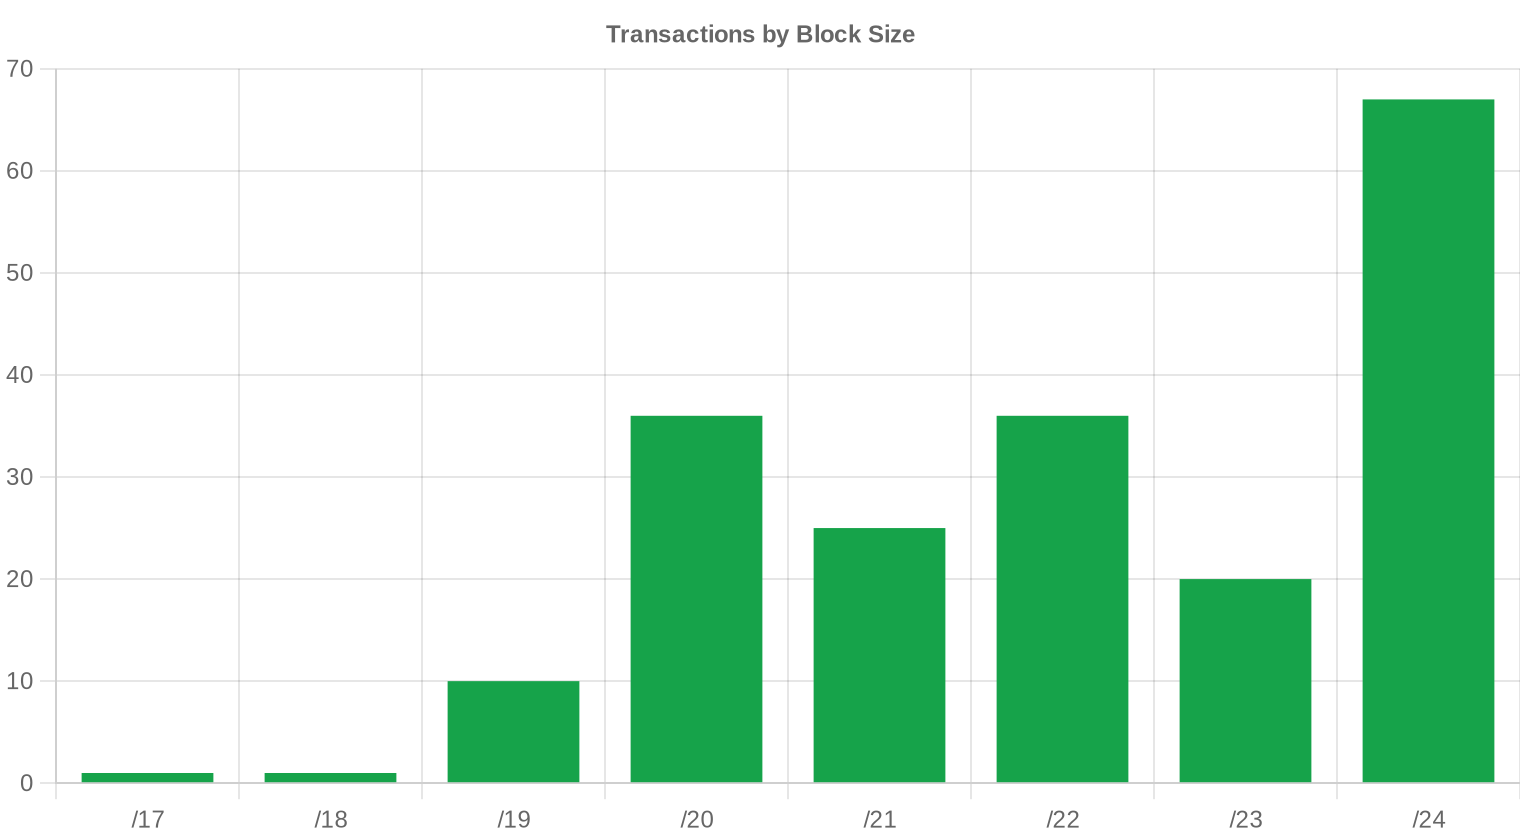
Geographic Activity
Country-level granularity wasn't captured in this quarter's dataset, limiting geographic attribution. That said, the RIR distribution serves as a proxy: ARIN's 37.8% share and RIPE's 31.6% suggest North America and Europe remain the primary demand centers, with APNIC's 29.6% reflecting steady appetite from Southeast Asian and Oceanian operators.Registry Transfer Activity
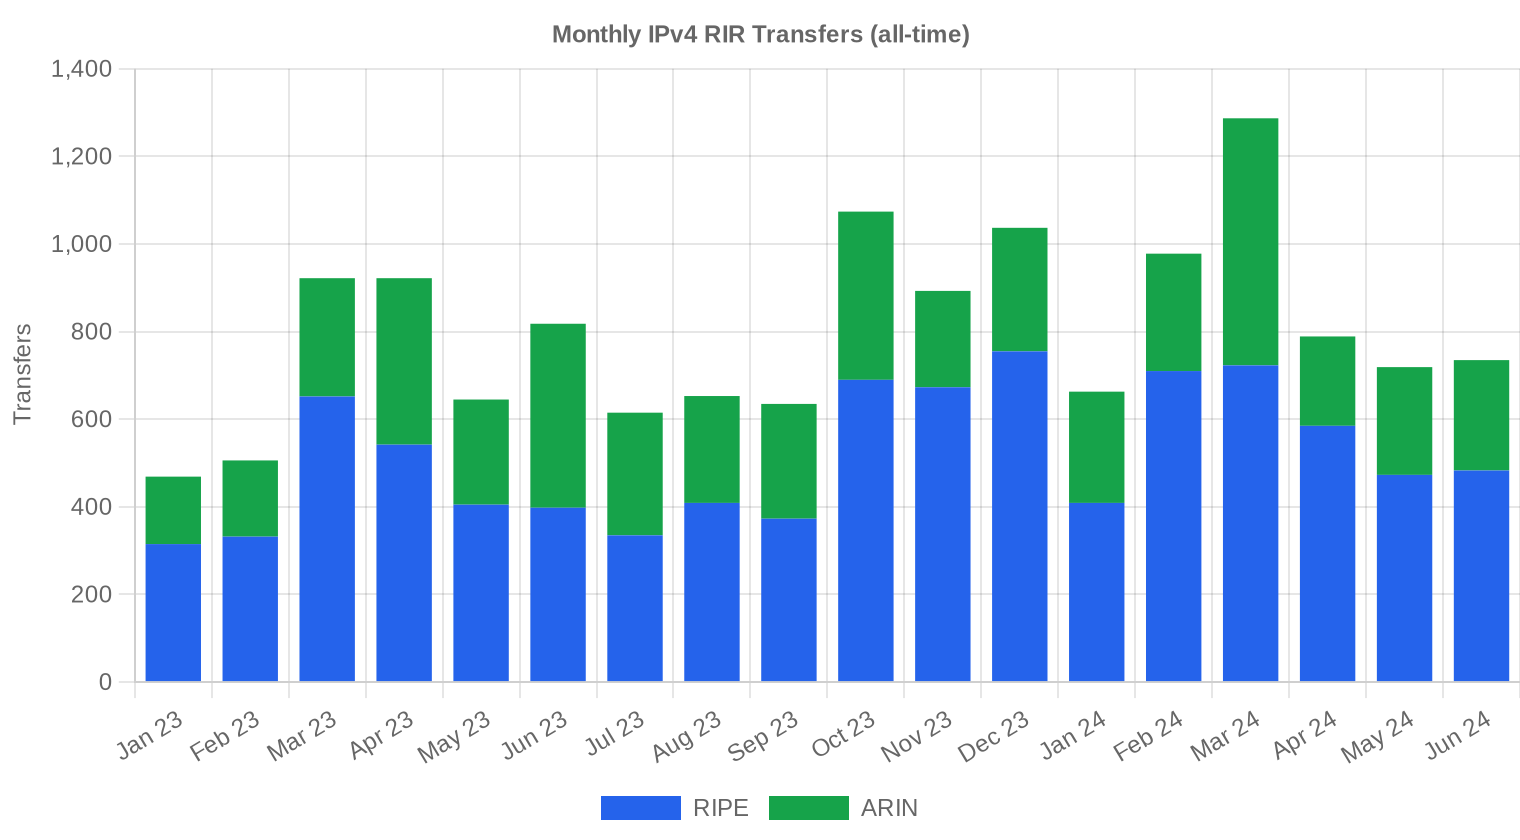
Official RIR transfer records logged 2,243 inter-party transfers in Q2 2024. RIPE accounted for 1,541 of those — 68.7% of the total — a figure that includes intra-RIR reorganizations and mergers alongside market transactions. ARIN contributed 702 transfers, with APNIC, LACNIC, and AFRINIC registering none in the official transfer logs this quarter.Long-Run Transfer Trends
Over the trailing 18-month window, cumulative RIR-recorded transfers reached 14,360. The peak month was March 2024, which likely reflects end-of-Q1 deadline pressure and annual budget deployments flowing through. RIPE's 64.5% share of that 18-month total versus ARIN's 35.5% underscores the structural difference: RIPE's larger membership base and more permissive transfer framework generate substantially higher volumes, even as ARIN commands higher per-IP pricing.| RIR | RIR Transfers |
|---|---|
| RIPE | 9,262 |
| ARIN | 5,098 |
| RIR Transfers | 14,360 |
Outlook & Forecast
Forecasting each block-size band and RIR separately with our AI model:
The overall average price per IP is projected to reach $31.44 by December 2024, with a next-month estimate of $31.49 per IP.
- RIPE: projected at $32.50 per IP next month, trending toward $32.00 by December 2024.
- ARIN: projected at $33.00 per IP next month, trending toward $32.00 by December 2024.
- APNIC: projected at $29.00 per IP next month, trending toward $28.50 by December 2024.
- LACNIC: projected at $30.00 per IP next month, trending toward $29.00 by December 2024.
- AFRINIC: insufficient data for a reliable forecast.

Forecast by Block Size
| Block | Current $/IP | Next Month | Year-End | Confidence |
|---|---|---|---|---|
| /24 | $30.75 | $31.00 (+0.8%) | $30.00 (-2.4%) | medium |
| /23 | $32.50 | $32.00 (-1.5%) | $31.50 (-3.1%) | medium |
| /22 | $32.50 | $32.00 (-1.5%) | $33.00 (+1.5%) | medium |
| /21 | $30.00 | $30.00 (0.0%) | $29.50 (-1.7%) | low |
| /20 | $30.84 | $31.00 (+0.5%) | $32.00 (+3.8%) | low |
| /19 | $36.00 | $35.50 (-1.4%) | $36.00 (0.0%) | low |
| /18-/16 | $36.50 | $36.50 (0.0%) | $37.50 (+2.7%) | low |
| /15-up | $51.50 | $50.00 (-2.9%) | $52.00 (+1.0%) | low |
Editor's Take: Buy vs. Lease
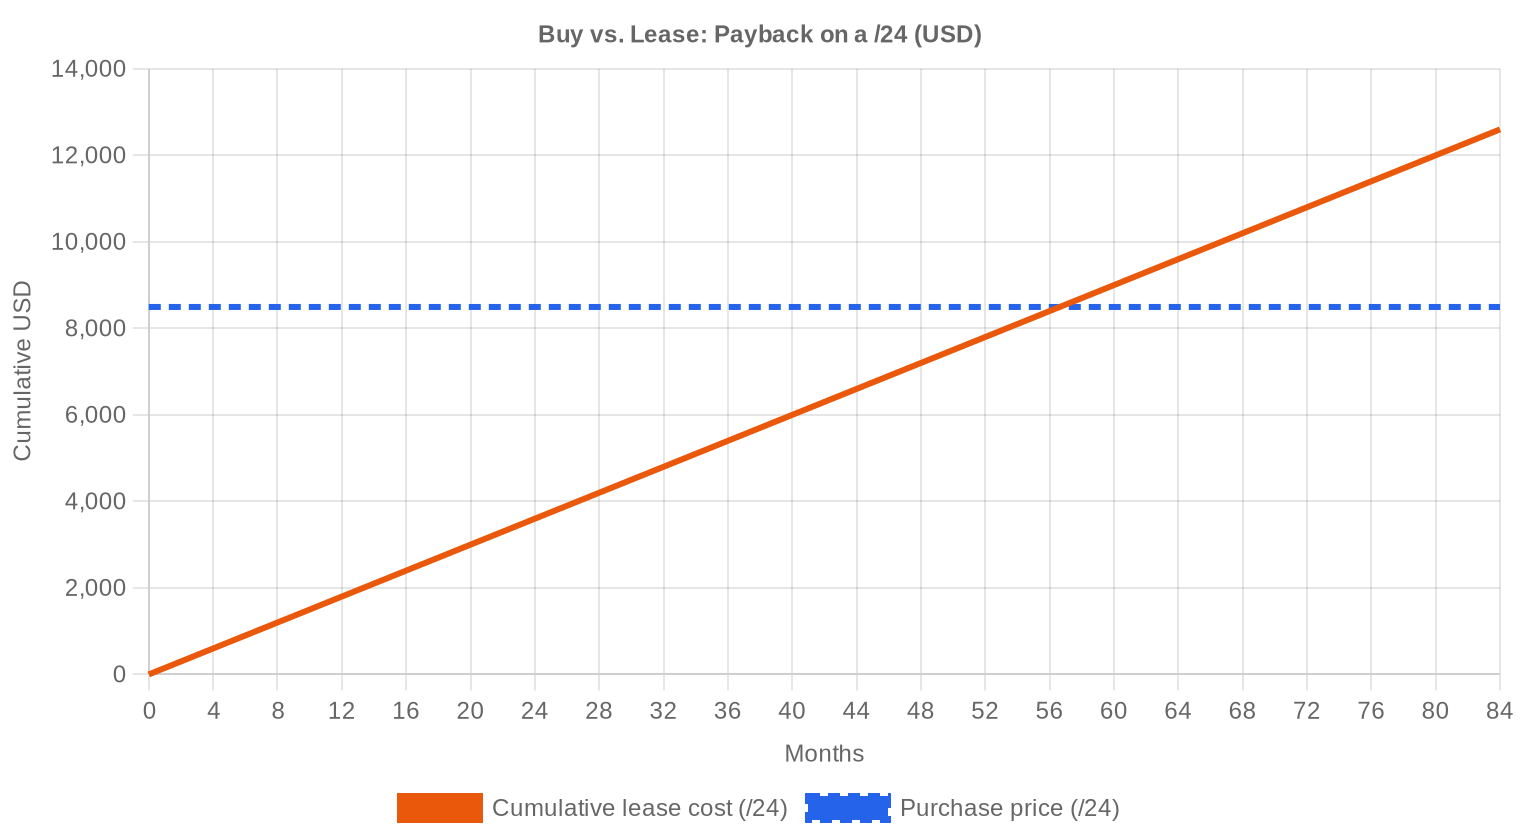
The buy-versus-lease math has shifted decisively toward buying this quarter. At $33.18 per IP and a lease rate of $0.5859 per IP per month, the breakeven payback period lands at 56.6 months — just under 4.7 years. That's inside our 90-month threshold by a wide margin. Stated differently, an acquirer who buys a /24 at $8,494 instead of leasing it at $150 per month recoups the purchase price before the five-year mark while retaining the asset permanently. The implied annual yield on leasing out purchased IPv4 sits at 21.2%, which is frankly extraordinary for a depreciating-price asset — it compensates holders generously even as the per-IP value trends lower. For organizations with a time horizon beyond five years and the ability to manage IP reputation, buying remains the clear call.| /24 Purchase price | $8,494 |
| /24 Lease price | $150 / mo |
| Payback period | 56.6 mo (4.7 yr) |
| Gross annual yield | 21.2% |
What This Means for You
Buyers: You're operating in a buyer's market. Prices are down 13.8% year-over-year with the regression still pointing down, so urgency is low unless you need specific clean blocks from ARIN. If you're flexible on RIR, APNIC inventory at $32.02 represents the best value, and RIPE's tight spread means predictable pricing. The volume surge suggests more supply is arriving — use that to negotiate.Sellers: The 33.3% volume jump is encouraging — there are buyers in the market — but they're paying less than they did 12 months ago. If you're holding legacy ARIN blocks, your premium is intact at $34.82. RIPE and APNIC sellers need to be competitive in the low-$30s or risk sitting on inventory. Pricing blocks aggressively will clear faster in this volume environment.
Leasers: At $0.59 per IP per month, leasing remains viable for short-term needs under 4.7 years. If your deployment timeline is 18–36 months, leasing avoids capital commitment in a declining-price market. Beyond that window, you're overpaying.
Block Holders: The 21.2% implied annual yield from leasing out your blocks is the strongest argument for holding rather than selling. As long as lease demand stays firm — and the 44-sample dataset suggests it is — monetizing through leasing while retaining the asset makes financial sense, especially if you believe prices will stabilize in the low-$30s by late 2024.
Browse verified IPv4 blocksSell IPv4 →
List your blocks with managed transferLease IPv4 →
Flexible short-term capacityLease Out IPv4 →
Turn idle blocks into recurring revenue
IPv4 Pricing by Block Size
The /24 segment remains the most actively traded prefix, with 67 of 196 deals at that size. Per-IP premiums on /24s can run 15–25% above the market average due to the convenience factor and minimum-viable-block dynamic — buyers need at least a /24 for independent BGP announcements. Larger blocks (/20 and above) trade closer to or below the median, reflecting volume discounts. The single deal exceeding $1 million this quarter — valued at $1.087 million — was likely a /16 or equivalent, where per-IP pricing compresses toward the floor.| Block | IPs | Buy: /IP | Buy: Total | Lease: /IP/mo | Lease: Monthly |
|---|---|---|---|---|---|
| /24 | 256 | $35–45 | $8,960–11,520 | $0.38–0.50 | $97–128 |
| /22 | 1,024 | $28–38 | $28,672–38,912 | $0.33–0.45 | $338–461 |
| /20 | 4,096 | $22–32 | $90,112–131,072 | $0.30–0.40 | $1,229–1,638 |
| /18 | 16,384 | $20–30 | $327,680–491,520 | $0.30–0.38 | $4,915–6,226 |
| /16 | 65,536 | $18–28 | $1,179,648–1,835,008 | $0.30–0.35 | $19,661–22,938 |
IPv4 Price History: 2011–2026
IPv4 addresses traded below $10 per IP as recently as 2015, four years after IANA's free pool exhausted in 2011. The market climbed steadily through the late 2010s, peaking in the mid-$50s during 2022–2023 as pandemic-era digitization and cloud migration strained availability. AWS's introduction of public IPv4 charges in early 2024 added a structural tailwind for alternatives but also validated the asset class. The 13.8% year-over-year price decline we're now seeing represents the first sustained correction since the market's inception — healthy, in our view, and consistent with a market transitioning from scarcity panic to rational pricing.| Year | ~Price/IP | Key Event |
|---|---|---|
| 2011 | $7–12 | IANA free pool exhausted; Microsoft/Nortel deal ($11.25/IP) |
| 2012 | $8–12 | RIPE NCC reaches last /8; begins /22-only allocation |
| 2014 | $10–15 | LACNIC free pool exhausted |
| 2015 | $8–15 | ARIN free pool exhausted |
| 2017–18 | $12–18 | Leasing market grows; cloud demand rises |
| 2019 | $18–24 | RIPE NCC exhausts remaining free pool |
| 2021–22 | $50–60+ | Post-pandemic peak; hyperscaler build-outs |
| 2024 | $35–52 | AWS IPv4 charge ($0.005/IP/hr); large block correction |
| 2025–26 | $18–45 | Market bifurcation; /16s below $20 for first time since 2019 |
Market Structure: Who Is Buying & Selling
The buy side is dominated by mid-tier cloud providers, regional ISPs expanding fixed-wireless deployments, and enterprises requiring clean address space for outbound mail and application hosting. Hyperscalers are less active in the open market, having locked in large blocks years ago. On the sell side, legacy holders — universities, government agencies, and corporations that received allocations in the 1990s — continue to monetize unused space, while bankruptcy and M&A activity generates occasional large-block supply.IPv4 vs. Other Asset Classes
At a 21.2% implied annual yield from leasing, IPv4 addresses outperform most traditional asset classes on a current-income basis. Ten-year Treasuries yield roughly 4.3%, and even high-yield REITs rarely exceed 8–10%. The catch is that IPv4 is a wasting asset class — prices are declining, and the terminal value may approach zero over a multi-decade horizon as IPv6 adoption eventually marginalizes the protocol. For now, the carry is compelling enough to justify the depreciation risk for investors with a 5–10 year horizon.| Asset Class | Typical Yield | Liquidity | Primary Risk |
|---|---|---|---|
| IPv4 | 21.2% | Moderate | IPv6 adoption, block quality |
| Commercial Real Estate | 5–8% | Low | Vacancy, rate cycle |
| Investment-Grade Bonds | 4–5% | High | Duration, credit risk |
| S&P 500 | ~1,3% | High | Market volatility |
| Money Market / T-Bills | ~4–5% | High | Rate cycle changes |
IPv6 Adoption & Why IPv4 Remains Essential
Global IPv6 capability continues to expand — Google reports roughly 45% of traffic reaching its services over v6 — but the tail of v4-only infrastructure is long and thick. Enterprise applications, legacy systems, and entire national networks in developing markets remain firmly v4-dependent. Coexistence isn't a temporary phase; it's the structural reality for the remainder of this decade at minimum, which underpins the floor beneath IPv4 pricing.AI & Cloud Infrastructure Demand
The AI infrastructure buildout is a net positive for IPv4 demand, though less directly than some market participants assume. Large training clusters are typically deployed in private address space behind NAT, but the inference and API-serving layer requires publicly routable addresses — every new AI endpoint needs reachable IPs. Hosting providers and cloud-adjacent firms spinning up GPU farms have been a visible demand source this quarter, contributing to the 33.3% volume surge even as they negotiate aggressively on price.What Determines IPv4 Block Value
Block valuation varies dramatically based on factors invisible in raw pricing data. A /24 with zero blacklist entries, a 10+ year allocation history, and no Spamhaus records can command $40–50 per IP, while a recently transferred block with active abuse complaints might struggle to clear $28. RIR matters too — ARIN's legal clarity and familiar transfer process commands a $2–3 premium over RIPE, and certain APNIC blocks face restrictions in specific jurisdictions. Buyers should always run blacklist checks, verify WHOIS history, and confirm transfer eligibility before agreeing to terms.Sell vs. Lease: A Decision Framework
In a declining-price environment, the calculus tilts toward selling if you expect prices to continue dropping and you don't want the overhead of lease management, reputation monitoring, and client support. If you believe the low-$30s represents a near-term floor — and our models suggest it does — leasing at $0.59 per IP per month generates 21.2% annually on your asset while preserving optionality to sell later. For holders with clean blocks and the operational capacity to manage tenants, leasing is the superior strategy in the current market.| /24 Purchase price | $8,494 |
| /24 Lease price | $150 / mo |
| Payback period | 56.6 mo (4.7 yr) |
| Gross annual yield | 21.2% |
RIPE NCC 24-Month Transfer Restriction
RIPE NCC's 24-month holding requirement before a block can be re-transferred constrains the velocity of speculative flipping within the European registry. This rule effectively locks acquired blocks for two years, reducing short-term supply and creating a mild artificial floor under RIPE pricing. It also explains why RIPE's min-max range ($29–$36.50) is tighter than ARIN's ($26–$50) — speculative premium gets squeezed out when buyers know they can't quickly resell.Deal Size Distribution
Average deal size rose to $67,775 this quarter, up 16.8% from Q1's $58,021 and 11.8% above Q2 2023's $60,602. The distribution remains bottom-heavy: 123 deals (62.8%) fell below $50,000 in value, accounting for just $2.1 million — 16% of total volume. The 61 mid-range deals ($50K–$250K) generated $6.6 million, making that tier the market's revenue engine. Eleven transactions landed in the $250K–$1M band at $3.3 million total, and one deal crossed $1 million. The skew confirms that IPv4 remains a retail-heavy market punctuated by occasional institutional-scale trades.Top Trading Countries
Country-level transaction data wasn't available for Q2. Based on RIR distribution, the United States, Canada, and Western Europe are the primary demand markets, with growing activity across APNIC jurisdictions — particularly Australia, India, and Southeast Asian economies where mobile and fixed-broadband build-outs continue to consume v4 space at pace.BEAD Broadband Program Impact
The $42.45 billion BEAD program is still in its early deployment phase, with most state-level subgrantee selections expected through late 2024 and into 2025. As rural ISPs and fixed-wireless operators begin network construction, their demand for /22 through /20 blocks will intensify — these are the mid-sized allocations that already trade at a premium due to their practical utility. We expect BEAD-driven demand to provide meaningful price support in the /20–/22 range starting mid-2025, partially offsetting the broader downward trend in per-IP pricing.Hyperscaler IPv4 Holdings
Amazon, Microsoft, and Google collectively control an estimated 100+ million IPv4 addresses, acquired over the past decade at prices well below current market levels. Their strategies differ: AWS monetizes through its $3.60/month per-IP public address charge (roughly $43/year), effectively earning a carry on the asset. Microsoft and Google hold primarily for internal use. None are selling in meaningful quantities, which removes what would be the largest potential supply shock from the market. As long as hyperscalers treat IPv4 as a strategic asset rather than surplus inventory, the supply side remains constrained at the institutional level.Macroeconomic Conditions & Market Impact
The Fed held rates steady through Q2, with the 10-year hovering around 4.3%. Higher-for-longer rates compress enterprise IT capex budgets, which should theoretically reduce IPv4 demand — but the 33.3% volume surge suggests that operational necessity is overriding cost sensitivity. Enterprises that need addresses for deployment still need them, rate environment be damned. The more relevant macro signal is the continued resilience of cloud and hosting sector spending, which keeps the buyer pipeline active even as per-unit pricing erodes.Model Update & Calibration
As part of our continuous improvement process, we backtested previous forecasts against realised prices and fine-tuned the model accordingly. Recent months now carry more influence than older data, and the confidence bands have been widened or narrowed based on how well they captured actual outcomes in the past. You can see the full backtest results in the table and chart below.
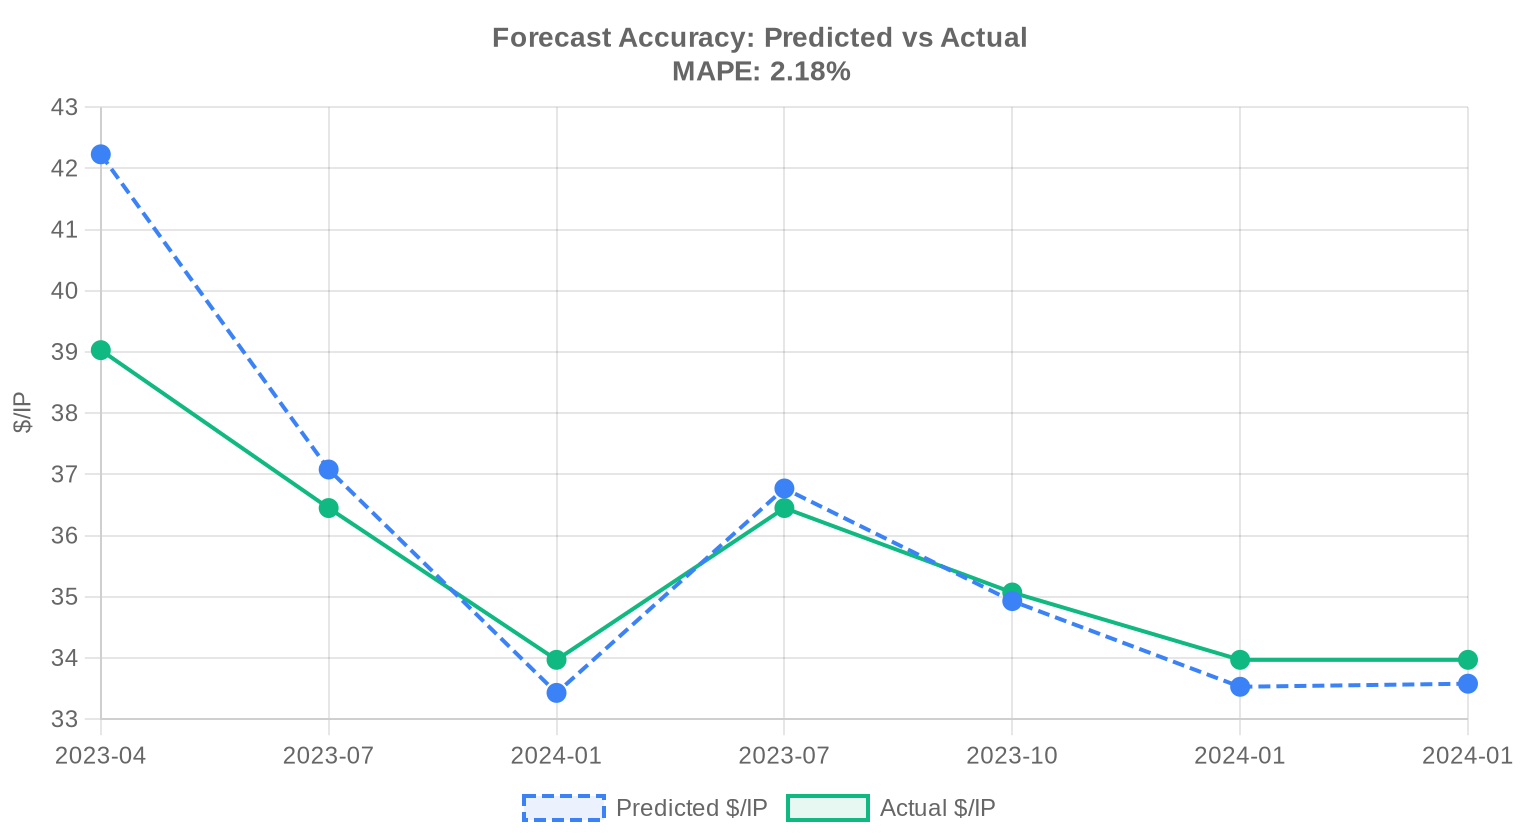
| Report Period | Target Month | Predicted | Actual | Deviation |
|---|---|---|---|---|
| 2023-H1 | 2023-07 | $37 | $36 | +2% |
| 2023 | 2024-01 | $33 | $34 | -2% |
| 2023-Q2 | 2023-07 | $37 | $36 | +1% |
| 2023-Q3 | 2023-10 | $35 | $35 | 0% |
| 2023-H2 | 2024-01 | $34 | $34 | -1% |
| 2023-Q4 | 2024-01 | $34 | $34 | -1% |
Methodology
Figures are based on completed IPv4Center marketplace transactions and RIR transfer statistics. Prices are in US dollars per IP address. Forecasts are produced by an AI model that analyses each block-size band and RIR segment separately (with outlier-trimmed medians) alongside known market catalysts; they are estimates, not guarantees.
Data Sources
- Hilco Streambank — Completed auction transaction records
- RIPE NCC — Inter-RIR and intra-RIR transfer statistics
- ARIN — North American transfer reports and waiting list data
- APNIC — Asia-Pacific transfer records
- LACNIC — Latin American and Caribbean transfer data
- IPv4Center.com — Proprietary marketplace transaction and lease pricing data
This report is generated automatically for informational purposes only and does not constitute financial advice.
Frequently Asked Questions
What was the average price per IPv4 address in Q2 2024?
The global weighted average landed at .18 per address, with a median of .50. The spread between average and median remains tight, suggesting a market that is consolidating around a narrow pricing band rather than being skewed by outlier trades.
How many IPv4 transfer transactions closed in Q2 2024?
We tracked 196 priced transactions covering 393,984 addresses for an aggregate market value of approximately .3 million. The broader transfer ecosystem — including intra-company and no-consideration moves — logged 2,243 total transfers across all RIRs.
Which RIR commanded the highest per-IP pricing in Q2 2024, and why?
ARIN blocks traded at a .82 average — a .47-per-IP premium over RIPE (.35) and a .80 premium over APNIC (.02). The ARIN premium reflects deeper compliance infrastructure, broader U.S. enterprise demand, and a policy framework buyers view as the gold standard for clean title.
ARIN's top deal hit per IP. What drove that outlier?
The ceiling on ARIN transactions — versus at APNIC and .50 at RIPE — almost certainly reflects a small, clean /24 or boutique block with impeccable WHOIS history and immediate routability. Buyers pay a scarcity premium for blocks that require zero remediation.
APNIC handled the most total IPs traded. Does that make it the most liquid RIR?
APNIC accounted for 136,704 addresses across 58 transactions — the highest IP volume — yet recorded zero formal inter-RIR transfers in the period. Liquidity here is concentrated in larger block sizes (average deal ~2,357 IPs) and driven by hyperscale and carrier demand in the Asia-Pacific region. RIPE, by contrast, led in raw transfer count at 1,541.
Is the IPv4 market trending up or down heading into H2 2024?
Down, albeit gently. Prices declined approximately 0.29% over the quarter. Our model projects the global average drifting to roughly .49 next month and .44 by December 2024. This is an orderly repricing, not a rout.
What was the most commonly traded prefix size in Q2 2024?
The /24 dominated with 67 transactions — roughly one-third of all deals. This remains the atomic unit of the IPv4 market: the smallest block that is universally routable and the entry-level purchase for SMBs and SaaS operators.
At current lease rates, does it still make sense to buy rather than lease?
Yes, decisively. At .5859 per IP per month on the lease side versus a .18 purchase price, the buy-versus-lease breakeven is 56.6 months — roughly 4.7 years. Any buyer with a planning horizon beyond five years captures significant savings by purchasing outright. The implied annual yield for lessors sits at 21.2%, which tells you exactly how expensive leasing is for the tenant.
What is the current monthly lease rate for a /24 block?
Based on a 44-observation sample, a /24 leases for approximately 0 per month, or about .59 per IP. Lease data this quarter is concentrated in the RIPE region; ARIN and APNIC lease pricing remains opaque due to thinner sample sets.
How does the RIPE transfer market compare to ARIN by volume and price?
RIPE recorded 62 priced transactions (122,624 IPs) at a .35 average; ARIN logged 74 deals (125,440 IPs) at .82. On IP count, they are nearly identical. But RIPE's formal transfer pipeline — 1,541 recorded transfers — dwarfs ARIN's 702, reflecting RIPE's more streamlined and permissive inter-organizational transfer policy.
What role did LACNIC and AFRINIC play in Q2 2024?
Marginal. LACNIC contributed exactly two transactions covering 9,216 IPs at a flat .00 average. AFRINIC recorded zero priced transactions and zero transfers. Neither region moves the needle on global pricing or liquidity.
What was the typical deal size in dollar terms?
The average deal value was roughly ,775. But the distribution is heavily right-skewed: 123 transactions (63% of all deals) closed below ,000, while a single transaction exceeded million at approximately .09 million. The fat middle — 61 deals in the K–0K band — accounted for nearly half of total market value at .6 million.
What mistakes should buyers avoid in the current pricing environment?
Three common errors: overpaying for ARIN blocks when equivalent APNIC or RIPE space trades –3 cheaper per IP, neglecting WHOIS and blacklist due diligence on sub- blocks (that discount exists for a reason), and locking into multi-year leases when the buy-side breakeven is under five years. In a gently declining market, urgency is not your friend.
What are the risks of buying IPv4 addresses at per IP given the downward price trend?
The forecast suggests prices sliding to ~.44 by year-end — a potential 5.2% erosion from the Q2 average. Buyers purchasing large blocks face mark-to-market risk if they need to resell within 12–18 months. That said, for operational buyers consuming the addresses, the carrying cost of waiting (especially if leasing in the interim at 21% implied yield) typically exceeds the price decline.
Is IPv6 adoption finally killing IPv4 demand?
Not yet, and the obituary has been premature for a decade. The 196 transactions and nearly 400,000 IPs traded in a single quarter demonstrate persistent operational demand. IPv6 is gradually reducing the growth rate of IPv4 consumption — which is why prices are softening — but full displacement remains years away. The .3 million in quarterly volume says this market is alive and transacting.
What are the risks of leasing IPv4 space at current rates?
At .59 per IP per month, you are paying an implied 21.2% annual yield to the lessor. Over five years a leased /24 costs ,000 versus a purchase price of ~,494. Beyond the economics, lessees face re-pricing risk at renewal, potential service disruption if the lessor sells the block, and limited ability to build IP reputation on space they do not own.
How long does a typical IPv4 transfer take to complete?
Timeline varies by RIR. ARIN transfers generally close in 4–8 weeks given organizational validation and needs-assessment requirements. RIPE transfers can complete in 2–4 weeks under their lighter-touch policy. APNIC sits somewhere in between. Buyers should factor these lead times into infrastructure planning and not assume same-quarter delivery on large blocks.
Why did RIPE lead all RIRs in total recorded transfers at 1,541?
RIPE's transfer policy is the most permissive among the five RIRs — no demonstrated-need requirement, straightforward documentation, and a well-oiled registry system. This attracts speculative inventory management, corporate restructuring moves, and a large European broker ecosystem. ARIN's 702 transfers reflect a tighter policy that demands justified need.
Should sellers wait for a price recovery before liquidating IPv4 holdings?
The data argues against that strategy. With a forecast pointing to .44 by December 2024 and a gentle but persistent downward trend, waiting introduces depreciation risk. Sellers sitting on large inventories should consider phased liquidation — capturing today's + average on partial blocks while retaining optionality on the remainder.
What does the deal-size distribution tell us about market participants?
The 123 sub-K deals (63% of volume) signal a broad base of SMBs, hosting companies, and SaaS operators buying /24s and small /23s for operational use. The 11 transactions in the 0K–M band and one deal above M point to carriers, CDNs, or cloud providers accumulating at scale. This is a healthy, two-tier market with both retail and institutional demand.
What is the cheapest RIR to source IPv4 space from in Q2 2024?
APNIC, at a .02 average and floor price. However, APNIC blocks carry routing considerations for buyers outside Asia-Pacific, and transfer policies vary. RIPE is the next cheapest at .35 with superior liquidity. Savings of –3 per IP on APNIC or RIPE versus ARIN can be material on large blocks — a 10,000-IP purchase saves ,000–,000.
How reliable is the year-end price forecast of .44?
We flag this forecast as reliable based on the model's confidence interval and the orderly nature of the current decline. The 0.29% quarterly drop and stable transaction volumes suggest no structural dislocation is underway — just a mature market gradually repricing as IPv6 nibbles at marginal demand. That said, a large-scale corporate divestiture or regulatory shift could introduce volatility the model does not capture.
What drove the -per-IP floor price, and should buyers target blocks in that range?
The minimum was recorded on an ARIN transaction and likely reflects a block with legacy registration issues, blacklist history, or a bulk purchase with negotiated volume discount. Buyers can find value at the low end, but must invest in due diligence — blacklist scrubbing, WHOIS cleanup, and routability testing. A discount versus the average is meaningless if the block is unroutable.
How does the Q2 2024 IPv4 market compare to broader IT asset markets?
IPv4 addresses remain one of the few digital assets with a hard supply cap, declining new issuance (effectively zero), and persistent demand — characteristics more akin to spectrum licenses than typical IT hardware. The 21.2% implied lease yield exceeds most infrastructure-as-a-service return profiles. At .3 million in quarterly volume, this is a niche but real institutional market.
What are the risks of sourcing IPv4 blocks from regions with zero recorded transfers, like AFRINIC?
AFRINIC recorded zero transactions and zero transfers in Q2 2024. The region's ongoing governance challenges, legal disputes, and policy uncertainty make it a minefield for buyers. Blocks originating from AFRINIC may face routability concerns and reputational risk. Until the registry stabilizes, sophisticated buyers are steering clear — and the data confirms it.