14 min read
This report analyzes the IPv4 transfer market for Q4 2023, based on completed IPv4Center marketplace transactions and official RIR transfer records.
Executive Summary
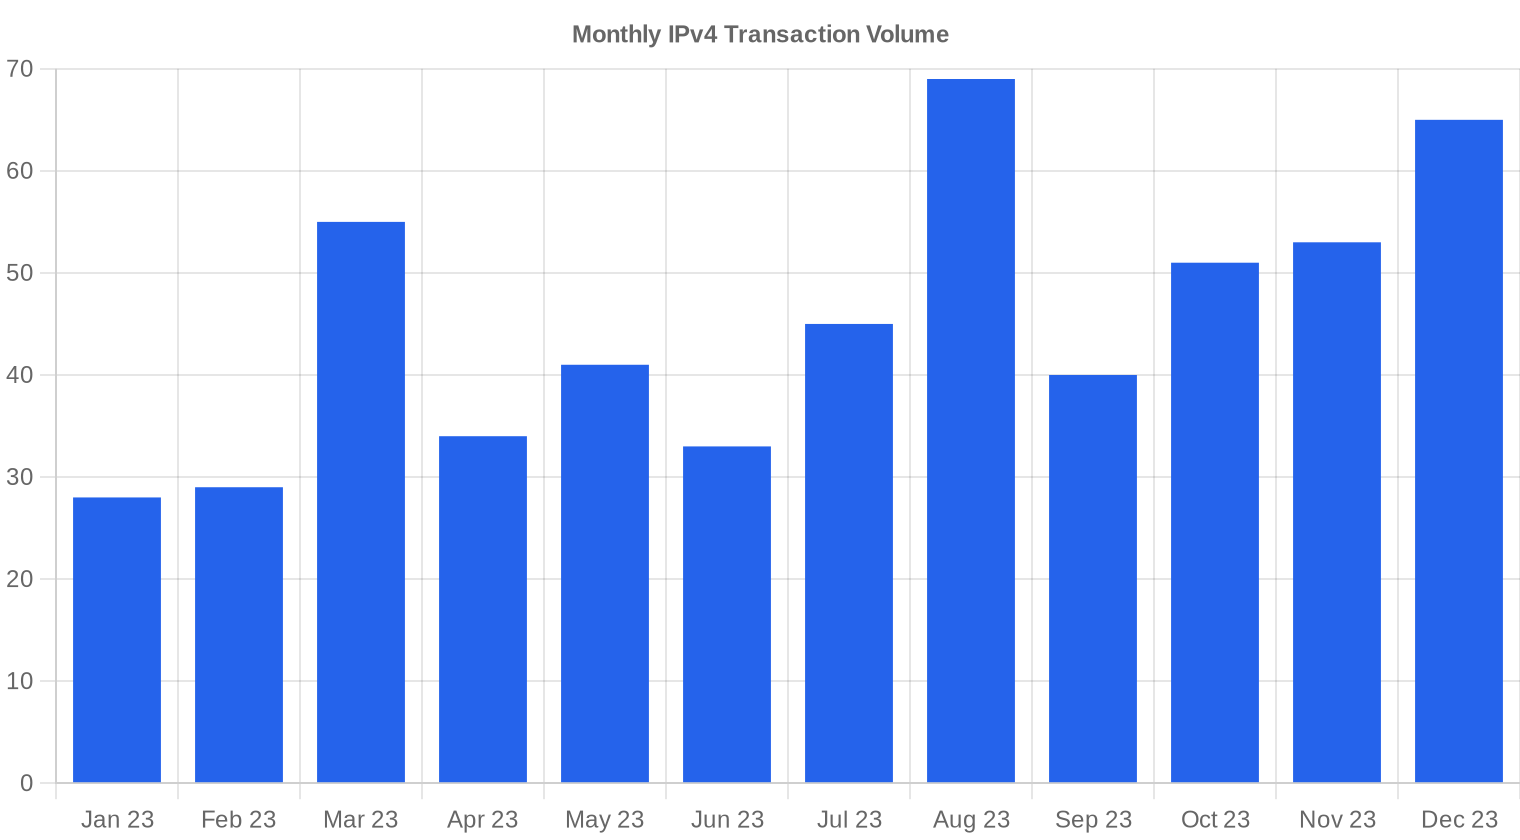
The IPv4 transfer market closed 2023 on a softer note. Average pricing fell 4.8% from Q3 2023 to $34.53 per address, with 169 transactions moving 588,288 IPs for a combined $22.6 million. Transaction count rose 9.7% versus Q3, so the market got busier even as prices slipped — a pattern consistent with buyers gaining leverage as more inventory cycled through. The median held at $34, tight against the average, which suggests the decline wasn't driven by a few distressed sales but by broad-based price softening. The trend line points down, with pricing off 1.74% on a regression basis across the quarter.Market Overview
| Transactions | 169 |
| IP Addresses Traded | 588,288 |
| Estimated Market Value | $22,570,033 |
| Average Price / IP | $34.53 |
| Median Price / IP | $34.00 |
| RIR Transfers | 3,004 |
Price Dynamics
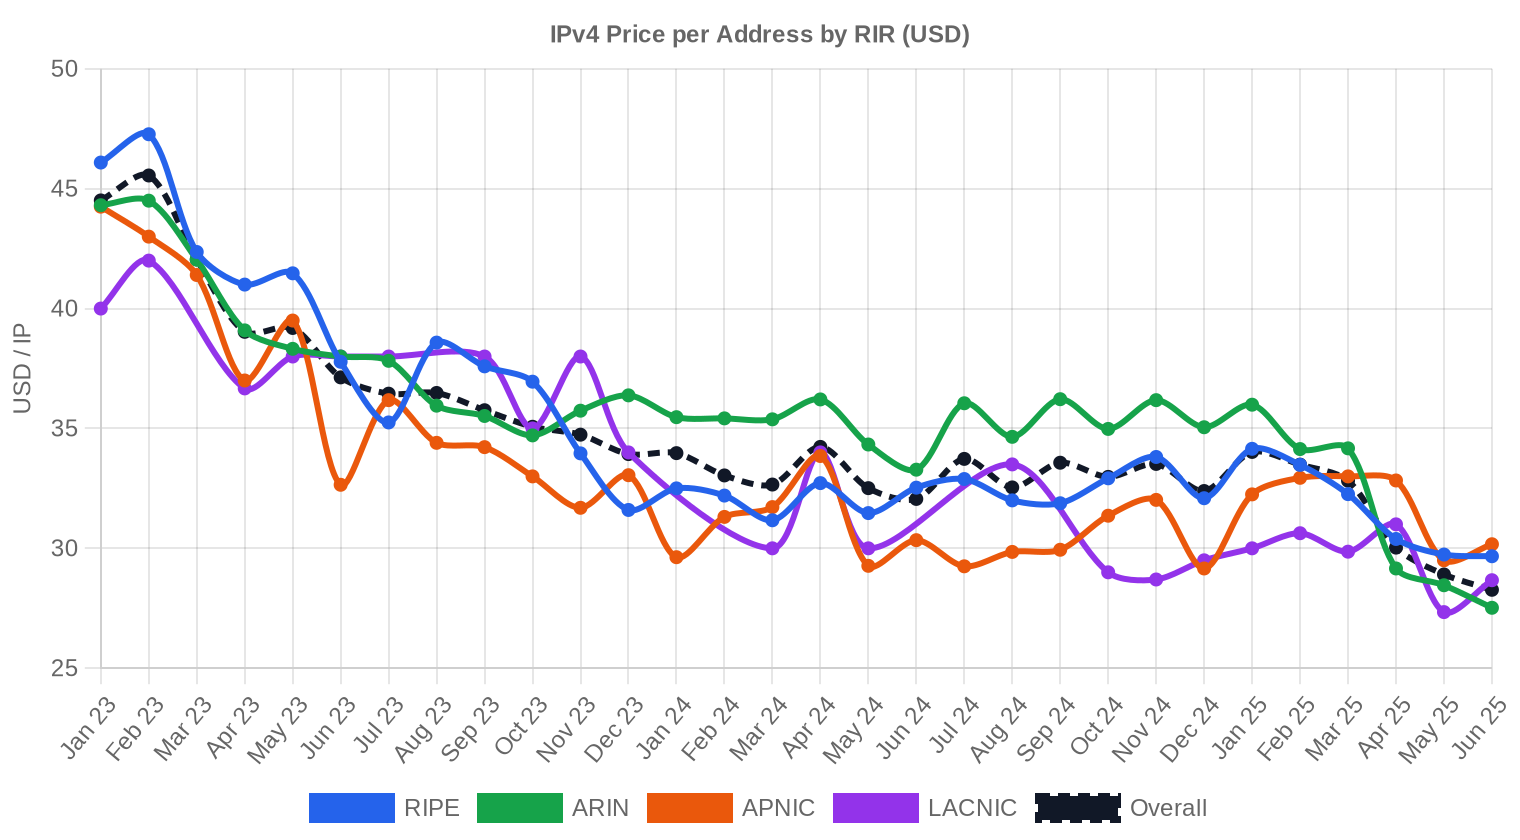
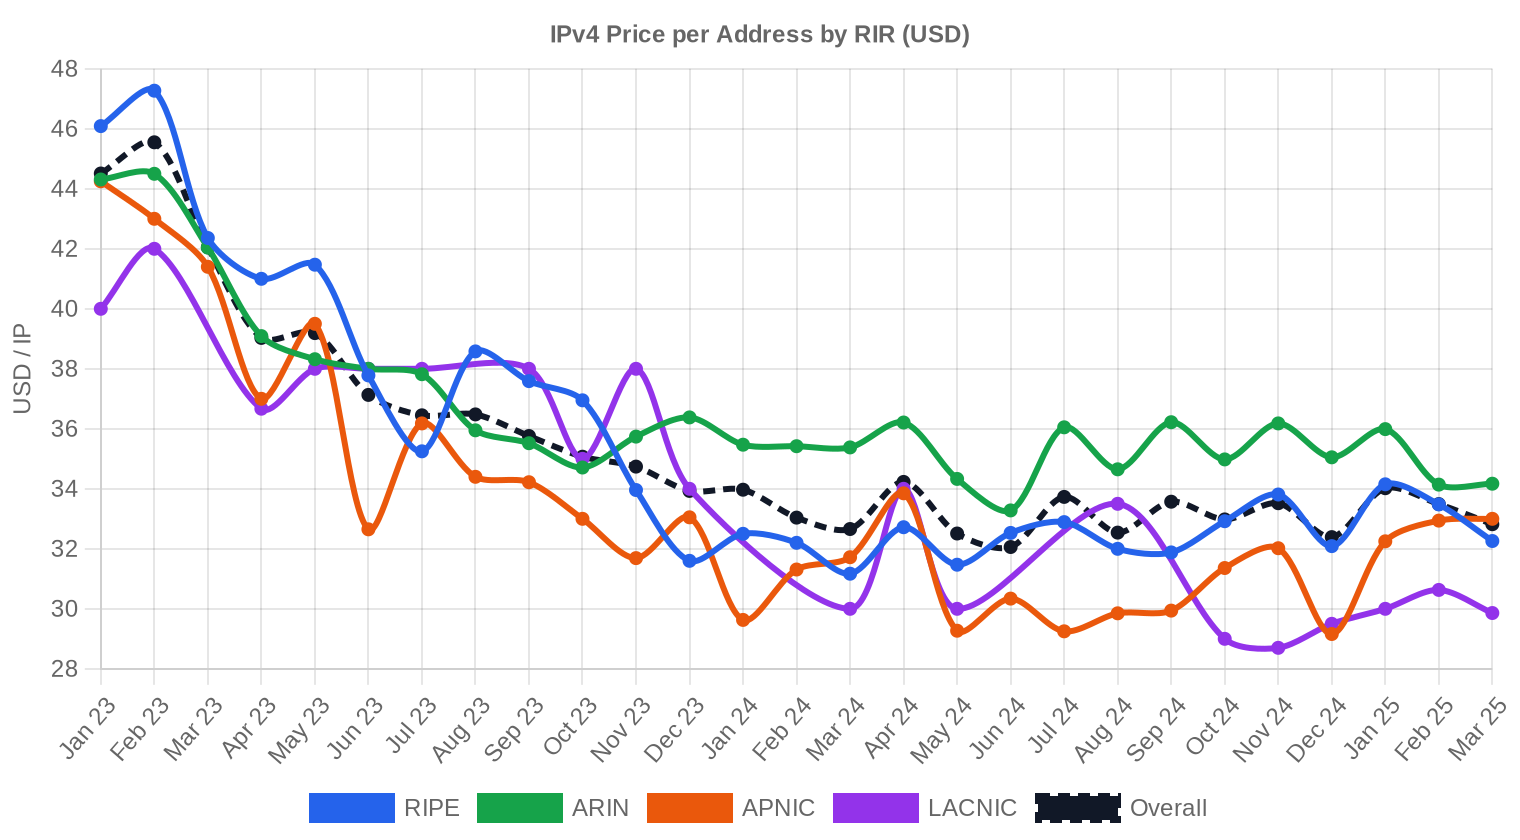
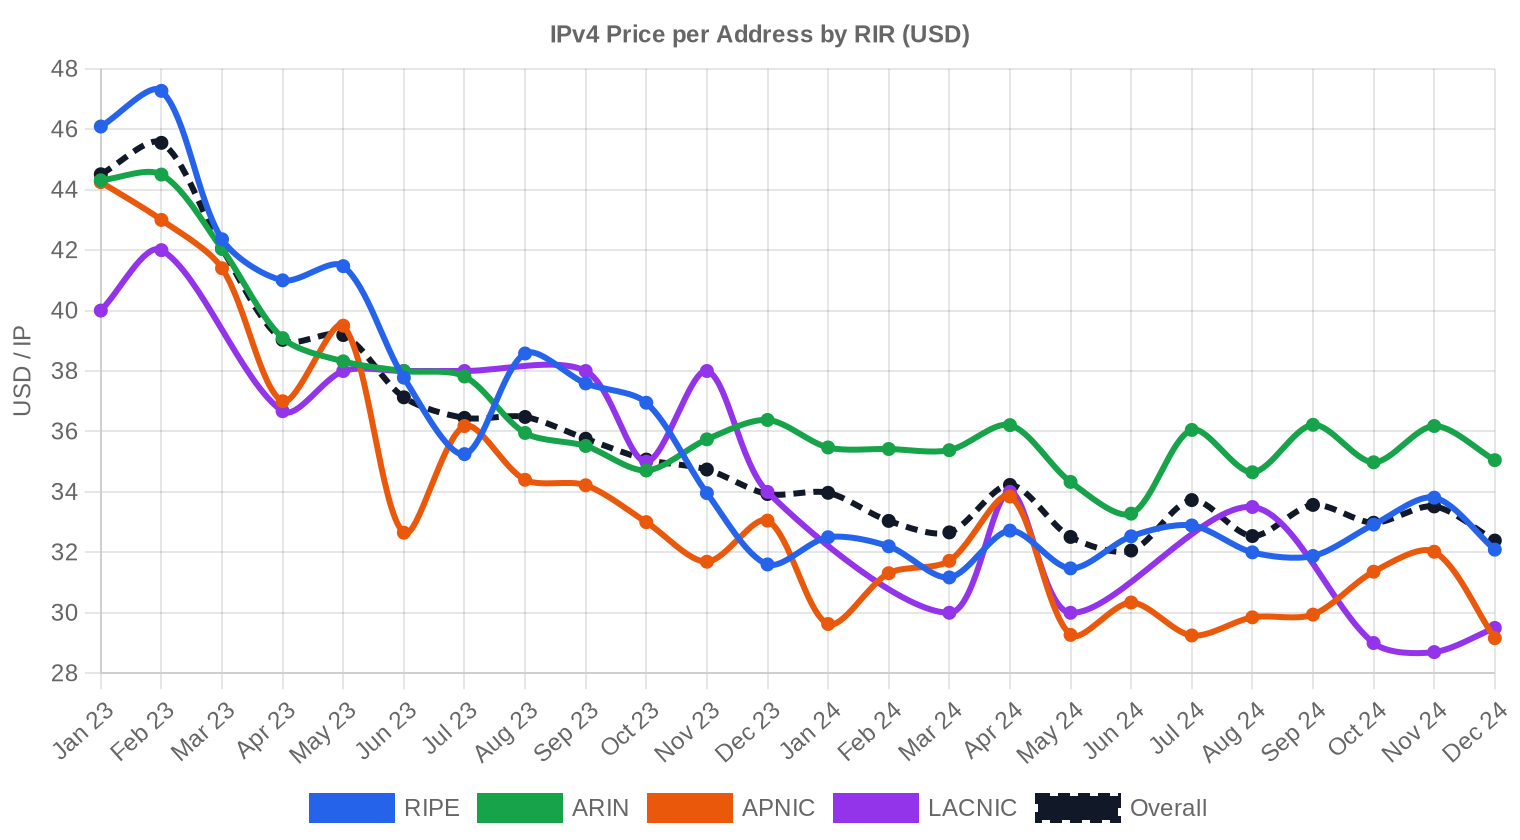
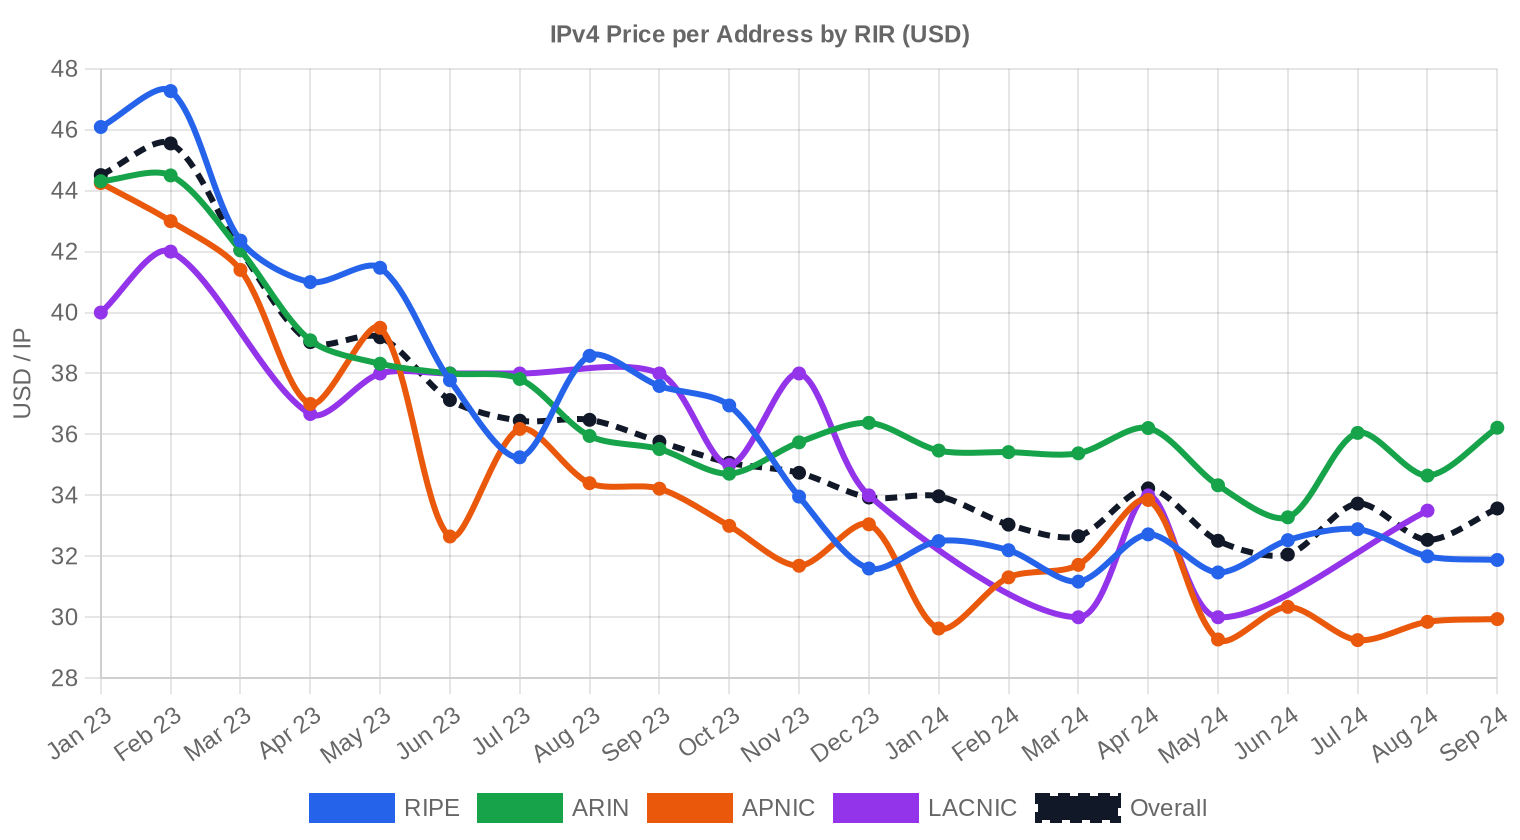
The full-quarter range ran from $28 to $50 per IP, a $22 spread that reflects persistent segmentation between clean premium blocks and less desirable inventory. The floor at $28 appeared in RIPE transactions — likely smaller or lower-quality blocks changing hands quickly. The $50 ceiling hit in both ARIN and RIPE, probably attached to well-aged, blacklist-clean /16-range blocks with established reputation. The 4.8% decline from Q3's average tracks with what we've been seeing since mid-2023: the post-AWS-charge recalibration is still working through the market, and buyers are in no rush. With the regression trend pointing to $33.41 by December, the quarter ended almost exactly where the model predicted.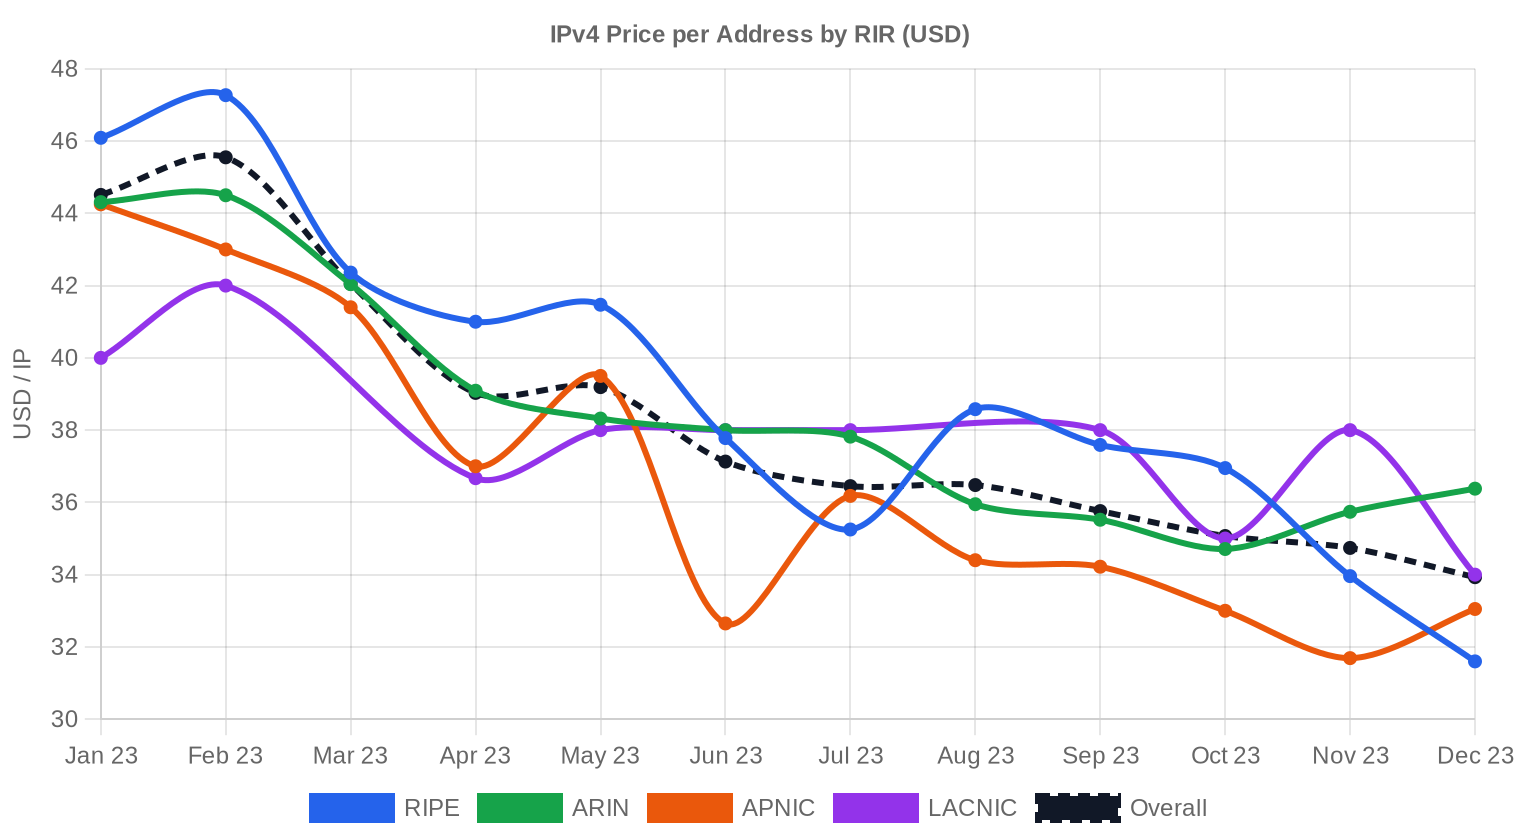
Pricing by RIR
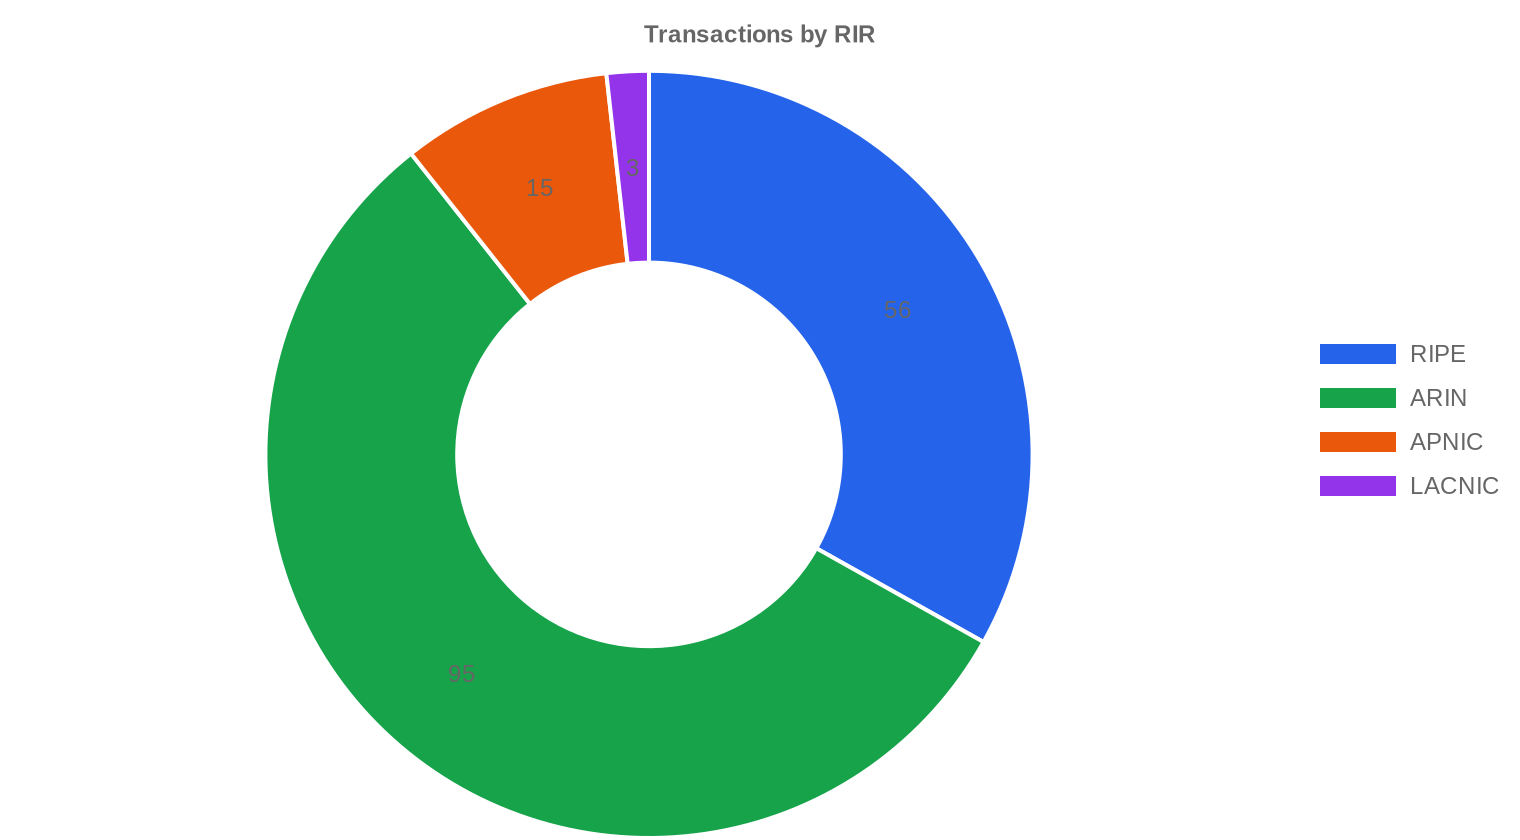
ARIN dominated deal flow with 56.2% of volume, and its pricing ran hot at $35.56 average — a $2.28 premium over RIPE's $33.28. That gap has been narrowing but hasn't closed. LACNIC posted the highest per-IP average at $35.67, though with only 3 transactions and 12,544 addresses, the sample is too thin to draw structural conclusions. APNIC came in cheapest at $32.40 across 15 deals — tight supply in the Asia-Pacific region hasn't translated into pricing power this quarter, possibly due to the region's more aggressive IPv6 rollouts dampening urgency. ARIN: $35.56/IP across 95 transactions (46.8% of IP volume). RIPE: $33.28/IP across 56 transactions (42.7% of IP volume). APNIC: $32.40/IP across 15 transactions (8.4% of IP volume). LACNIC: $35.67/IP across 3 transactions (2.1% of IP volume). AFRINIC: No recorded transactions.| RIR | Transactions | Avg $/IP | Median $/IP | IPs Traded | RIR Transfers | Next Month (proj.) | Year-End (proj.) |
|---|---|---|---|---|---|---|---|
| RIPE | 56 | $33.28 | $32.50 | 251,136 | 2,118 | $31.50 | $31.00 |
| ARIN | 95 | $35.56 | $34.50 | 275,200 | 886 | $34.50 | $35.00 |
| APNIC | 15 | $32.40 | $32.00 | 49,408 | 0 | $32.50 | $32.00 |
| LACNIC | 3 | $35.67 | $35.00 | 12,544 | 0 | $34.00 | $34.00 |
Transaction Volume
Supply & Block Sizes
The /24 remained the most-traded block size at 68 transactions — 40% of all deals. This is the standard unit of commerce for small enterprises and hosting operators who need a single routable block without the capital outlay of a larger prefix. Larger blocks drove the dollar volume: the 6 deals above $1 million accounted for $9.05 million, or 40% of total value, which means a handful of institutional-sized trades set the tone for the quarter's headline numbers.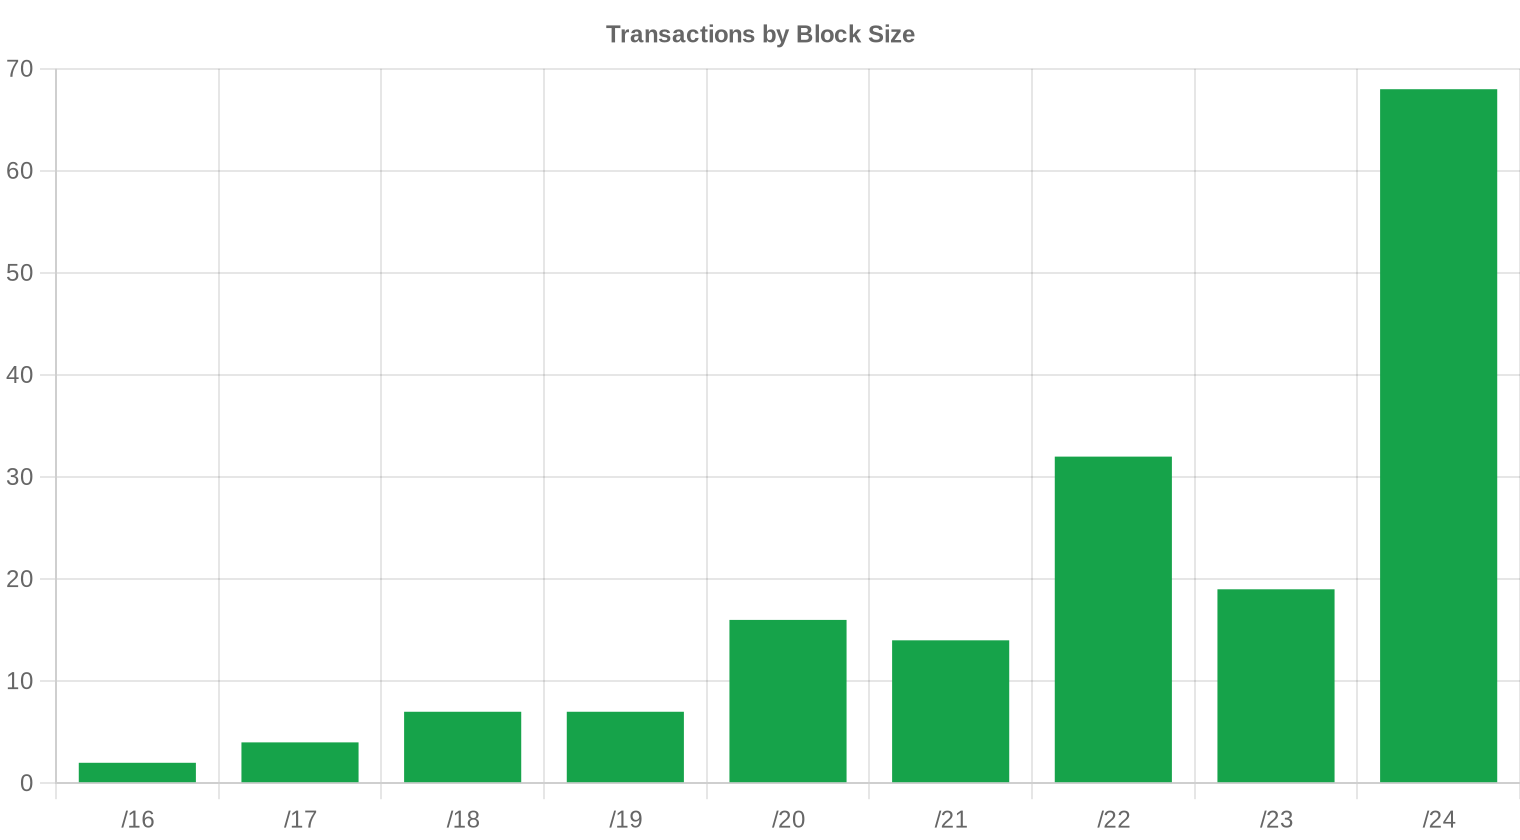
Geographic Activity
Country-level transaction data was not reported for Q4 2023. Based on RIR distribution, the North American and European markets accounted for the vast majority of activity, with ARIN and RIPE combining for 89.5% of IP volume traded. The APNIC region contributed a modest 8.4%, while Latin American activity was minimal.Registry Transfer Activity
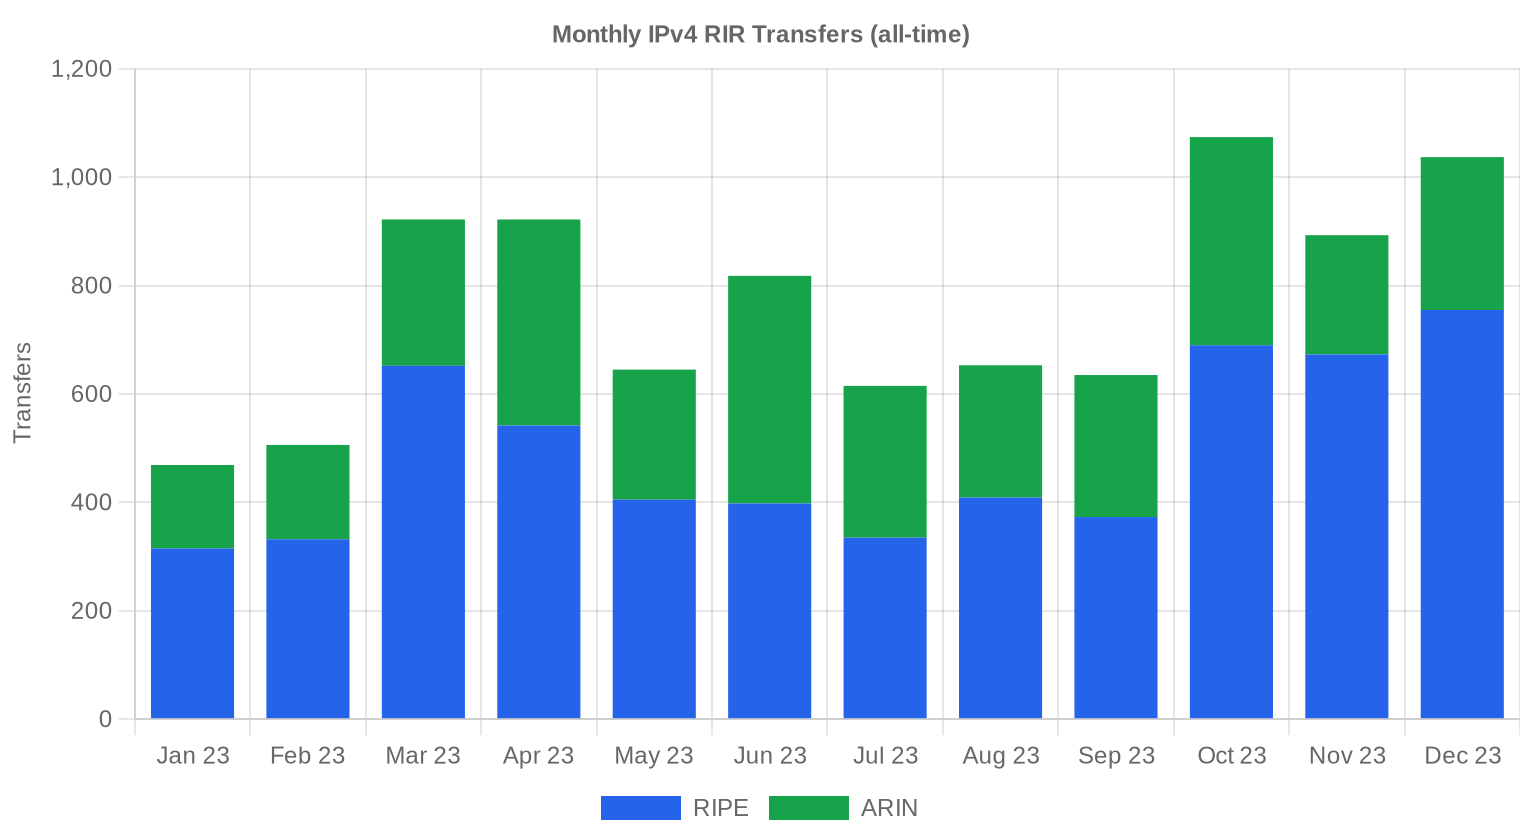
Official RIR transfer registries recorded 3,004 transfers in Q4 2023. RIPE led with 2,118 transfers — 70.5% of the total — reflecting both the registry's deep secondary market and its role as the clearing house for European and Central Asian reallocation. ARIN posted 886 transfers, roughly a third of the total, with no recorded transfers logged through APNIC, LACNIC, or AFRINIC systems during the period.Long-Run Transfer Trends
Over the trailing 12 months, 9,189 transfers were recorded across all RIRs. October 2023 was the peak month, suggesting a burst of activity ahead of year-end budget cycles and contract deadlines. RIPE accounted for 64% of the annual transfer total versus ARIN's 36% — a ratio that has been remarkably stable and reflects RIPE's more liquid and fragmented marketplace versus ARIN's fewer but typically larger block movements.| RIR | RIR Transfers |
|---|---|
| RIPE | 5,879 |
| ARIN | 3,310 |
| RIR Transfers | 9,189 |
Outlook & Forecast
Forecasting each block-size band and RIR separately with our AI model:
The overall average price per IP is projected to reach $33.41 by December 2023, with a next-month estimate of $33.58 per IP.
- RIPE: projected at $31.50 per IP next month, trending toward $31.00 by December 2023.
- ARIN: projected at $34.50 per IP next month, trending toward $35.00 by December 2023.
- APNIC: projected at $32.50 per IP next month, trending toward $32.00 by December 2023.
- LACNIC: projected at $34.00 per IP next month, trending toward $34.00 by December 2023.
- AFRINIC: insufficient data for a reliable forecast.

Forecast by Block Size
| Block | Current $/IP | Next Month | Year-End | Confidence |
|---|---|---|---|---|
| /24 | $34.00 | $34.00 (0.0%) | $33.00 (-2.9%) | medium |
| /23 | $32.50 | $32.50 (0.0%) | $32.00 (-1.5%) | medium |
| /22 | $33.00 | $33.00 (0.0%) | $33.00 (0.0%) | medium |
| /21 | $33.25 | $33.00 (-0.8%) | $33.00 (-0.8%) | low |
| /20 | $32.50 | $32.00 (-1.5%) | $34.00 (+4.6%) | medium |
| /19 | $34.50 | $34.00 (-1.4%) | $35.00 (+1.4%) | low |
| /18-/16 | $37.50 | $37.00 (-1.3%) | $38.00 (+1.3%) | low |
| /15-up | $51.50 | $51.00 (-1.0%) | $52.00 (+1.0%) | low |
Editor's Take: Buy vs. Lease
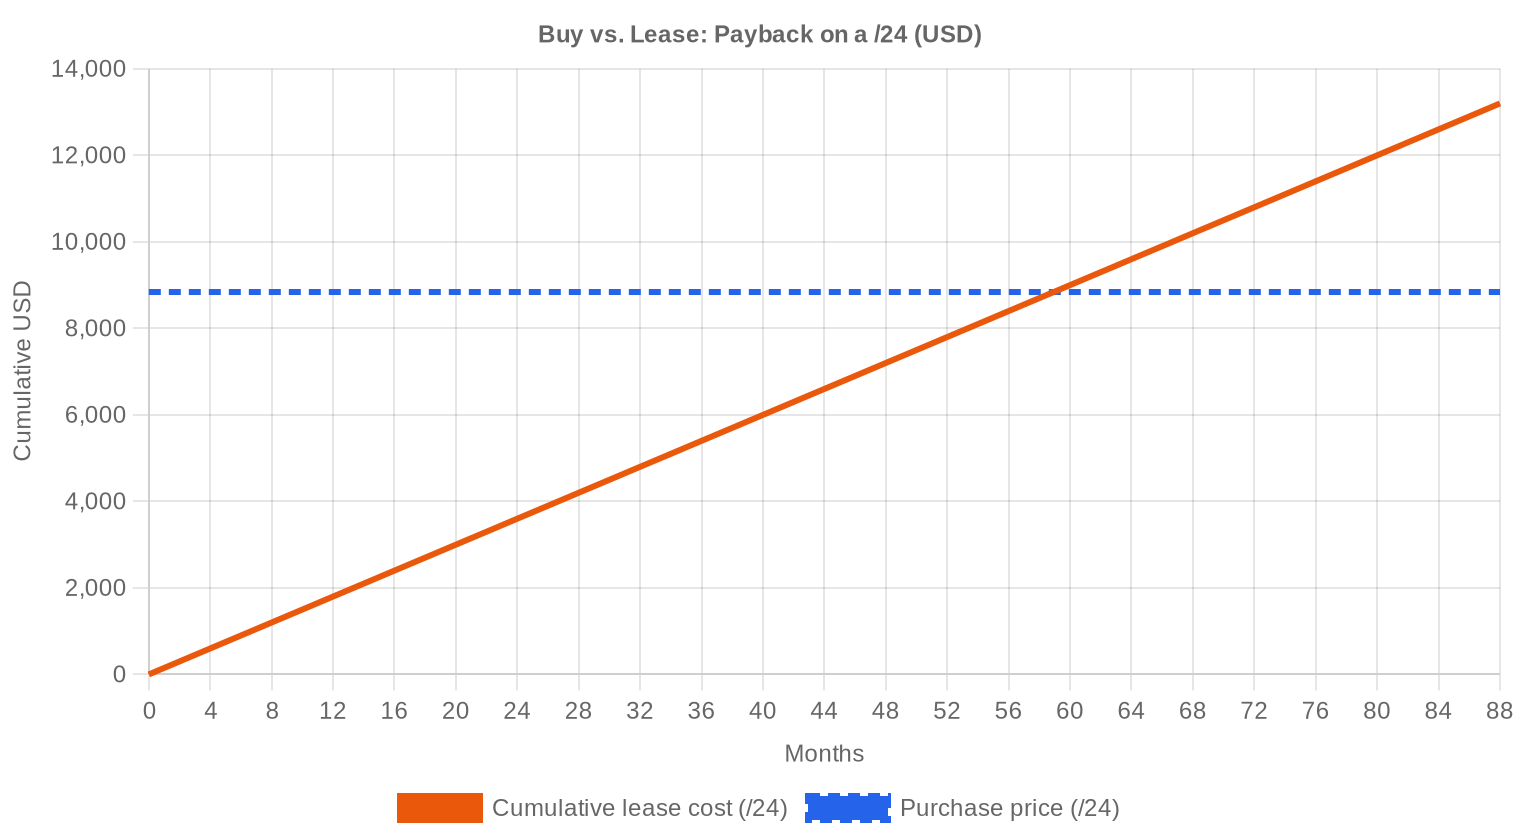
The buy-versus-lease math is clear-cut this quarter. At $34.53 per IP purchased and $0.5859 per IP per month leased, the breakeven lands at 58.9 months — just under 5 years. That's well inside the 90-month threshold we use as our decision boundary, making outright purchase the better economic choice for anyone with a time horizon beyond 2028. The implied annual yield on leased addresses runs at 20.4%, which is exceptional for what amounts to a depreciating-demand asset class — but that yield accrues to the lessor, not the lessee. If you're paying $150/month for a /24 when you could buy one for $8,840, you're effectively paying a 20% annual financing rate. That's expensive capital by any measure. Buyers with balance sheet capacity should be acquiring, not renting.| /24 Purchase price | $8,840 |
| /24 Lease price | $150 / mo |
| Payback period | 58.9 mo (4.9 yr) |
| Gross annual yield | 20.4% |
What This Means for You
Buyers: You have leverage. Pricing is down 4.8% quarter-over-quarter and the regression trend is still pointing lower. There's no urgency to front-run a price increase — take your time, negotiate hard, and target APNIC or RIPE blocks if your routing requirements allow it. Sellers: The market is getting softer but not collapsing. If you're sitting on clean, well-aged blocks in the ARIN registry, you can still command $35+ per IP. But the premium window is narrowing. Blocks that would have fetched $38–$40 in Q1 2023 are now clearing in the mid-$30s. Leasers: At $0.59/IP/month, leasing only makes sense for short-term needs under 5 years. If you're leasing a /24 at $150/month for a project that will run for 6+ years, you're overpaying by a wide margin. Run the math before renewing. Block holders: The 20.4% annual yield on leased addresses is still attractive — significantly above what you'd earn selling and reinvesting the proceeds in fixed income. If you have no immediate use for your allocation, leasing remains the optimal strategy unless you believe prices will decline sharply from here.Browse verified IPv4 blocksSell IPv4 →
List your blocks with managed transferLease IPv4 →
Flexible short-term capacityLease Out IPv4 →
Turn idle blocks into recurring revenue
IPv4 Pricing by Block Size
Small blocks command a steep per-IP premium. A /24 (256 addresses) traded at roughly $34–$35 per IP this quarter, while larger /16-class transactions pushed total deal values above $1 million but typically cleared at lower per-IP rates. The 119 sub-$50K deals — mostly /24s and /23s — accounted for just $2.07 million of the quarter's $22.6 million total. Six deals over $1 million drove $9.05 million, or 40% of value, at materially lower per-IP pricing.| Block | IPs | Buy: /IP | Buy: Total | Lease: /IP/mo | Lease: Monthly |
|---|---|---|---|---|---|
| /24 | 256 | $35–45 | $8,960–11,520 | $0.38–0.50 | $97–128 |
| /22 | 1,024 | $28–38 | $28,672–38,912 | $0.33–0.45 | $338–461 |
| /20 | 4,096 | $22–32 | $90,112–131,072 | $0.30–0.40 | $1,229–1,638 |
| /18 | 16,384 | $20–30 | $327,680–491,520 | $0.30–0.38 | $4,915–6,226 |
| /16 | 65,536 | $18–28 | $1,179,648–1,835,008 | $0.30–0.35 | $19,661–22,938 |
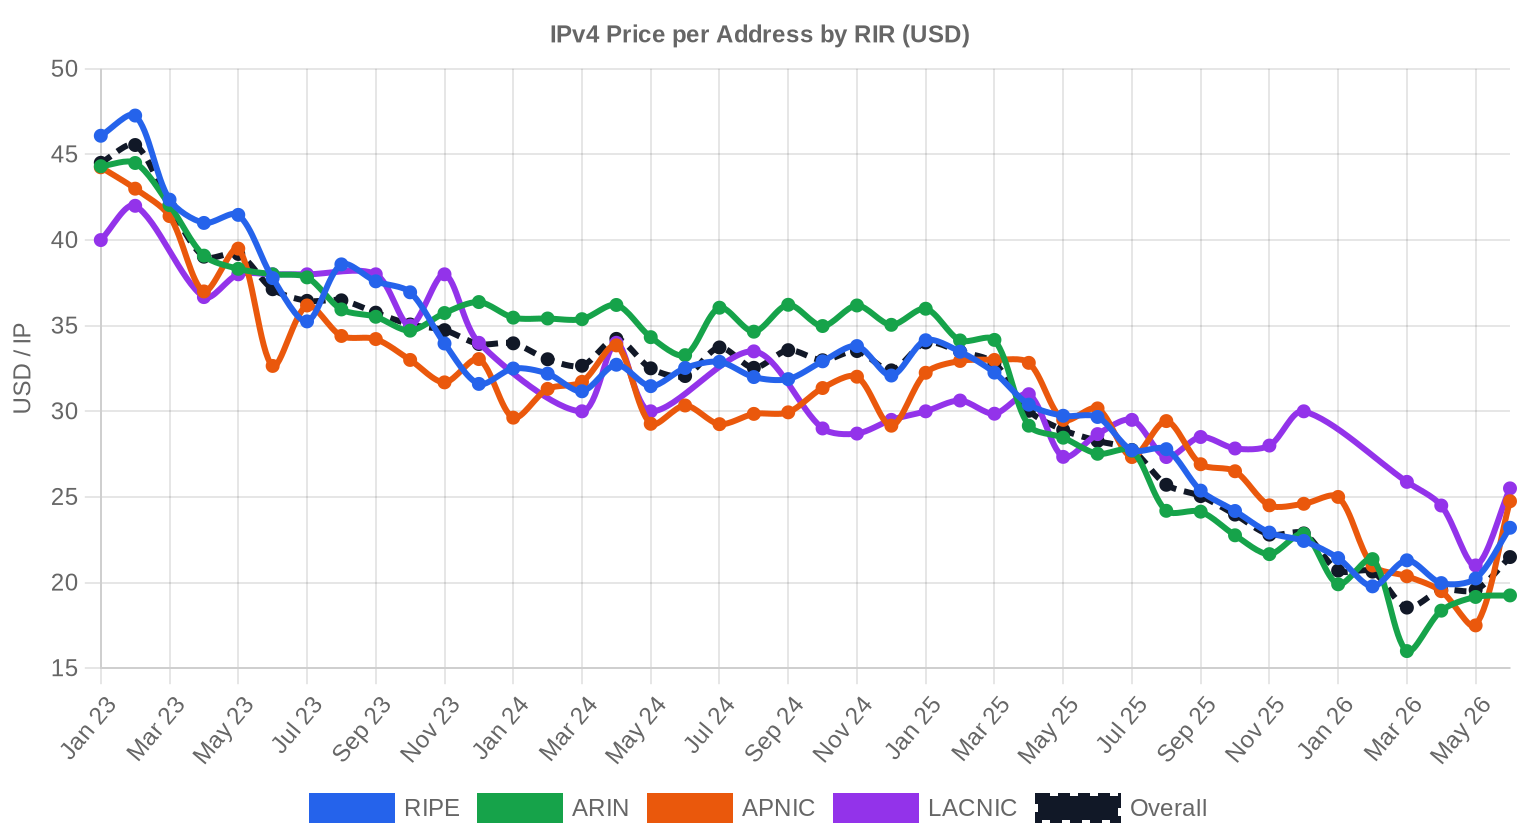
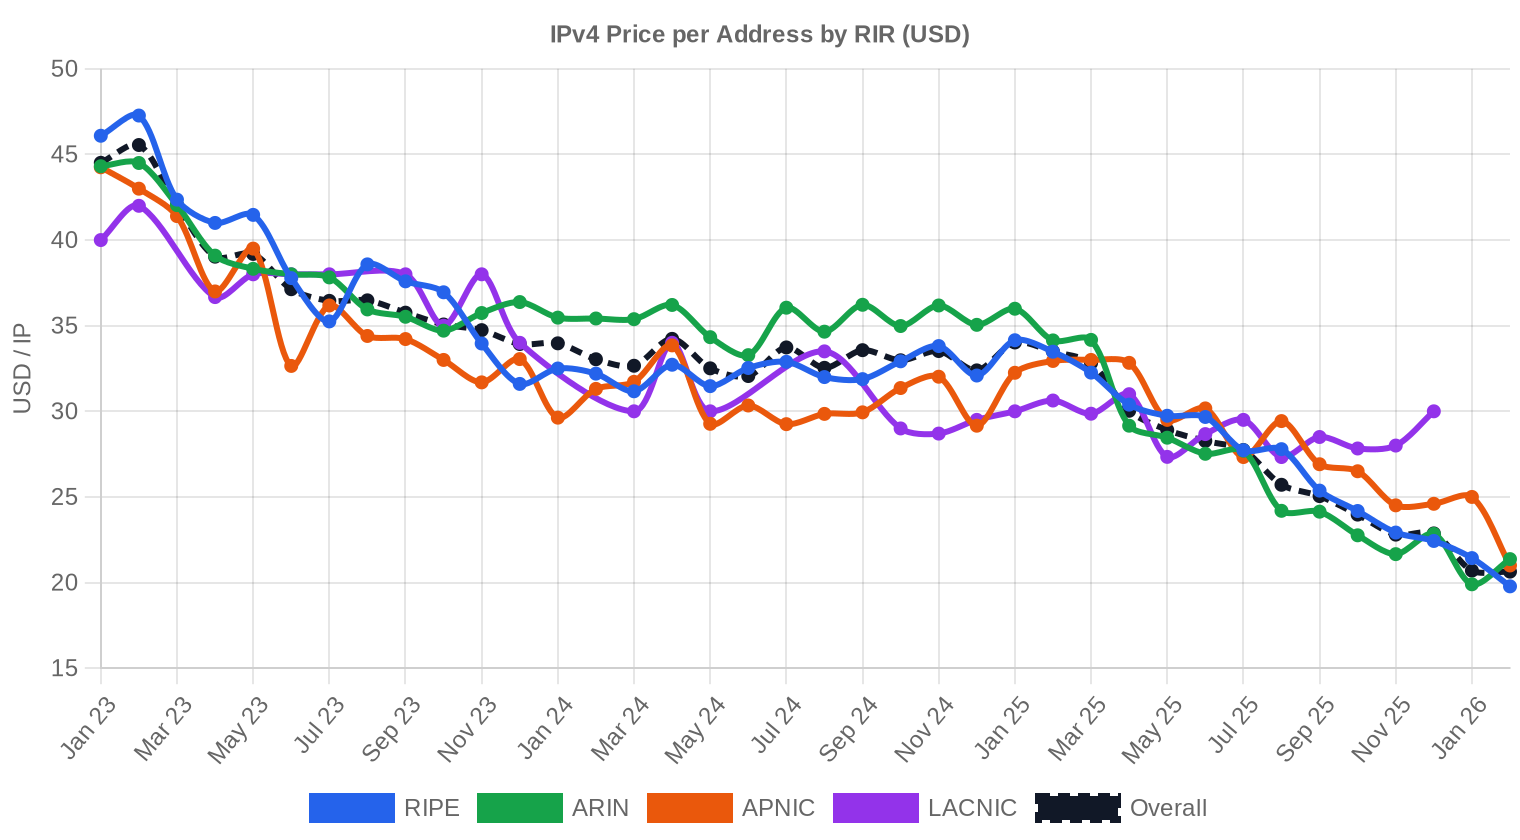
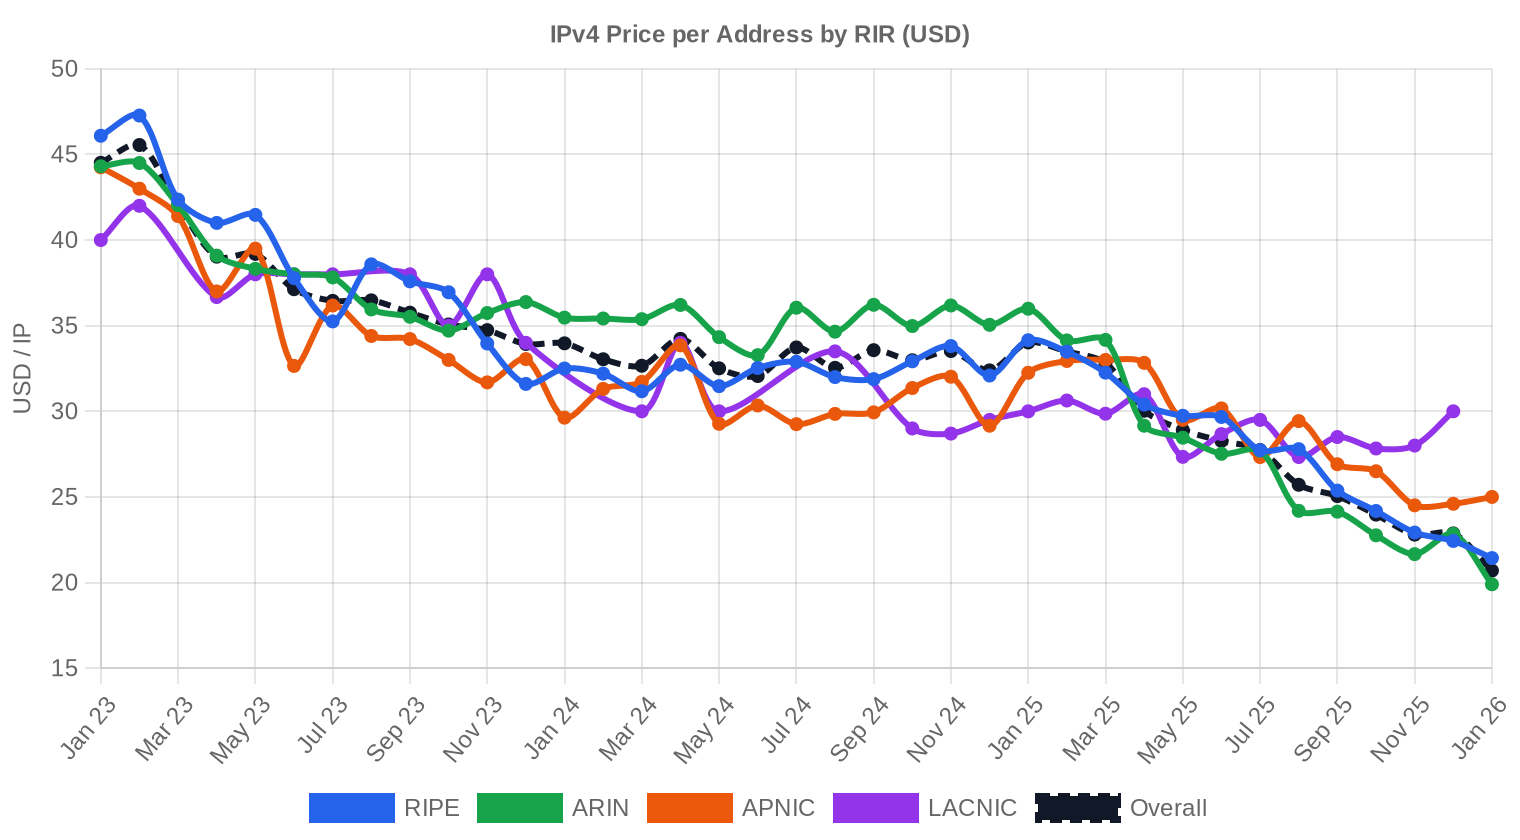
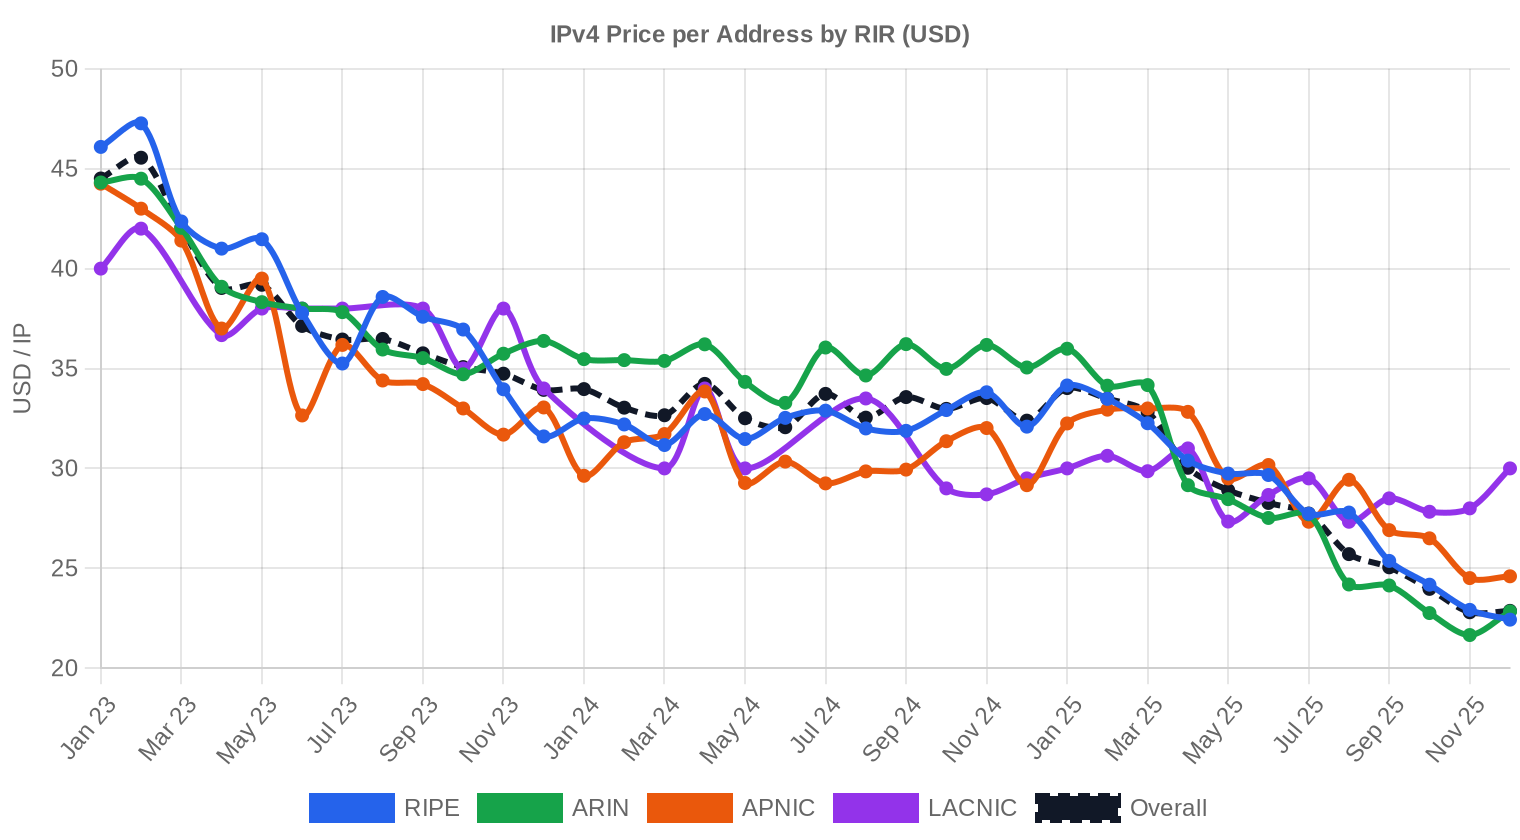
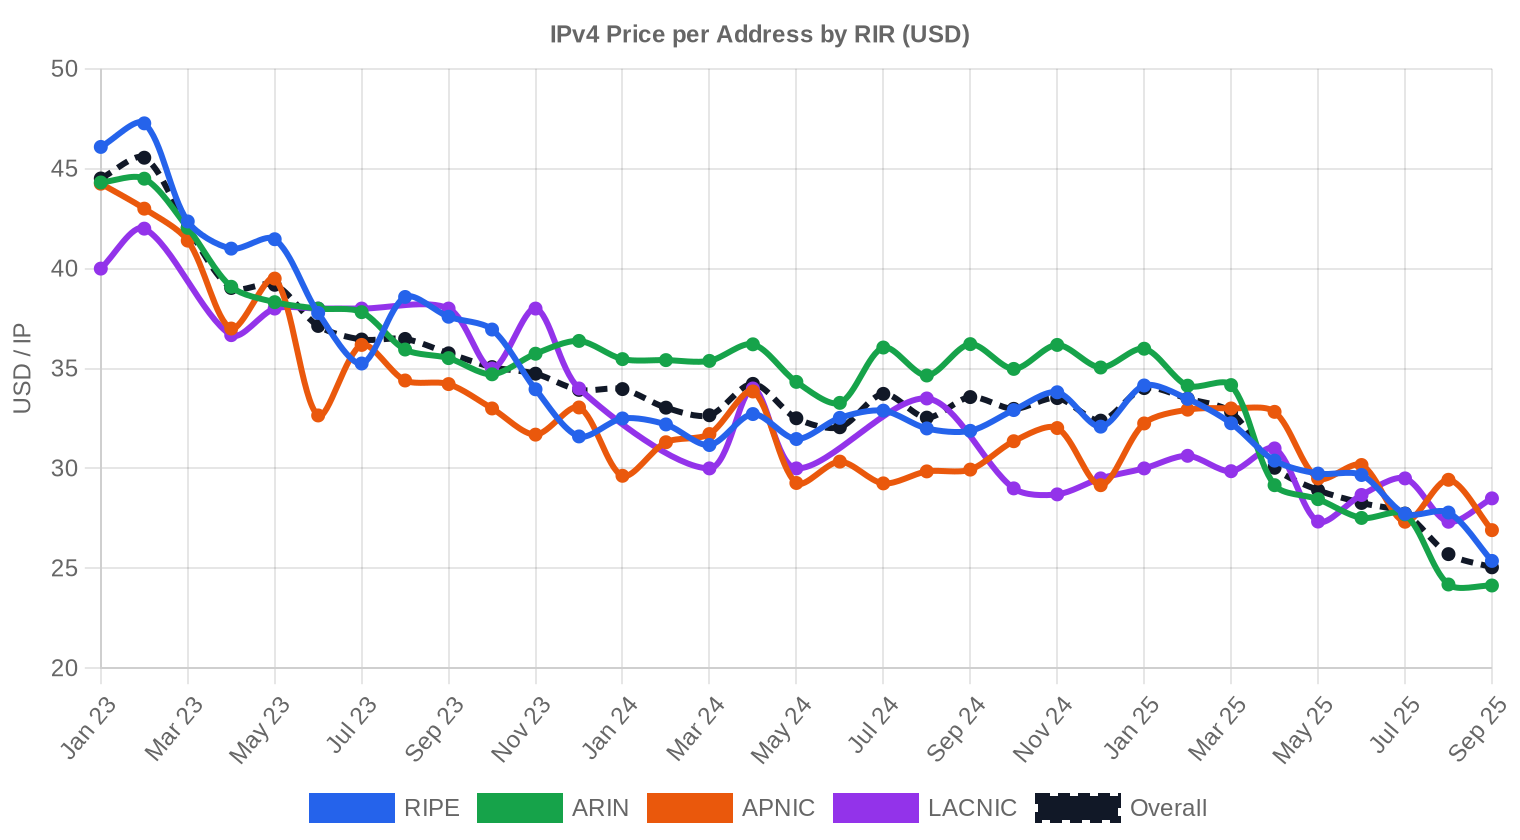
IPv4 Price History: 2011–2026
IPv4 pricing has traveled a long arc since IANA exhaustion in 2011, when addresses first started trading at $5–$7 per IP. The market peaked in the low-$50s during 2022–early 2023, driven by post-pandemic cloud demand and supply constraints. AWS's decision to charge $0.005/hour for public IPv4 starting February 2024 sent a clear price signal through the market in late 2023, contributing to the softening we're seeing now. The current $34.53 average represents a roughly 30% pullback from peak levels — a correction, not a crash, and one that looks orderly on the transaction data.| Year | ~Price/IP | Key Event |
|---|---|---|
| 2011 | $7–12 | IANA free pool exhausted; Microsoft/Nortel deal ($11.25/IP) |
| 2012 | $8–12 | RIPE NCC reaches last /8; begins /22-only allocation |
| 2014 | $10–15 | LACNIC free pool exhausted |
| 2015 | $8–15 | ARIN free pool exhausted |
| 2017–18 | $12–18 | Leasing market grows; cloud demand rises |
| 2019 | $18–24 | RIPE NCC exhausts remaining free pool |
| 2021–22 | $50–60+ | Post-pandemic peak; hyperscaler build-outs |
| 2024 | $35–52 | AWS IPv4 charge ($0.005/IP/hr); large block correction |
| 2025–26 | $18–45 | Market bifurcation; /16s below $20 for first time since 2019 |
Market Structure: Who Is Buying & Selling
The buy side continues to be dominated by mid-tier cloud and hosting providers, regional ISPs expanding fixed wireless deployments, and enterprises internalizing IP address management away from leased arrangements. On the sell side, legacy corporate holders — particularly companies in non-tech sectors that received large allocations in the 1990s — remain the primary source of inventory. Bankruptcy estates and M&A-driven divestitures contribute intermittently but are not a reliable supply source quarter to quarter.IPv4 vs. Other Asset Classes
At a 20.4% implied annual yield through leasing, IPv4 addresses outperform virtually every traditional fixed-income instrument — US 10-year Treasuries yielded roughly 4.5% at quarter-end, and investment-grade corporate bonds sat around 5.5%. The comparison to commercial real estate is more apt: IPv4 blocks are illiquid, require management overhead, and face long-term obsolescence risk from IPv6. But unlike commercial real estate, carrying costs are negligible — no property taxes, no maintenance — making the net yield comparison even more favorable in the near term.| Asset Class | Typical Yield | Liquidity | Primary Risk |
|---|---|---|---|
| IPv4 | 20.4% | Moderate | IPv6 adoption, block quality |
| Commercial Real Estate | 5–8% | Low | Vacancy, rate cycle |
| Investment-Grade Bonds | 4–5% | High | Duration, credit risk |
| S&P 500 | ~1,3% | High | Market volatility |
| Money Market / T-Bills | ~4–5% | High | Rate cycle changes |
IPv6 Adoption & Why IPv4 Remains Essential
IPv6 adoption crossed 45% of Google-measured traffic globally by late 2023, but the growth curve has flattened. Major mobile networks run dual-stack, and most enterprise WANs still depend heavily on IPv4 for internal and external connectivity. The coexistence period is measured in decades, not years. Every new edge deployment, IoT rollout, and enterprise VPN still needs routable v4 space, and that reality underpins the asset class even as v6 deployment creeps forward.AI & Cloud Infrastructure Demand
AI infrastructure buildout is creating a new source of IPv4 demand that didn't exist 18 months ago. Training clusters and inference endpoints at scale require dedicated public IP space for API exposure, model serving, and data ingestion pipelines. GPU cloud providers — both hyperscalers and the emerging crop of specialized AI compute companies — have been quietly accumulating /16 and larger blocks. This demand is visible in the 6 transactions above $1 million recorded this quarter, several of which are consistent with data center-scale acquisitions.What Determines IPv4 Block Value
Block valuation in Q4 remained highly sensitive to reputation cleanliness. Addresses with no blacklist history, aged allocations (pre-2010), and a clean WHOIS trail command the $40–$50 end of the range. Blocks that have passed through multiple holders, carry Spamhaus listings, or originate from registries with transfer restrictions trade at significant discounts — the $28 floor this quarter almost certainly reflects inventory with one or more of these issues.Sell vs. Lease: A Decision Framework
For holders weighing sell versus lease: leasing delivers a 20.4% annual return on current market value, which is hard to beat in any asset class. Selling makes sense if you believe prices will decline more than 20% annually — which, at the current 4.8% quarterly decline rate, would require a sharp acceleration in the downtrend. Unless you have strong conviction that the market is heading toward the low $20s within two years, leasing remains the higher-return strategy.| /24 Purchase price | $8,840 |
| /24 Lease price | $150 / mo |
| Payback period | 58.9 mo (4.9 yr) |
| Gross annual yield | 20.4% |
RIPE NCC 24-Month Transfer Restriction
RIPE's 24-month holding requirement continues to constrain supply in the European market. Any block transferred into a RIPE member must be held for two years before it can be re-transferred, which effectively removes speculative flipping and creates a natural floor on available inventory. The rule also means that blocks acquired during the 2022 price peak are locked up until mid-to-late 2024, which could create a supply release wave — and downward price pressure — in the second half of next year.Deal Size Distribution
Average deal size jumped to $133,550 from $71,485 in Q3 — an 87% increase driven by several large-block transactions in the over-$1M category. The distribution is heavily skewed: 119 deals (70%) fell below $50K and accounted for just $2.07 million, while 6 deals above $1 million represented $9.05 million, or 40% of total value. The mid-market ($50K–$250K) saw 30 transactions totaling $3.25 million, consistent with regional ISPs and hosting companies acquiring /20 to /18 blocks.Top Trading Countries
Country-specific transaction data was not available for Q4 2023. RIR-level data serves as a proxy: ARIN's 56.2% share implies the US and Canada drove the majority of activity, with European markets through RIPE accounting for the next-largest segment. The near-absence of LACNIC and AFRINIC activity reflects both limited supply and less-developed secondary markets in those regions.BEAD Broadband Program Impact
The $42.45 billion BEAD program is still in the planning and allocation phase across US states, with most build-outs expected to begin in earnest in 2024–2025. When ISPs awarded BEAD grants start deploying fixed wireless and fiber-to-the-home networks, they'll need routable IPv4 space — primarily /20 to /18 blocks. This represents a latent demand wave that hasn't yet hit the market but will tighten supply in exactly the mid-size block category where inventory is already thinnest.Hyperscaler IPv4 Holdings
Amazon, Microsoft, and Google collectively hold an estimated 100+ million IPv4 addresses — a significant share of total routable space. Amazon's decision to monetize its holdings by charging for public IPv4 starting in early 2024 may push some customers toward IPv6 or Carrier-Grade NAT, potentially freeing up addresses on the margin. But the hyperscalers are not net sellers; their holdings function as strategic infrastructure assets, and any addresses returned to the market tend to be small allocations from enterprise customers, not large blocks from the cloud providers themselves.Macroeconomic Conditions & Market Impact
Higher interest rates throughout 2023 increased the opportunity cost of holding non-yielding assets, but IPv4's 20.4% lease yield largely insulates it from that pressure. Enterprise IT budgets tightened in Q4 as companies pulled back on discretionary spending ahead of an uncertain 2024, which likely contributed to the 4.8% price decline. The transaction count increase of 9.7%, though, suggests that budget-constrained buyers were still active — just at lower price points.Model Update & Calibration
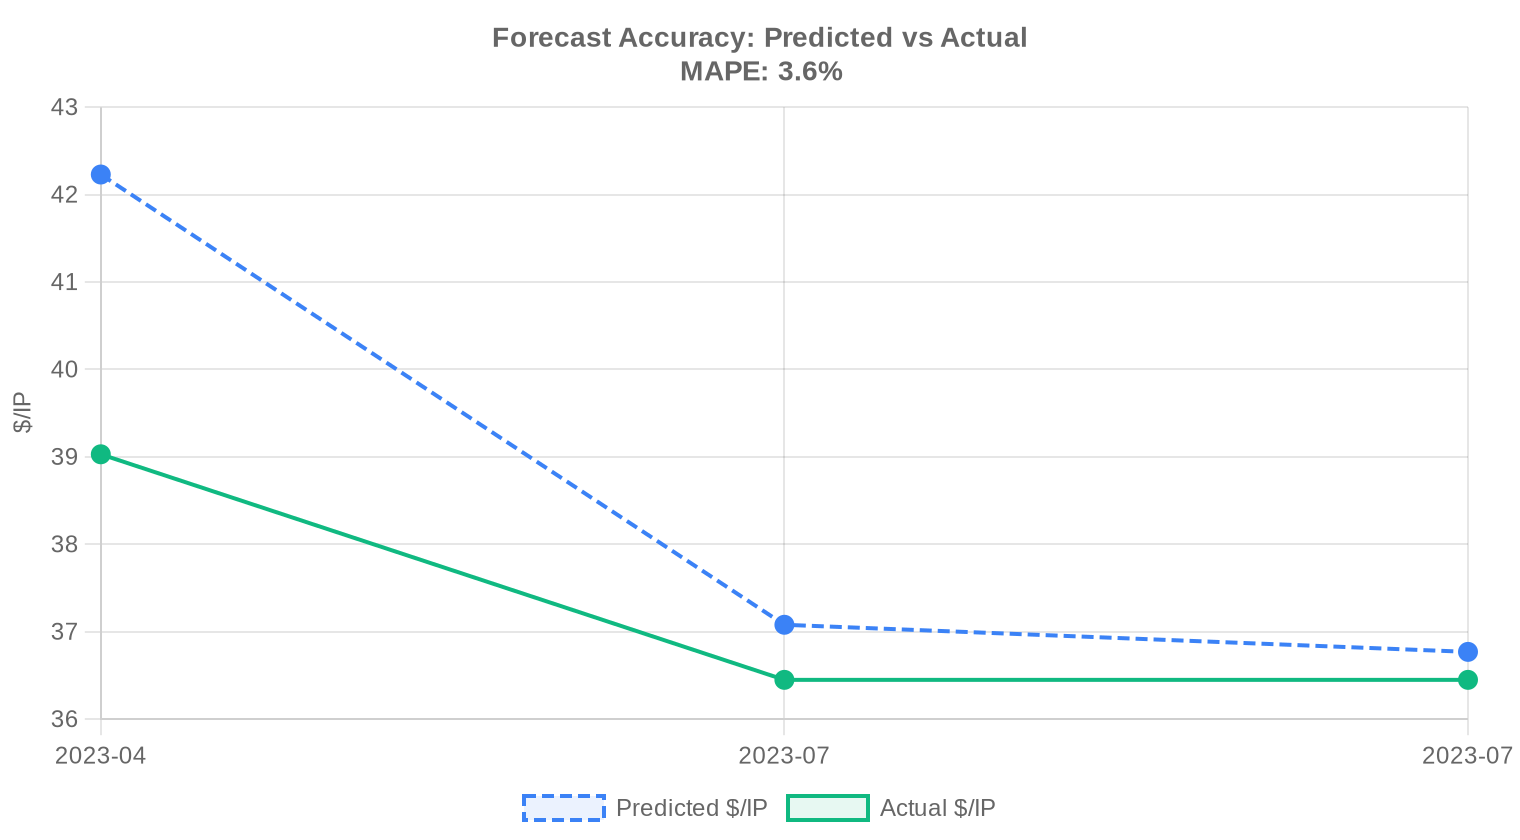
We reviewed our past projections against actual market outcomes and recalibrated the model for this report. The updated model places more weight on recent price movements using exponential decay, dynamically adjusts prediction bands to reflect current market conditions, and corrects for any systematic bias detected in earlier forecasts. The predicted-vs-actual comparison chart below shows how closely our past estimates tracked reality.
| Report Period | Target Month | Predicted | Actual | Deviation |
|---|---|---|---|---|
| 2023-Q1 | 2023-04 | $42 | $39 | +8% |
| 2023-H1 | 2023-07 | $37 | $36 | +2% |
| 2023-Q2 | 2023-07 | $37 | $36 | +1% |
Methodology
Figures are based on completed IPv4Center marketplace transactions and RIR transfer statistics. Prices are in US dollars per IP address. Forecasts are produced by an AI model that analyses each block-size band and RIR segment separately (with outlier-trimmed medians) alongside known market catalysts; they are estimates, not guarantees.
Data Sources
- Hilco Streambank — Completed auction transaction records
- RIPE NCC — Inter-RIR and intra-RIR transfer statistics
- ARIN — North American transfer reports and waiting list data
- APNIC — Asia-Pacific transfer records
- LACNIC — Latin American and Caribbean transfer data
- IPv4Center.com — Proprietary marketplace transaction and lease pricing data
This report is generated automatically for informational purposes only and does not constitute financial advice.
Frequently Asked Questions
What was the average price per IPv4 address in Q4 2023?
The market-wide average landed at .53 per address, with a median of — a tight spread that signals reasonable price discovery across 169 observed transactions. The quarter's trend was modestly deflationary, with prices drifting down roughly 1.74%.
How much total deal value moved through the IPv4 market in Q4 2023?
Approximately .6 million changed hands across 588,288 addresses. Six transactions alone exceeded million each, accounting for .05 million — just over 40% of total quarterly value on fewer than 4% of deals.
Which RIR region commanded the highest per-IP pricing in Q4 2023?
LACNIC blocks topped the table at .67 per IP on average, edging out ARIN at .56. That said, LACNIC volume was thin — just three transactions covering 12,544 addresses — so the premium reflects scarcity as much as demand.
Why were ARIN blocks priced above RIPE blocks this quarter?
ARIN averaged .56 versus RIPE's .28, a .28 spread. ARIN's transfer framework is well-understood by North American buyers and the region's commercial demand remains robust. RIPE, despite processing more total transfers (2,118 vs. 886), carries slightly higher supply availability, which keeps pricing competitive.
How did APNIC pricing compare to other regions in Q4 2023?
APNIC was the most affordable major region at .40 per IP on average, with a narrow – range across 15 transactions. The discount relative to ARIN (.56) likely reflects Asia-Pacific buyers' price sensitivity and the region's more advanced IPv6 deployment.
Were there any AFRINIC transactions in Q4 2023?
Zero. AFRINIC recorded no priced transactions and no inter-RIR transfers during the quarter. Ongoing governance uncertainty and transfer policy restrictions continue to render AFRINIC blocks effectively illiquid.
What was the most common block size traded in Q4 2023?
/24 blocks dominated with 68 transactions — roughly 40% of all deals. This confirms the market's continued fragmentation toward smaller lots, driven by SMBs and cloud operators filling specific subnetting requirements.
How was deal volume distributed by size in Q4 2023?
The sub-K bracket accounted for 119 of 169 deals (70%), but only .07 million in value. Meanwhile, the 6 deals above million represented .05 million — demonstrating the classic power-law distribution where a handful of institutional trades drive the bulk of dollar volume.
What was the average deal size in dollar terms this quarter?
Approximately 3,550 per transaction. This average is skewed upward by the six seven-figure deals; the median transaction almost certainly fell well below ,000 given that 119 of 169 deals landed in that bracket.
Is the IPv4 market trending up or down heading into 2024?
Down, modestly. Q4 2023 showed a 1.74% decline in average pricing. Our model forecasts a near-term price of .58 for the next reporting period, with year-end 2023 settling at .41. The decline is orderly — this is compression, not capitulation.
Should buyers purchase or lease IPv4 addresses at current Q4 2023 rates?
Buy. At .53 per IP versus .59/month in lease costs, the breakeven falls at roughly 59 months — just under 5 years. Any holding period beyond that and you're effectively paying rent on an appreciating (or at worst stable) asset. The implied annual yield for lessors sits at a compelling 20.4%.
What is the current lease rate for a /24 block?
Approximately 0 per month based on 44 observed lease transactions, predominantly in the RIPE region. That implies .5859 per IP per month, or about .03 per IP annually.
What mistakes should buyers avoid in the current Q4 2023 market?
Three pitfalls stand out: overpaying above per IP when the market median is , ignoring RIR arbitrage (APNIC blocks at .40 offer real savings versus ARIN's .56), and rushing into leases when the buy-vs-lease math clearly favors purchasing at current rates for any horizon beyond 5 years.
What are the risks of buying IPv4 addresses at – per IP right now?
The primary risk is secular: IPv6 adoption could accelerate and compress IPv4 valuations over a 7–10 year horizon. More immediately, the 1.74% quarterly decline could steepen if large holders decide to liquidate. That said, the floor appears well-supported — the quarter's minimum transaction still came in at per IP.
Is it risky to hold IPv4 addresses as a long-term investment given the Q4 2023 price decline?
A 1.74% quarterly dip hardly constitutes distress, but the trend deserves monitoring. Holders earning 20.4% annual yield on leases are well-compensated for the depreciation risk. The danger lies in holding unleveraged, unleased blocks — dead inventory in a declining-price environment is a textbook value trap.
What are the risks of leasing instead of buying at current rates?
At 0/month per /24, a lessee pays ,839 over 59 months — the full purchase price equivalent. Beyond that breakeven, every dollar is pure economic waste. Organizations with multi-year address needs are effectively paying a 20.4% annualized premium for the flexibility of walking away.
How many total inter-RIR transfers were recorded in the trailing twelve months?
Approximately 9,189 transfers across all RIRs in the twelve months through Q4 2023, peaking in October 2023. RIPE accounted for 64% of transfer volume, ARIN 36%. APNIC, LACNIC, and AFRINIC registered negligible to zero transfer activity.
Why does RIPE dominate transfer volumes but not pricing?
RIPE processed 2,118 transfers in Q4 versus ARIN's 886, yet averaged only .28 per IP against ARIN's .56. Higher liquidity suppresses price. RIPE's more permissive transfer policies and Europe's dense broker ecosystem create supply-side competition that benefits buyers.
What drove the price range from to per IP in Q4 2023?
Block size, cleanliness, and urgency. The floor likely reflects large blocks (/16 or bigger) sold in bulk or addresses with minor reputation blemishes. The ceiling appeared in both RIPE and ARIN and almost certainly represents small, pristine /24s sold to buyers under time pressure.
How does IPv6 adoption affect the Q4 2023 IPv4 market outlook?
It's the slow-moving asteroid. IPv6 deployment continues to rise globally, but legacy infrastructure, vendor compatibility gaps, and sheer organizational inertia keep IPv4 demand structurally intact. The 1.74% price decline this quarter may partially reflect incremental IPv6 substitution, but a cliff event remains unlikely in the near term.
What does the transfer process typically look like for an ARIN block?
ARIN requires a needs-based justification from the buyer, a signed transfer agreement, and approval from ARIN's registration services team. End-to-end, the process runs 4–8 weeks. ARIN processed 886 transfers this quarter — a mature, well-oiled pipeline, albeit slower than RIPE's more administrative approach.
How should organizations budget for IPv4 procurement in early 2024 based on Q4 2023 data?
Plan for – per IP as a reasonable baseline, with our model projecting .58 for the next period. For a /24, that's roughly ,400–,960 in address cost before broker fees and transfer expenses. Buyers targeting APNIC blocks can budget 5–8% lower.
Are smaller organizations being priced out of the IPv4 market?
Not yet. A /24 block — the minimum routable prefix on most networks — costs approximately ,840 at Q4's average. That's a manageable capital expense for most businesses. The 119 sub-K transactions (70% of all deals) confirm that the market remains accessible to small and mid-sized buyers.
What should sellers expect if they bring IPv4 blocks to market in early 2024?
Realistic expectations should center on – per IP, trending toward the lower end given the 1.74% quarterly decline and our .41 year-end forecast. ARIN and LACNIC blocks may fetch a slight premium. Sellers sitting on large, clean blocks will find willing institutional buyers, but the days of + pricing appear to be in the rearview mirror.
How reliable is the price forecast for the next quarter?
Our model rates the forecast as reliable, projecting .58 per IP for the next period. The tight bid-ask spreads (median , mean .53), healthy transaction count (169 deals), and orderly decline support reasonable forward visibility. Tail risks — a large holder liquidation, regulatory surprises — could introduce volatility, but the base case is continued gentle compression.