14 min read
This report analyzes the IPv4 transfer market for Q3 2023, based on completed IPv4Center marketplace transactions and official RIR transfer records.
Executive Summary
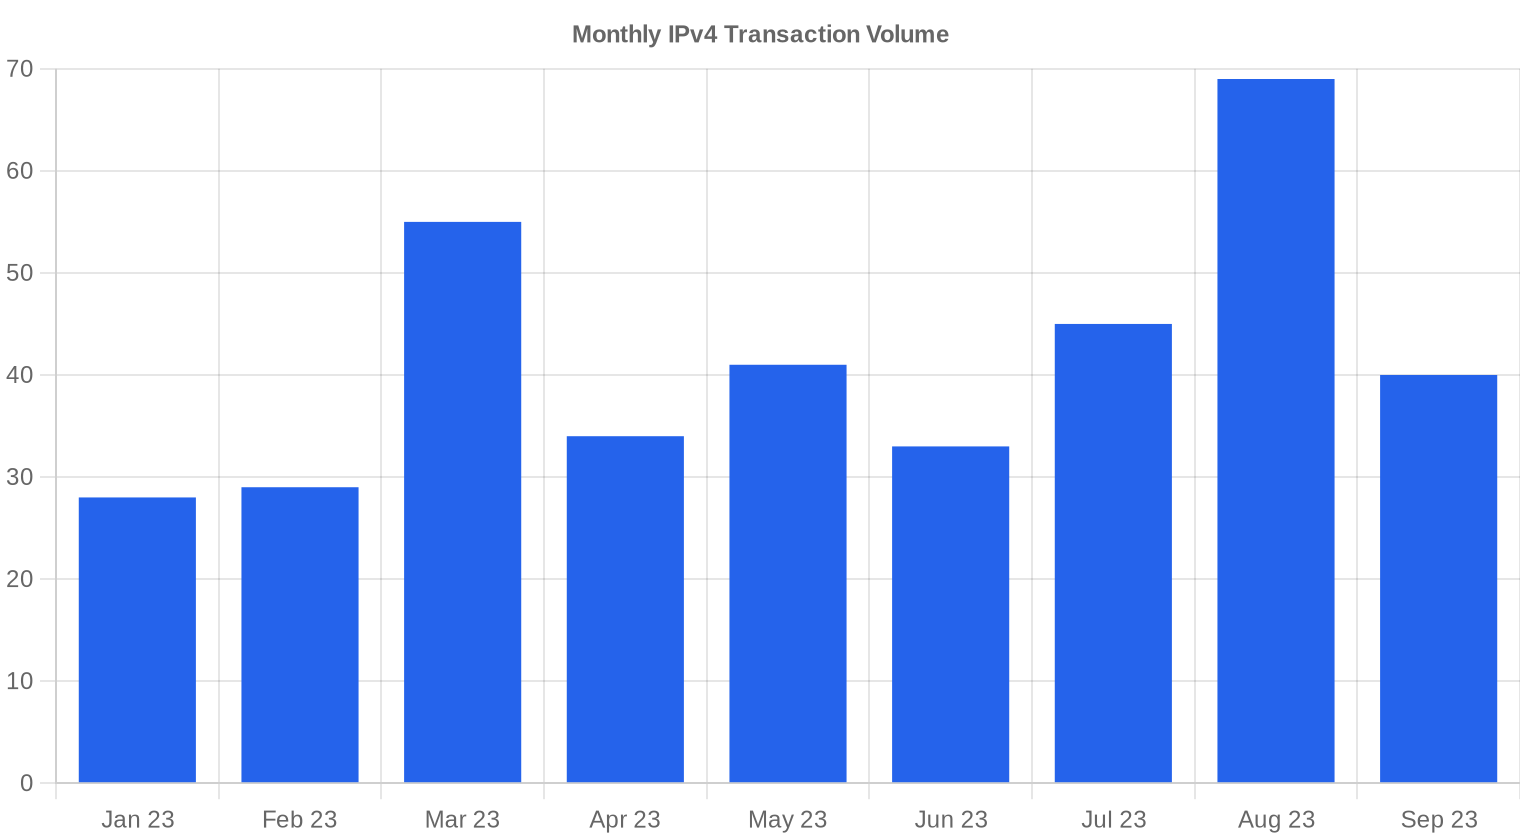
The IPv4 transfer market in Q3 2023 processed 154 transactions covering 293,888 addresses at a total value of $11.0 million. The average price per IP fell to $36.29, down 5.8% from Q2 2023, while the median held at $36. What made the quarter unusual was the sharp divergence between price and volume: transaction count surged 42.6% versus the prior period even as unit pricing continued its slide. The trend line points firmly downward, with a quarter-over-quarter decline of 0.28% on a smoothed basis — modest in isolation, but part of a pattern that has been building since the peak.Market Overview
| Transactions | 154 |
| IP Addresses Traded | 293,888 |
| Estimated Market Value | $11,008,701 |
| Average Price / IP | $36.29 |
| Median Price / IP | $36.00 |
| RIR Transfers | 1,903 |
Price Dynamics
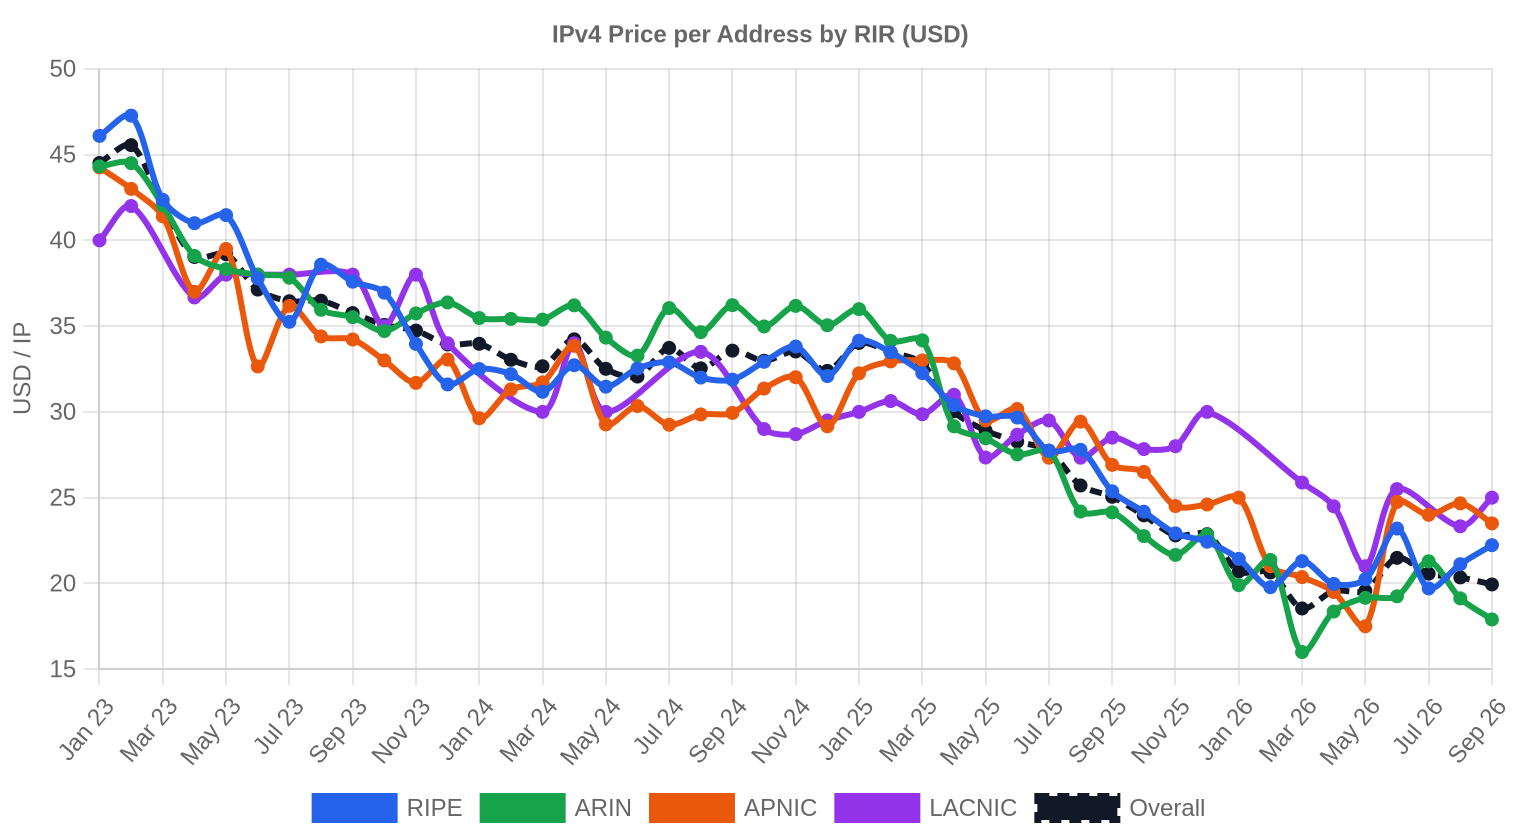
The pricing band in Q3 ranged from $29 to $50 per IP, a $21 spread that reflects persistent segmentation between clean, well-documented blocks and everything else. The $29 floor appeared in RIPE transactions, likely smaller or less pristine allocations finding price-sensitive buyers. The $50 ceiling came out of APNIC, where scarcity in certain sub-regions still commands a premium. Against Q2 2023, the 5.8% decline in the average suggests sellers are accepting lower bids to move inventory — and the 42.6% volume surge confirms buyers showed up once pricing dropped to more palatable levels. This is classic price-discovery behavior: sellers capitulated modestly, volume responded.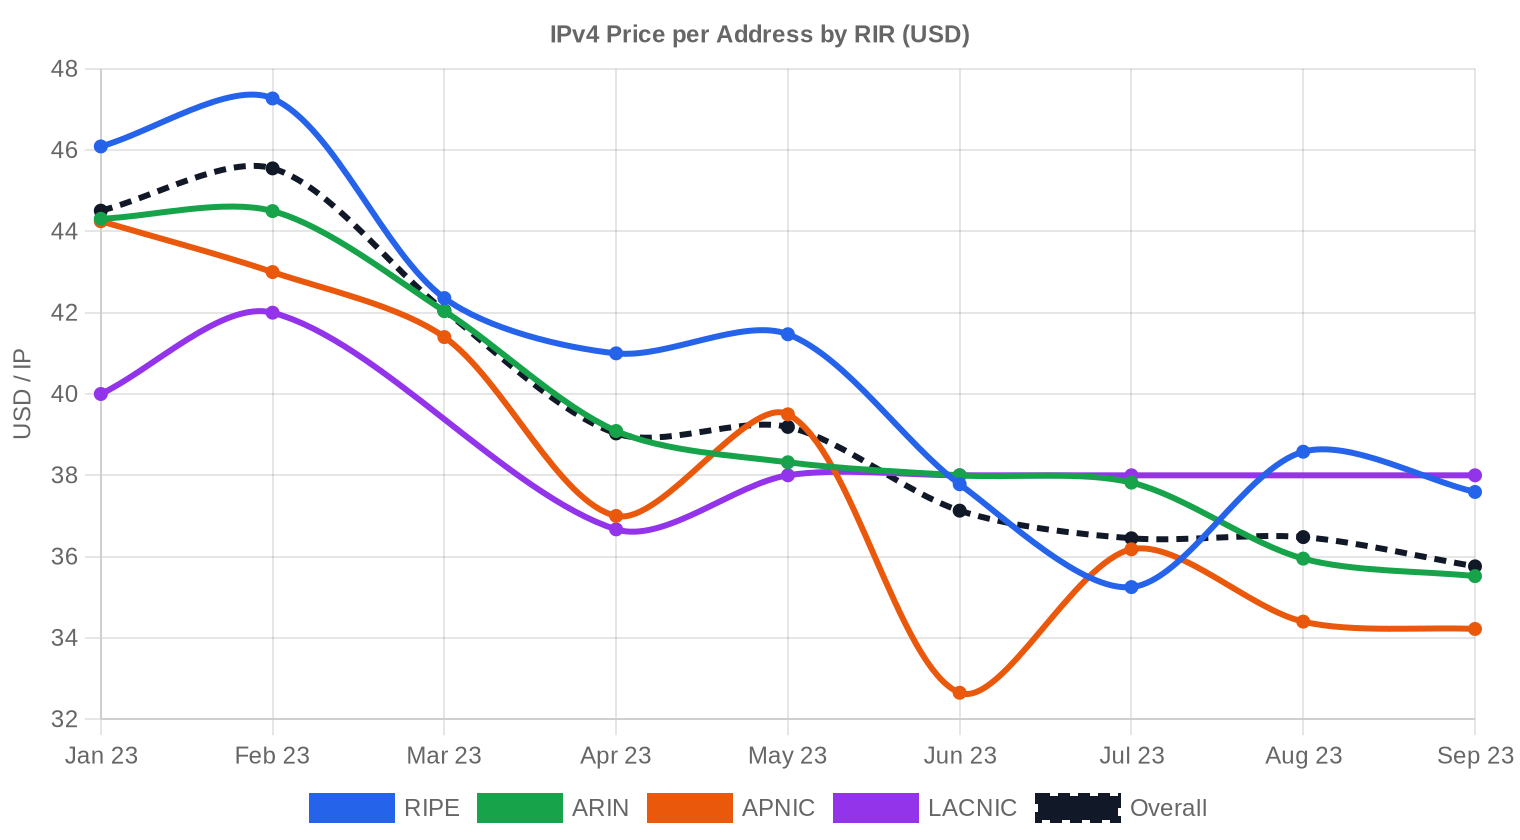
Pricing by RIR
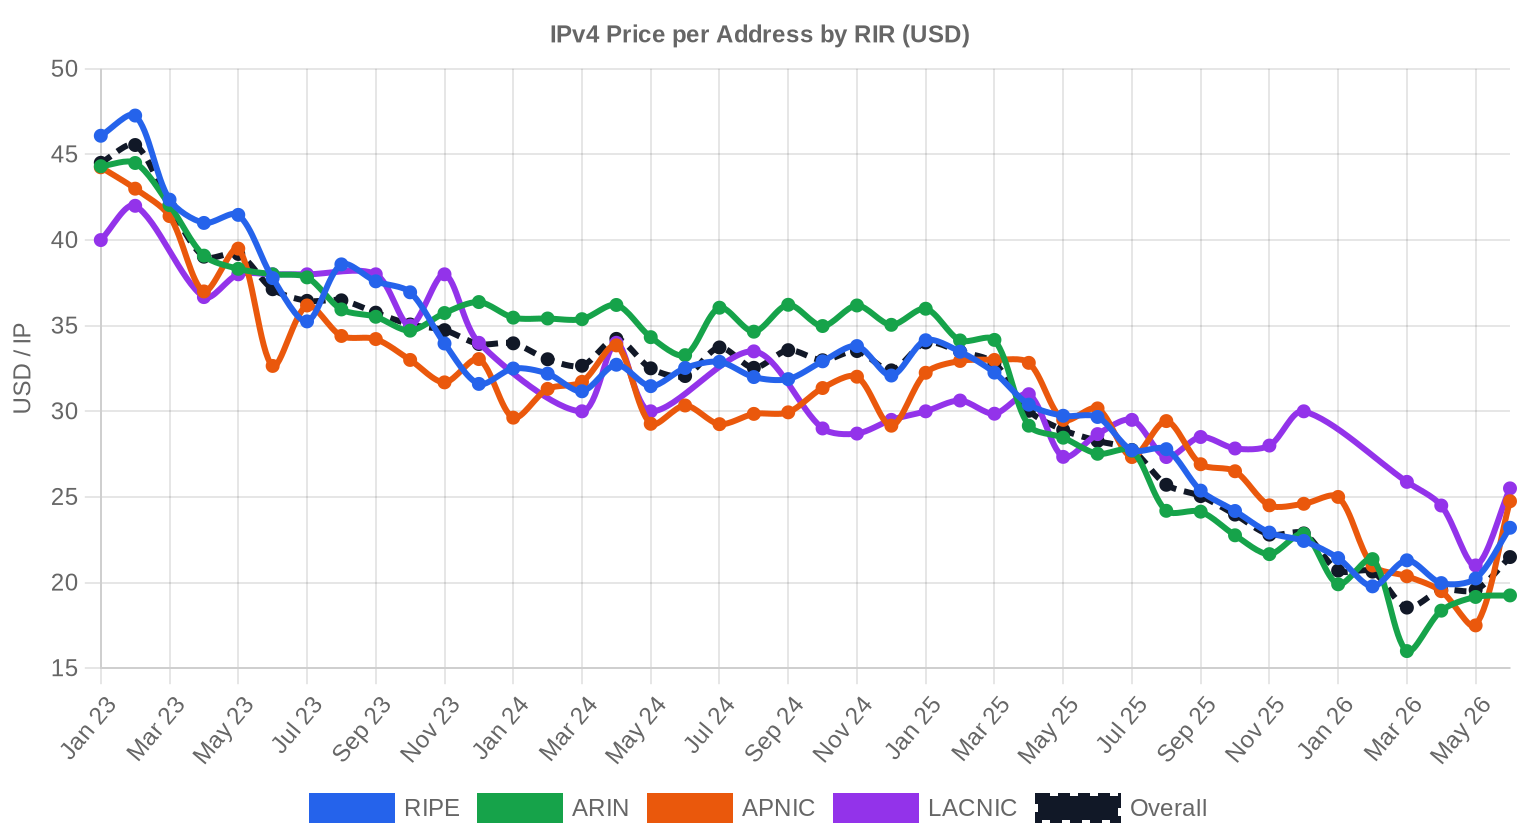
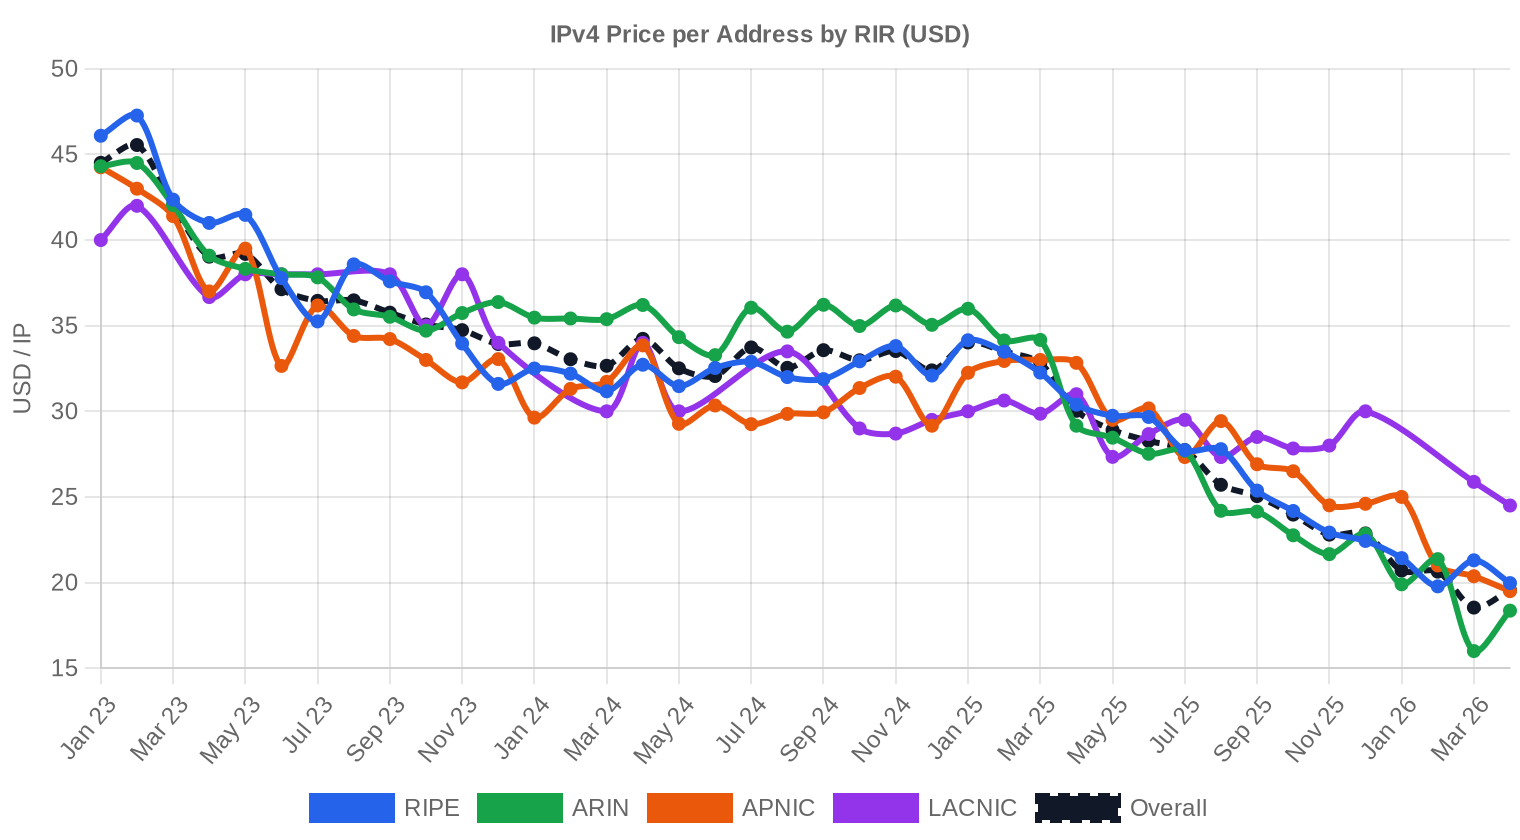
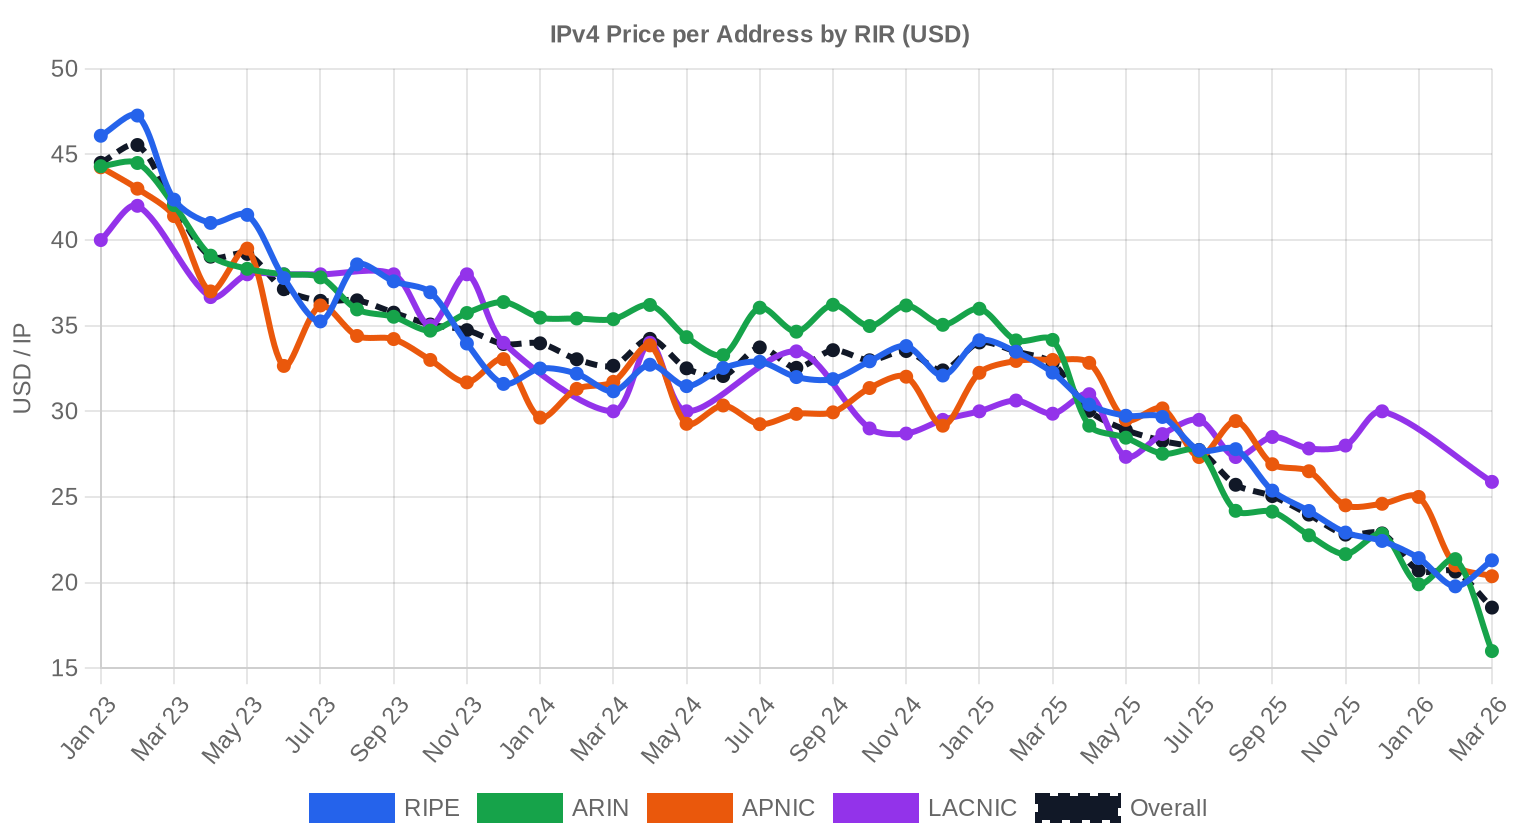
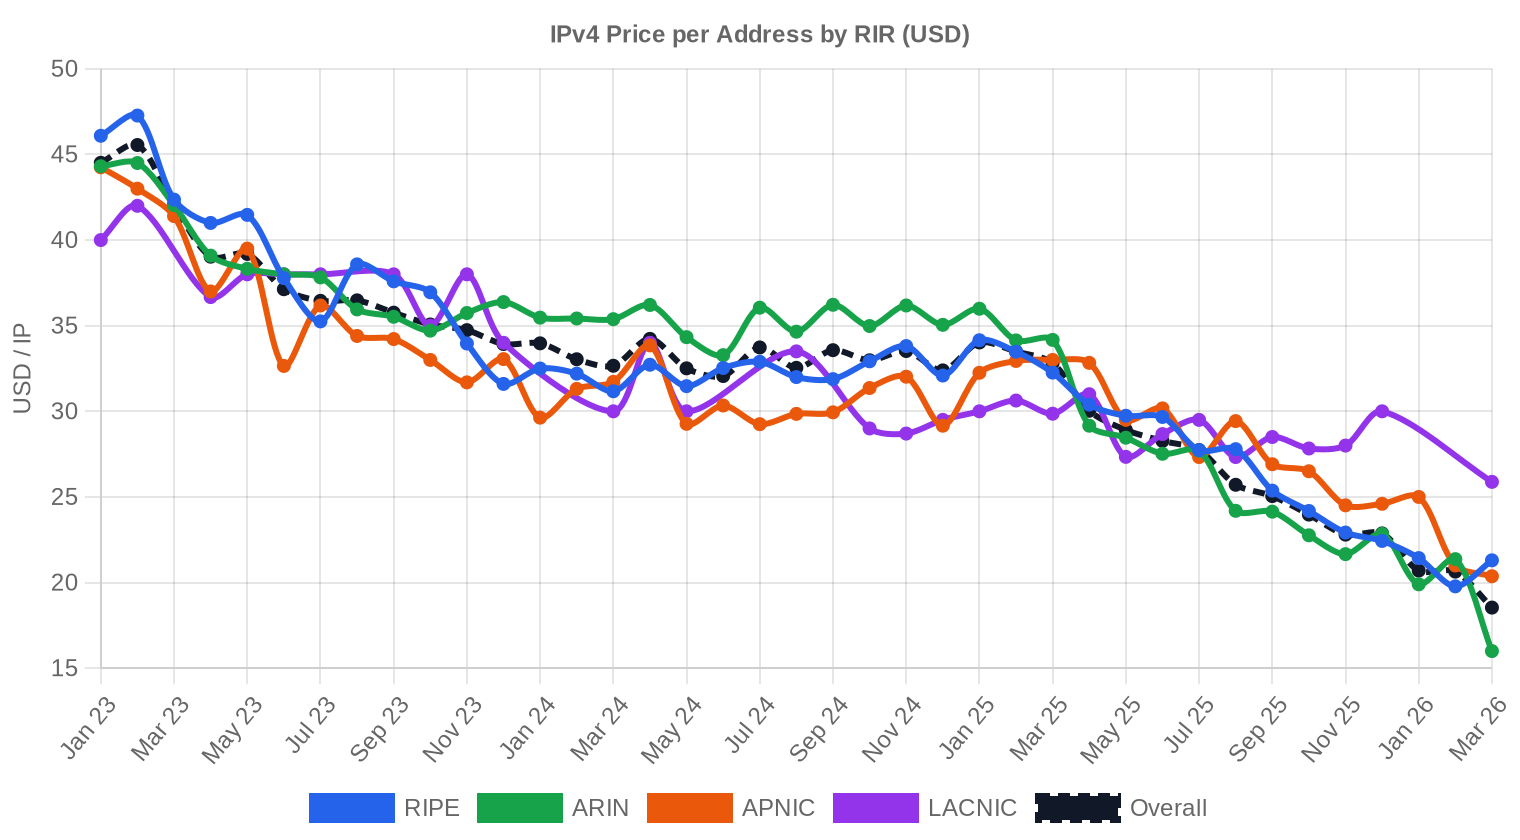
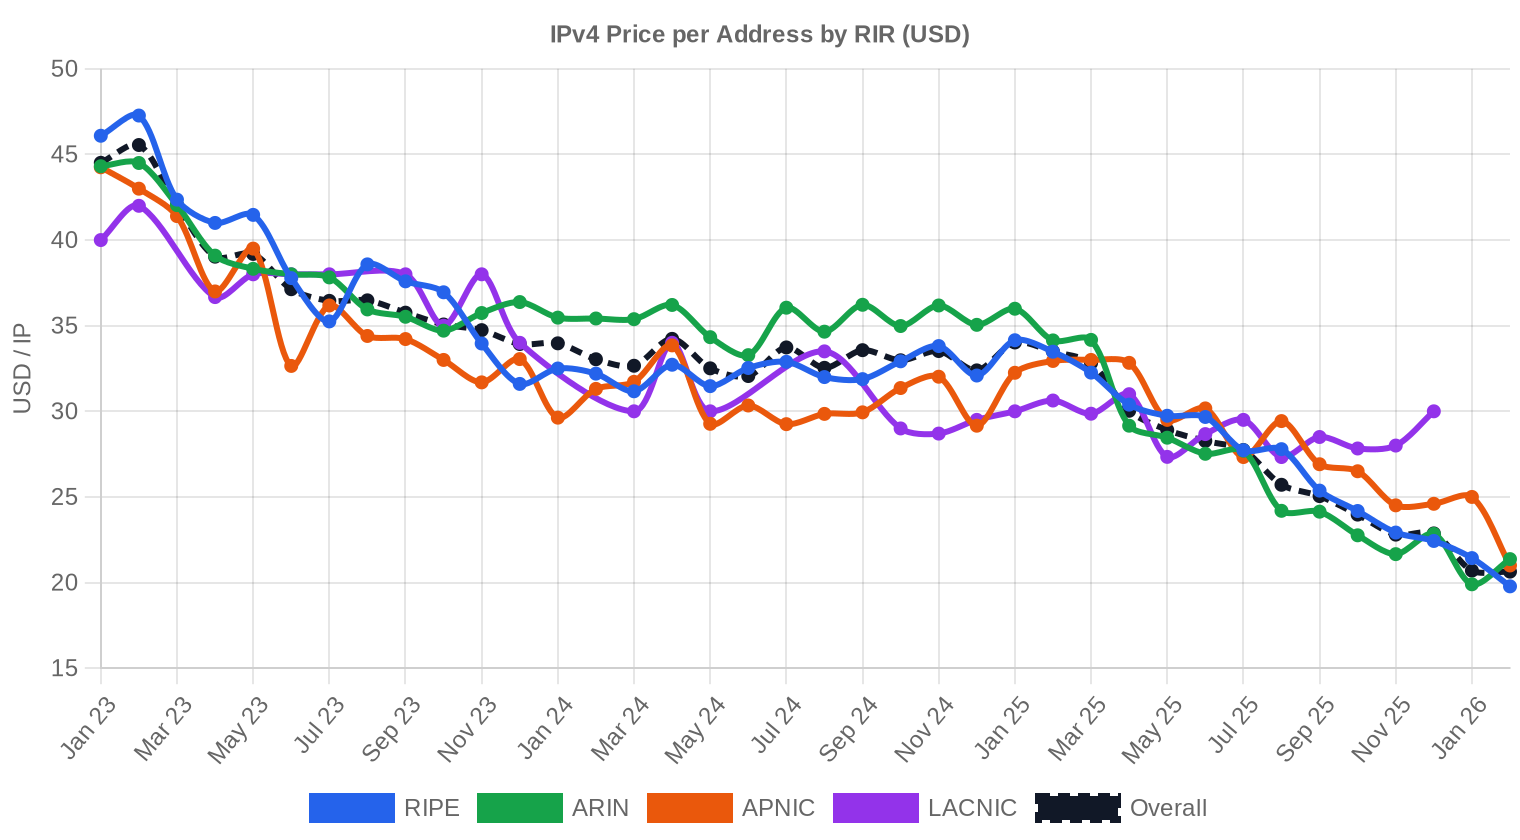
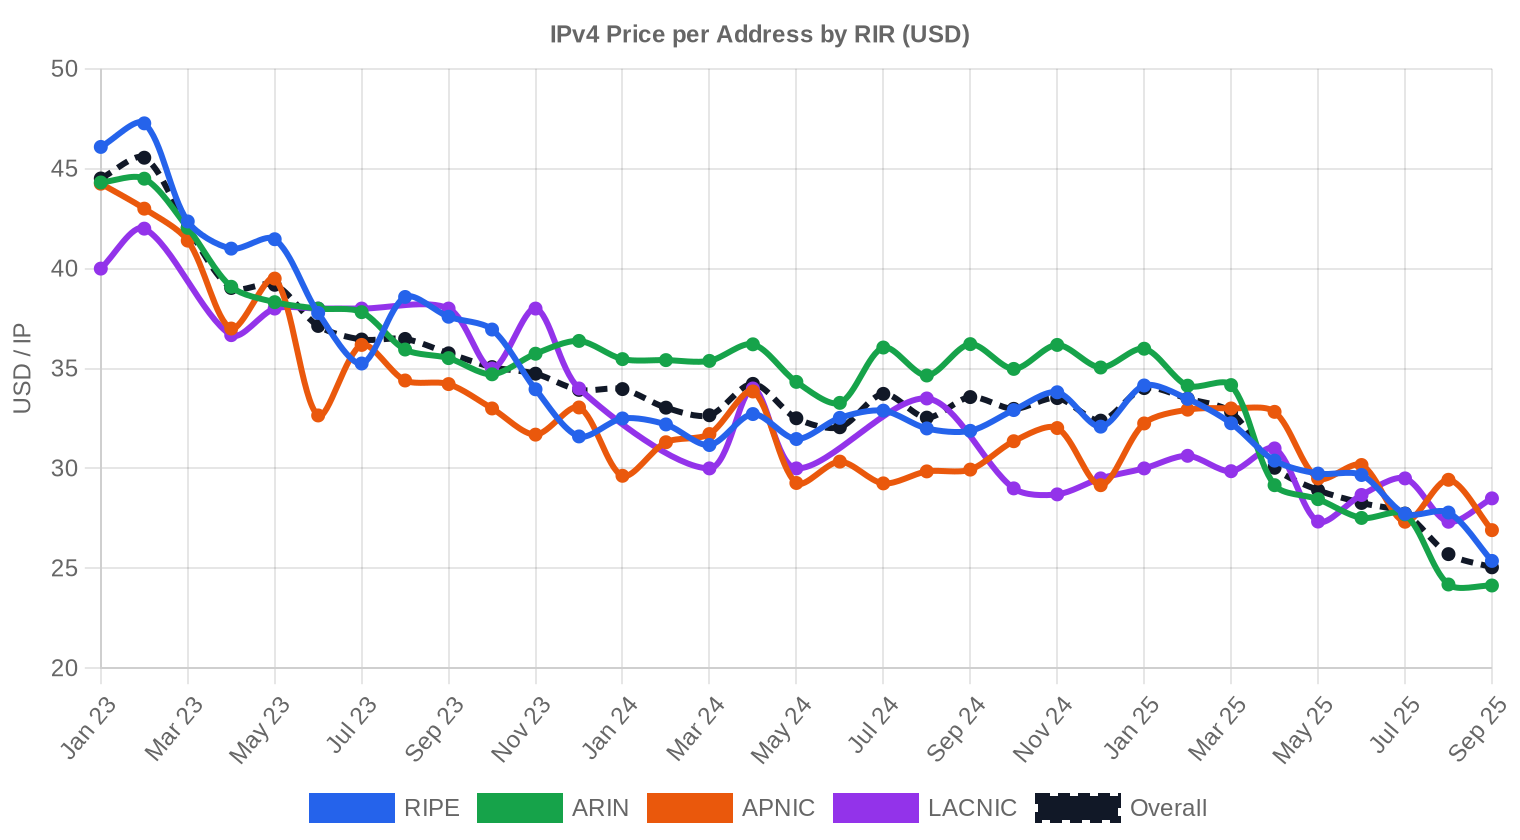
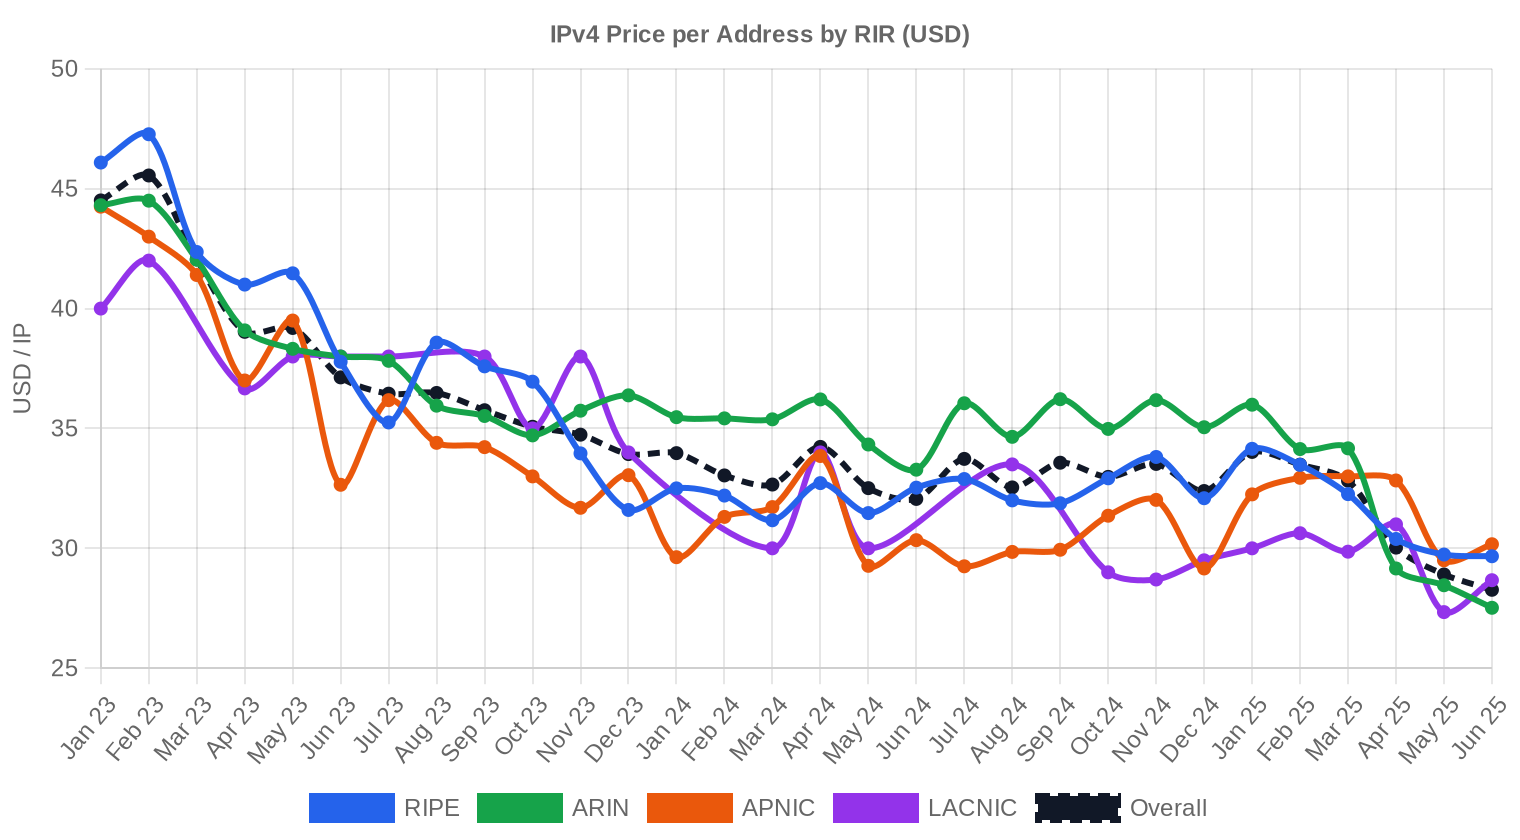
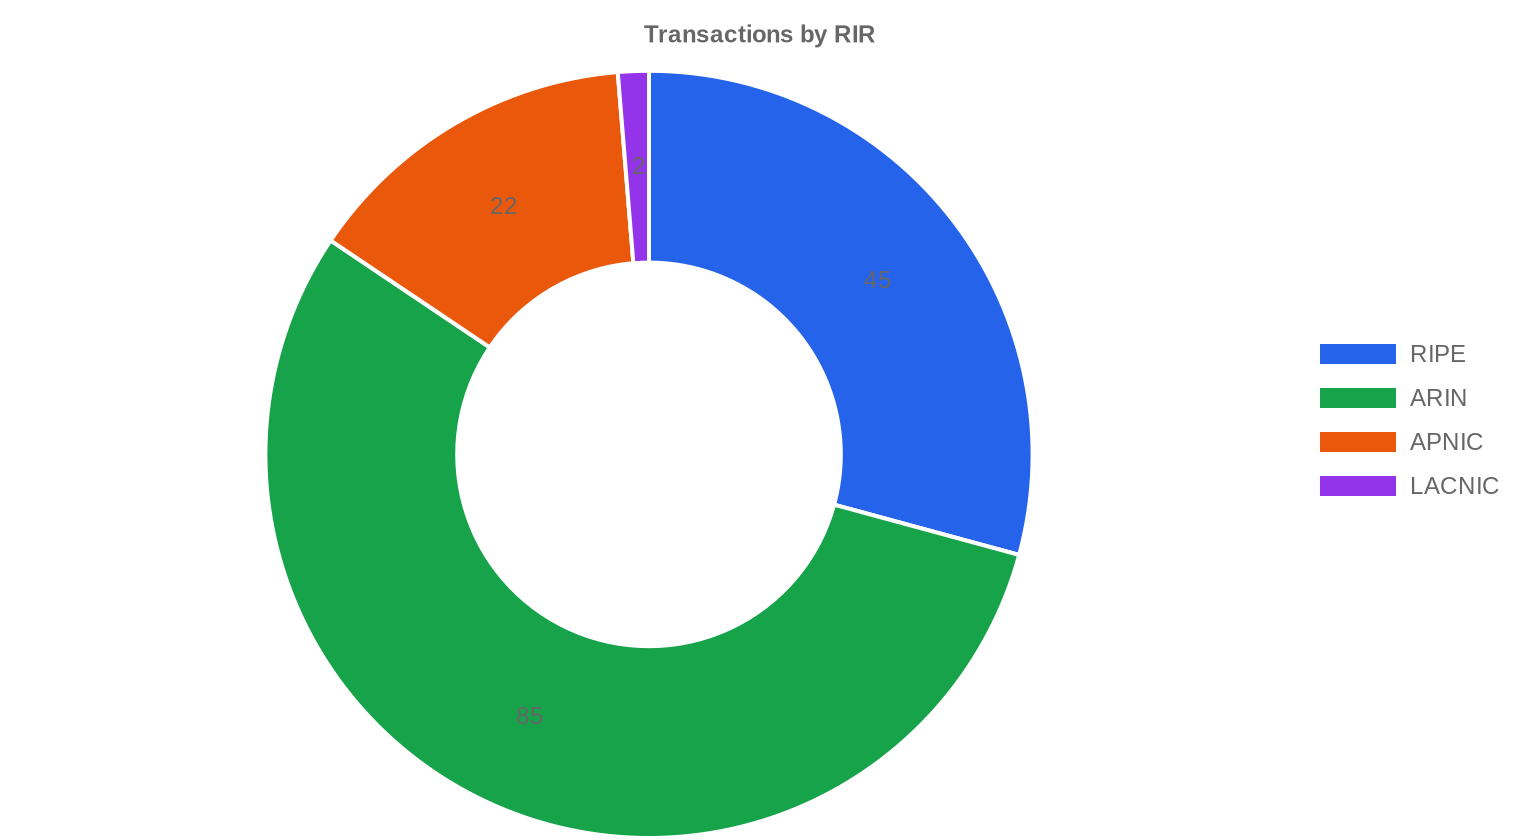
ARIN dominated Q3 deal flow with 55.2% of transactions, but LACNIC posted the highest per-IP pricing at $38. The gap between RIPE and ARIN has nearly closed, with RIPE averaging $36.98 versus ARIN's $36.22 — a convergence we have not seen this tight in recent quarters.ARIN: $36.22/IP across 85 transactions (55.2% of volume). Median of $36.50 with a $30–$48 range. The workhorse of the market, as usual.
RIPE: $36.98/IP across 45 transactions (29.2% of volume). The $29 minimum here is the global floor — some blocks are clearly moving at distressed levels.
APNIC: $34.97/IP across 22 transactions. The $50 max is the quarter's highest observed price, but the $33 median tells you most APNIC trades happened well below that outlier.
LACNIC: $38.00/IP on just 2 transactions covering 1,536 addresses. Tiny sample, but consistent pricing on both deals suggests a real clearing level, not noise.
AFRINIC: Zero transactions recorded. The transfer policy constraints continue to make this registry effectively illiquid.
| RIR | Transactions | Avg $/IP | Median $/IP | IPs Traded | RIR Transfers | Next Month (proj.) | Year-End (proj.) |
|---|---|---|---|---|---|---|---|
| RIPE | 45 | $36.98 | $37.00 | 40,192 | 1,117 | $37.00 | $37.00 |
| ARIN | 85 | $36.22 | $36.50 | 235,520 | 786 | $34.50 | $34.00 |
| APNIC | 22 | $34.97 | $33.00 | 16,640 | 0 | $33.00 | $33.00 |
| LACNIC | 2 | $38.00 | $38.00 | 1,536 | 0 | $38.00 | $37.50 |
Transaction Volume
Supply & Block Sizes
/24 blocks accounted for 62 of the 154 transactions — roughly 40% of deal count. This is the default unit for small buyers who need a single routable block for a specific use case, and the per-IP premium on these blocks remains substantial compared to larger allocations. Larger blocks (/20 and above) drove the bulk of total IP volume, consistent with ARIN's outsized share of total addresses transferred.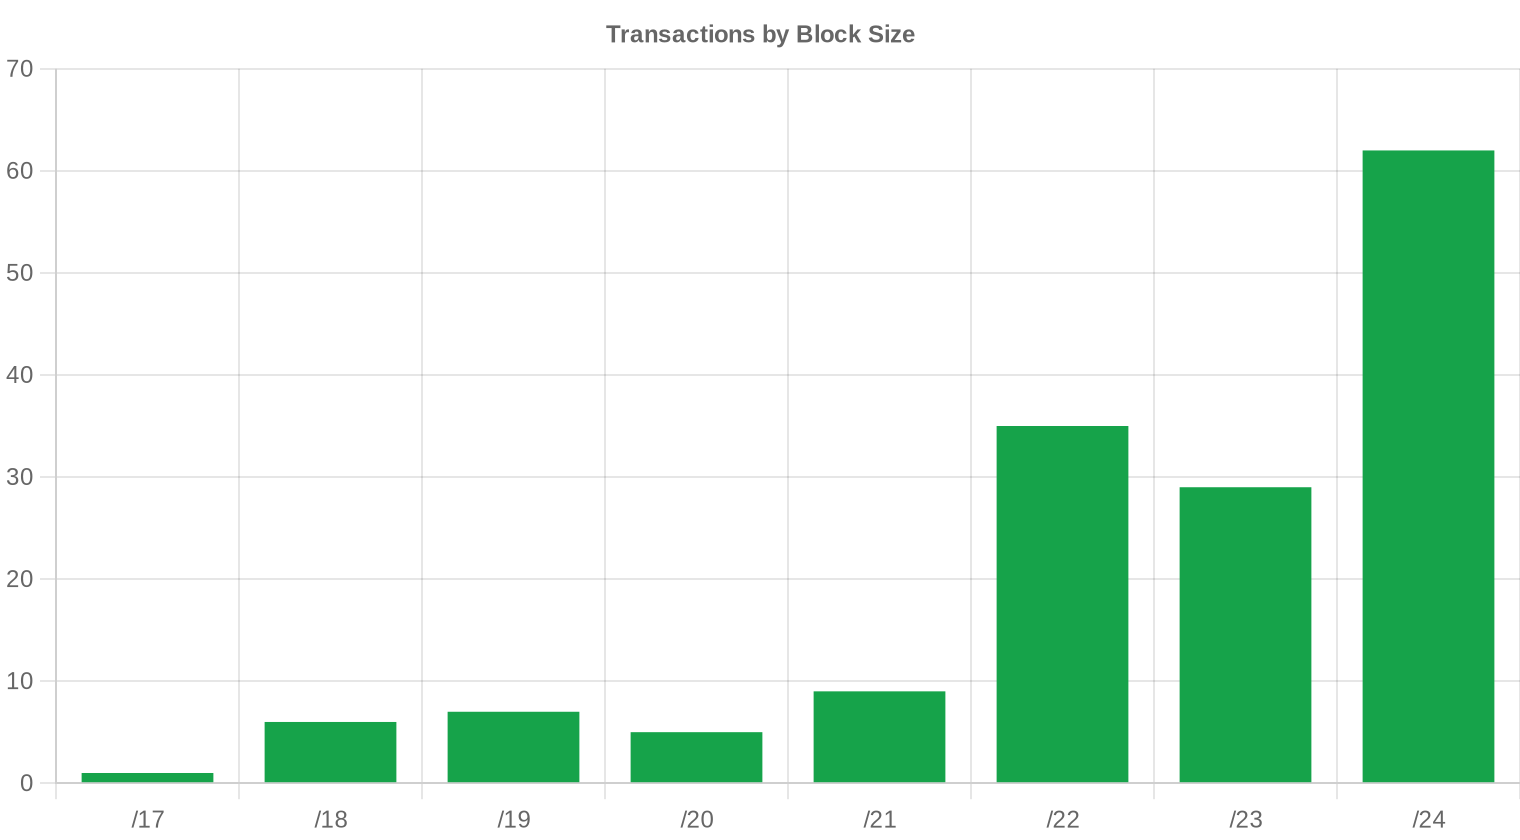
Geographic Activity
Country-level data was not captured in granular form this quarter. However, the RIR distribution — ARIN at 55.2%, RIPE at 29.2%, APNIC at 14.3% — serves as a reasonable proxy: North American and European buyers remain the primary demand drivers, with Asia-Pacific maintaining a steady minority share.Registry Transfer Activity
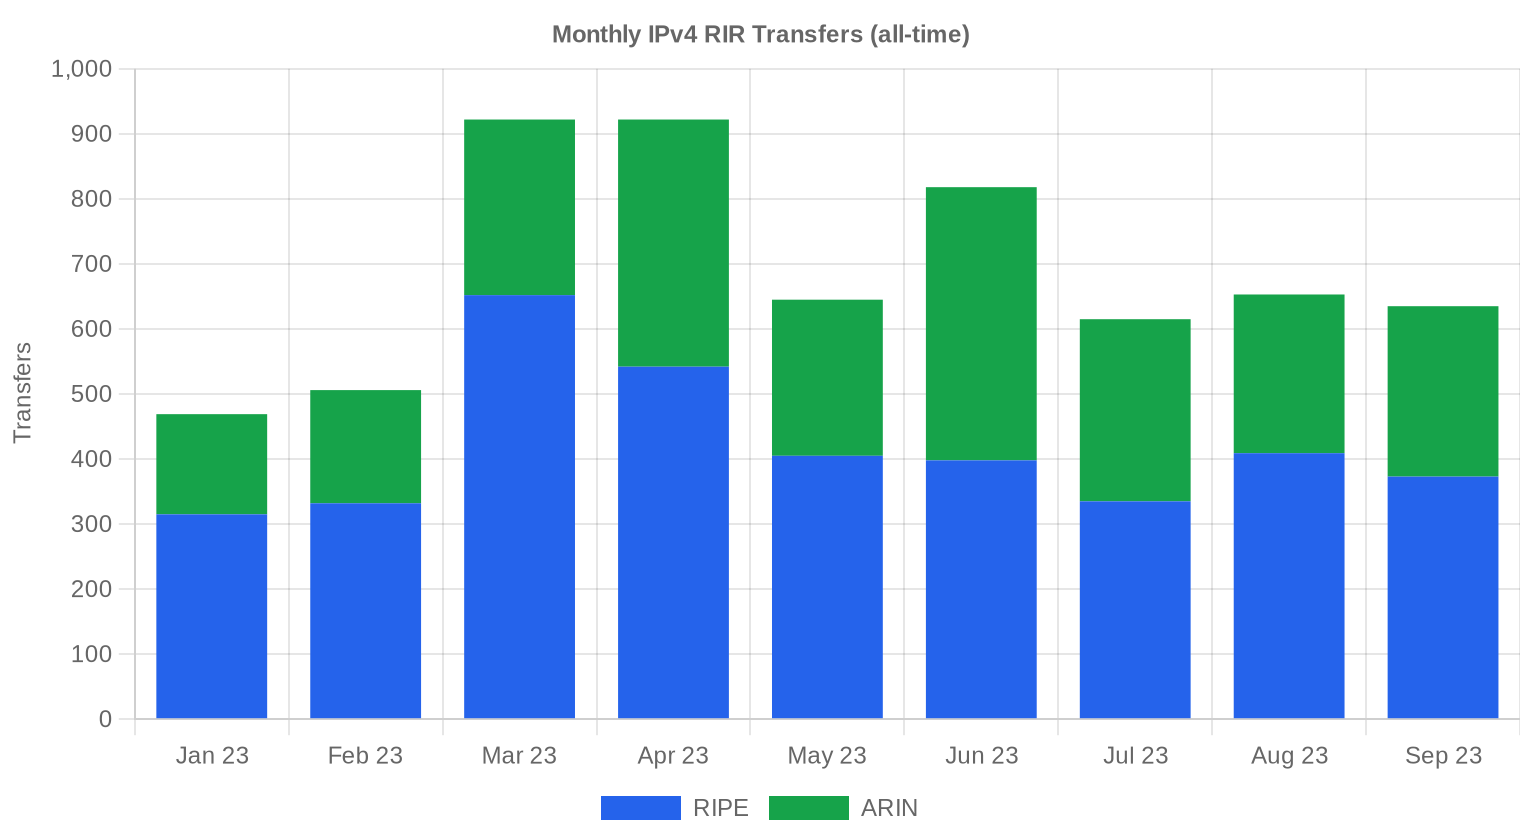
Official RIR transfer registries recorded 1,903 transfers in Q3 2023. RIPE led with 1,117 transfers (58.7% of the total), followed by ARIN at 786. The gap between RIPE and ARIN transfer counts reflects RIPE's more fragmented market — more transactions, but typically smaller blocks changing hands.Long-Run Transfer Trends
Over the trailing nine months, 6,185 total transfers have been logged across all registries. The peak month in that window was March 2023, which aligns with a seasonal pattern we have observed in prior years — Q1 budget deployments driving a transfer rush. RIPE accounted for 60.8% of cumulative transfers versus ARIN's 39.2%, reinforcing the structural split between Europe's fragmented market and North America's block-heavy approach.| RIR | RIR Transfers |
|---|---|
| RIPE | 3,761 |
| ARIN | 2,424 |
| RIR Transfers | 6,185 |
Outlook & Forecast
Forecasting each block-size band and RIR separately with our AI model:
The overall average price per IP is projected to reach $34.71 by December 2023, with a next-month estimate of $34.93 per IP.
- RIPE: projected at $37.00 per IP next month, trending toward $37.00 by December 2023.
- ARIN: projected at $34.50 per IP next month, trending toward $34.00 by December 2023.
- APNIC: projected at $33.00 per IP next month, trending toward $33.00 by December 2023.
- LACNIC: projected at $38.00 per IP next month, trending toward $37.50 by December 2023.
- AFRINIC: insufficient data for a reliable forecast.

Forecast by Block Size
| Block | Current $/IP | Next Month | Year-End | Confidence |
|---|---|---|---|---|
| /24 | $36.00 | $35.50 (-1.4%) | $35.00 (-2.8%) | medium |
| /23 | $33.50 | $33.00 (-1.5%) | $32.00 (-4.5%) | medium |
| /22 | $34.00 | $34.00 (0.0%) | $34.50 (+1.5%) | medium |
| /21 | $38.00 | $37.00 (-2.6%) | $37.00 (-2.6%) | low |
| /20 | $36.00 | $36.00 (0.0%) | $36.50 (+1.4%) | low |
| /19 | $37.50 | $37.00 (-1.3%) | $37.50 (0.0%) | low |
| /18-/16 | $36.00 | $36.00 (0.0%) | $36.50 (+1.4%) | low |
| /15-up | $51.50 | $50.00 (-2.9%) | $51.00 (-1.0%) | low |
Editor's Take: Buy vs. Lease
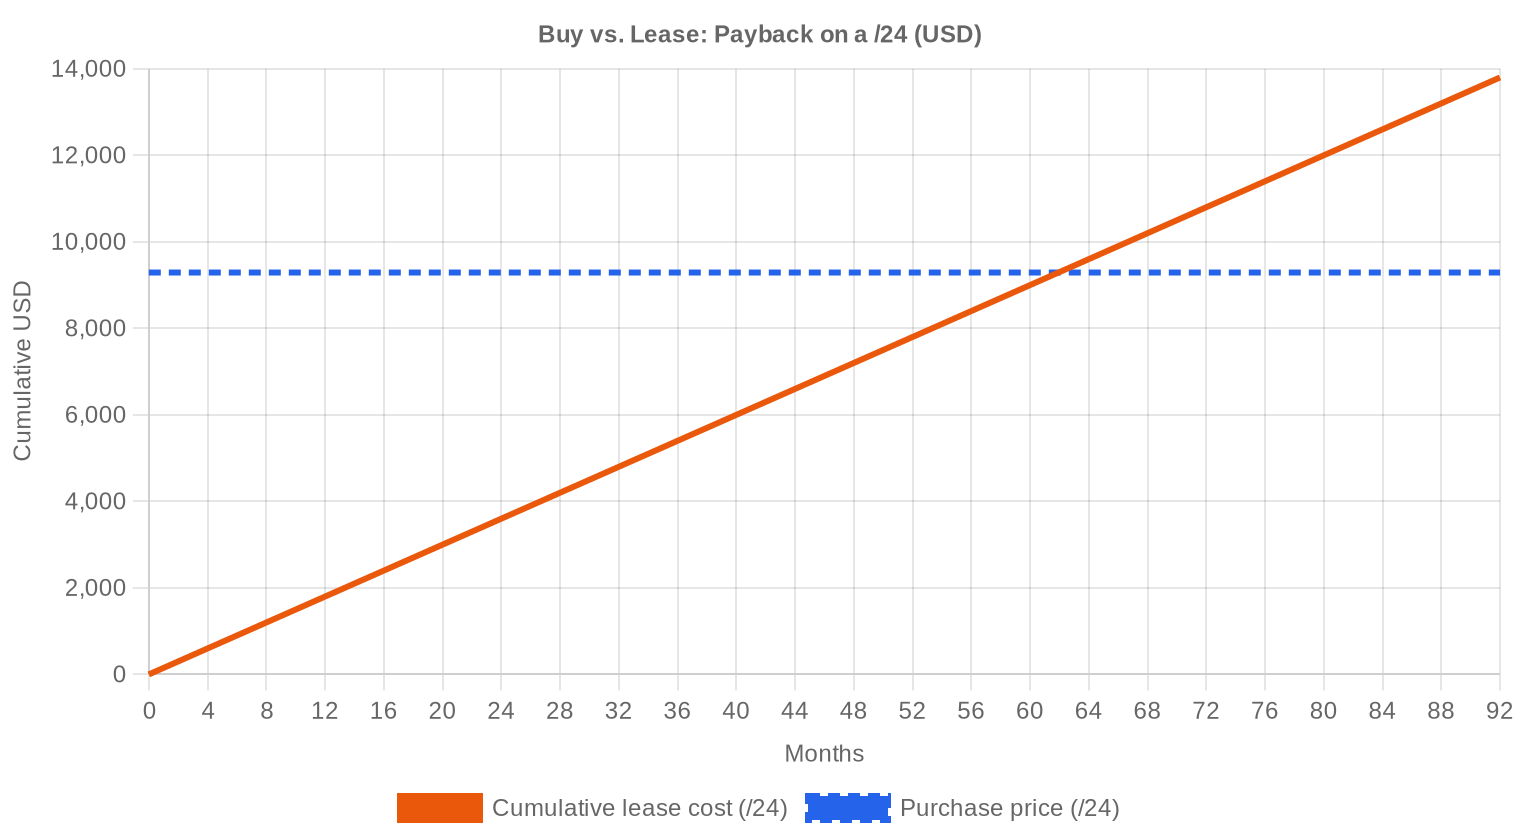
At $36.29/IP, a /24 block costs approximately $9,290. The lease market is quoting $0.59 per IP per month, or $150/month for a /24 — yielding a buy-versus-lease breakeven of 61.9 months, just over five years. For any organization with a planning horizon beyond five years, buying remains the clear call. The implied annual yield on a leased-out block sits at 19.4%, which is extraordinary by any asset-class standard and suggests lease rates have room to compress even if purchase prices decline further. Sellers sitting on unused space should be leasing, not selling, unless they need the capital immediately. Buyers should be locking in current purchase prices before Q4 — the forecast says prices drift lower, but the 42.6% volume surge signals that the buy side is already moving aggressively at these levels.| /24 Purchase price | $9,290 |
| /24 Lease price | $150 / mo |
| Payback period | 61.9 mo (5.2 yr) |
| Gross annual yield | 19.4% |
What This Means for You
Buyers: The 5.8% Q2-to-Q3 price decline and our year-end forecast of $34.71 suggest patience could save you a few points, but the volume surge tells you competition for blocks is intensifying. If you need space in the next six months, buy now and avoid bidding wars later. A /24 at $9,290 is historically cheap relative to 2022 levels.Sellers: Pricing leverage has shifted away from you this quarter. The $29 floor transactions in RIPE are setting a psychological anchor for buyers. If you are holding clean ARIN or LACNIC blocks, you still command a premium — but time is not your friend in a declining market. Price your blocks to trade, not to sit.
Leasers: At $0.59/IP/month, lease economics remain compelling for short-duration needs under five years. But the 19.4% implied yield means lease rates are rich relative to purchase prices. Expect some downward pressure on lease pricing as the buy-vs-lease math becomes more widely understood.
Block holders: If you are not actively using your space, leasing at current rates generates a 19.4% annual return on asset value. That beats every conventional fixed-income instrument by a wide margin. Do not let blocks sit idle.
Browse verified IPv4 blocksSell IPv4 →
List your blocks with managed transferLease IPv4 →
Flexible short-term capacityLease Out IPv4 →
Turn idle blocks into recurring revenue
IPv4 Pricing by Block Size
The /24 market remains the most liquid segment, accounting for 40% of transactions at roughly $9,290 per block. Per-IP premiums on /24s run 15–25% above the rates achieved on /20 and larger blocks, where bulk discounts pull the effective price toward the $30–$33 range. Buyers with flexibility on block size should target /22 or /21 allocations for the best cost-per-IP, while sellers holding /24s can extract the small-block premium that retail buyers willingly pay.| Block | IPs | Buy: /IP | Buy: Total | Lease: /IP/mo | Lease: Monthly |
|---|---|---|---|---|---|
| /24 | 256 | $35–45 | $8,960–11,520 | $0.38–0.50 | $97–128 |
| /22 | 1,024 | $28–38 | $28,672–38,912 | $0.33–0.45 | $338–461 |
| /20 | 4,096 | $22–32 | $90,112–131,072 | $0.30–0.40 | $1,229–1,638 |
| /18 | 16,384 | $20–30 | $327,680–491,520 | $0.30–0.38 | $4,915–6,226 |
| /16 | 65,536 | $18–28 | $1,179,648–1,835,008 | $0.30–0.35 | $19,661–22,938 |
IPv4 Price History: 2011–2026
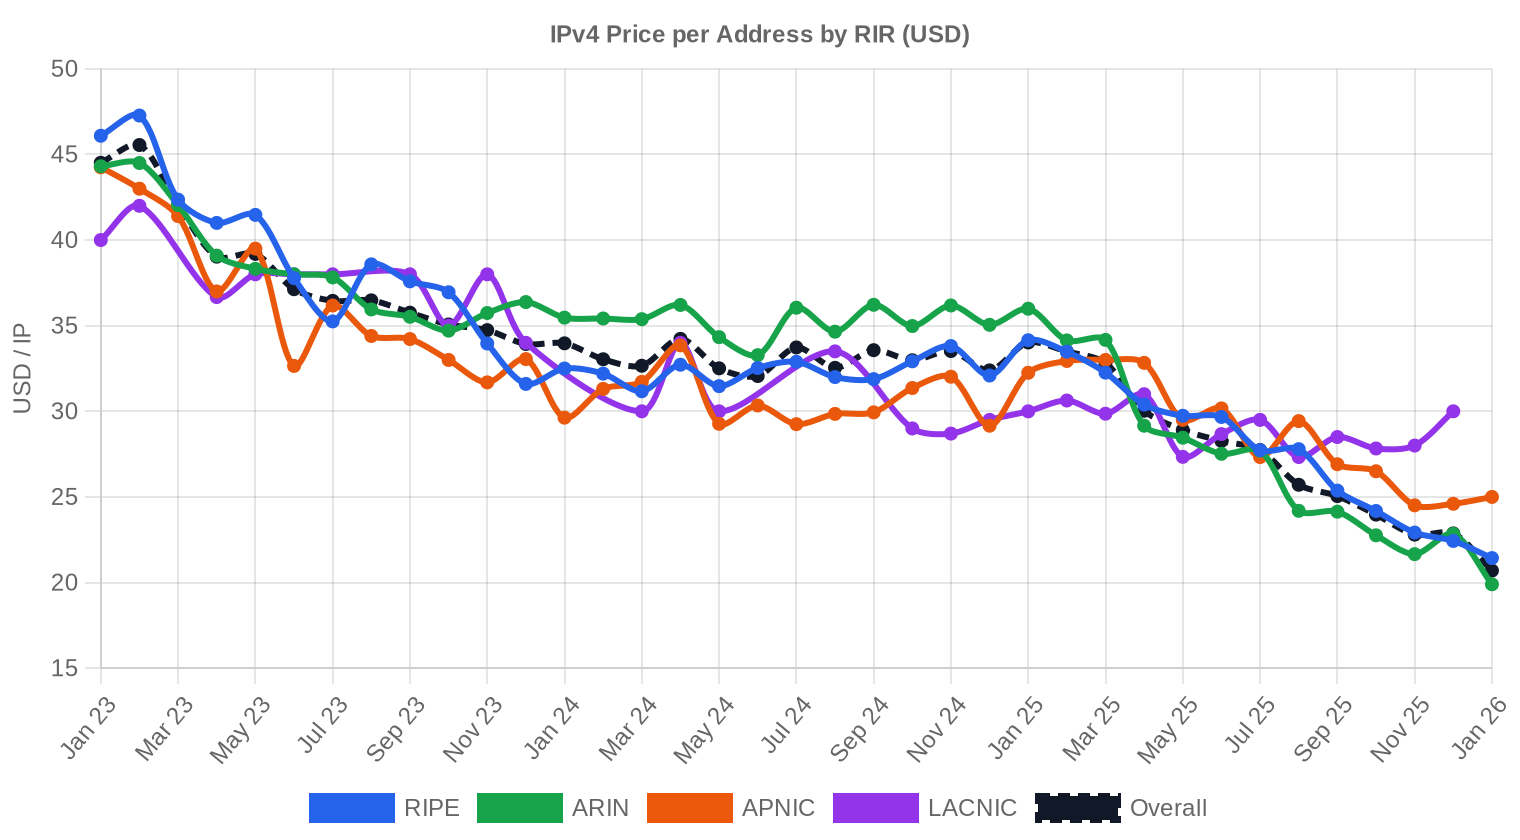
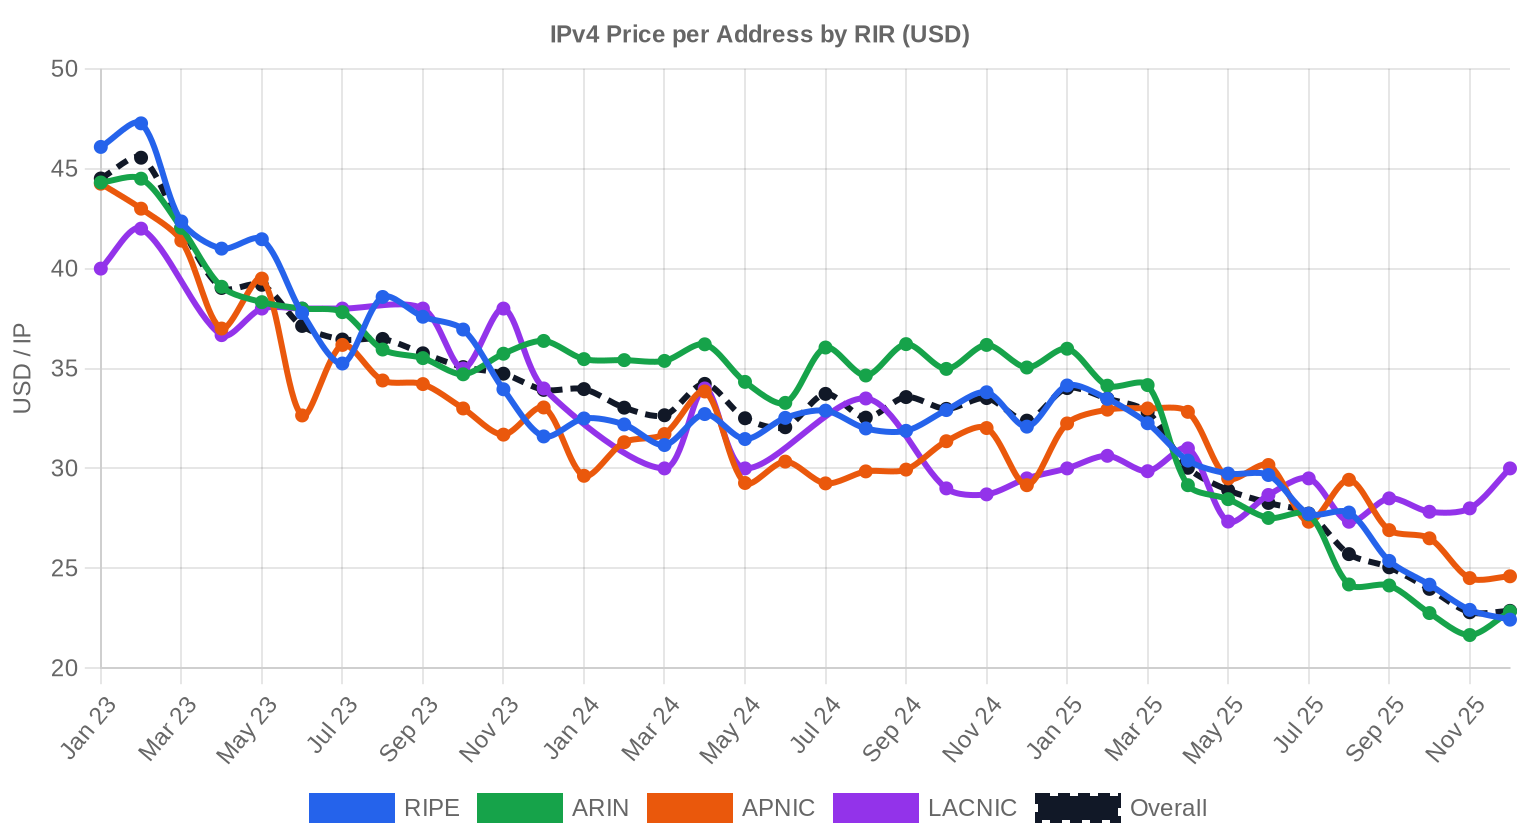
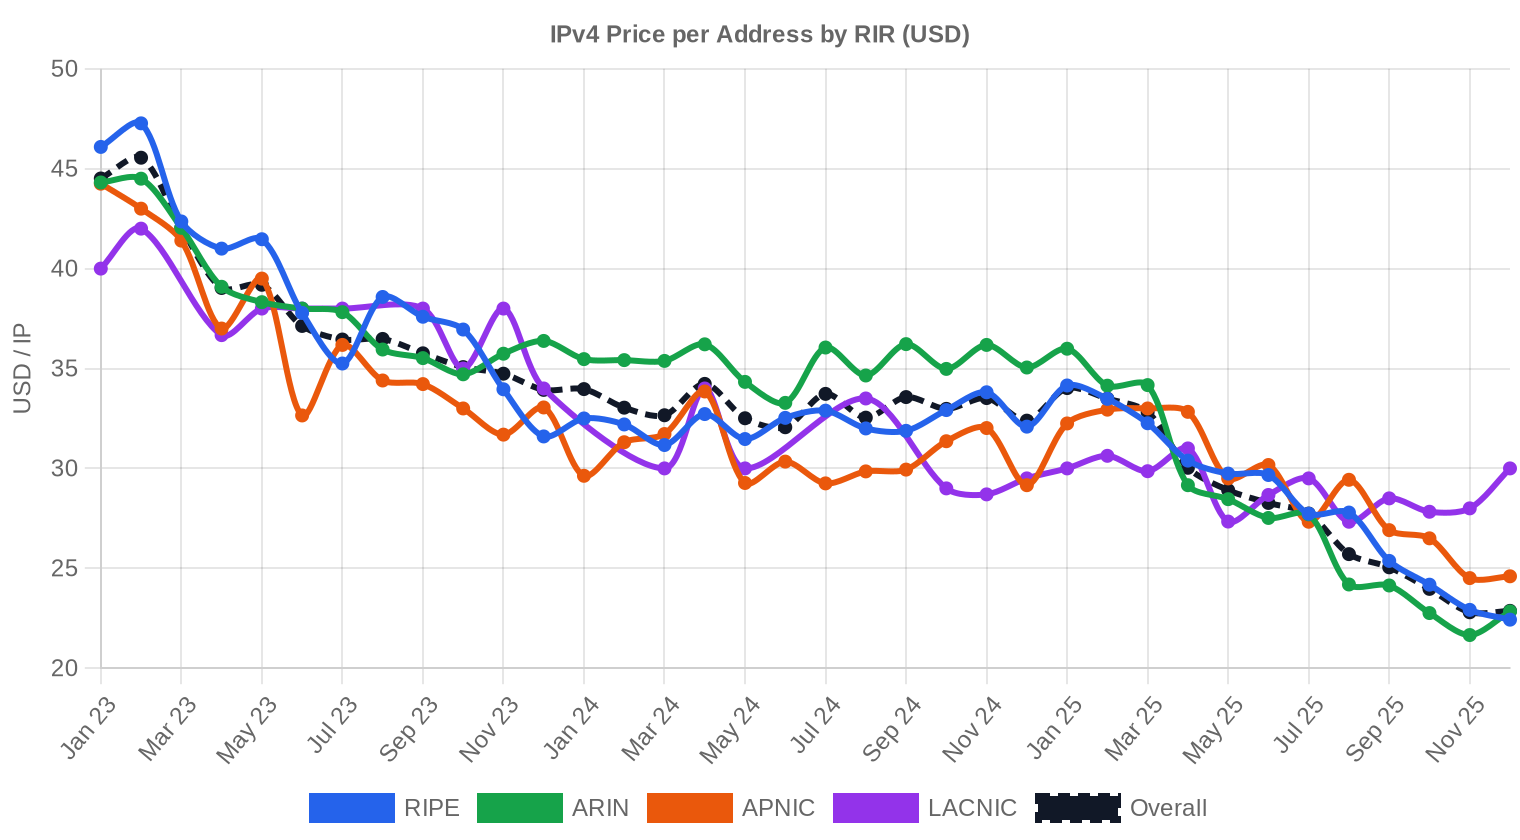
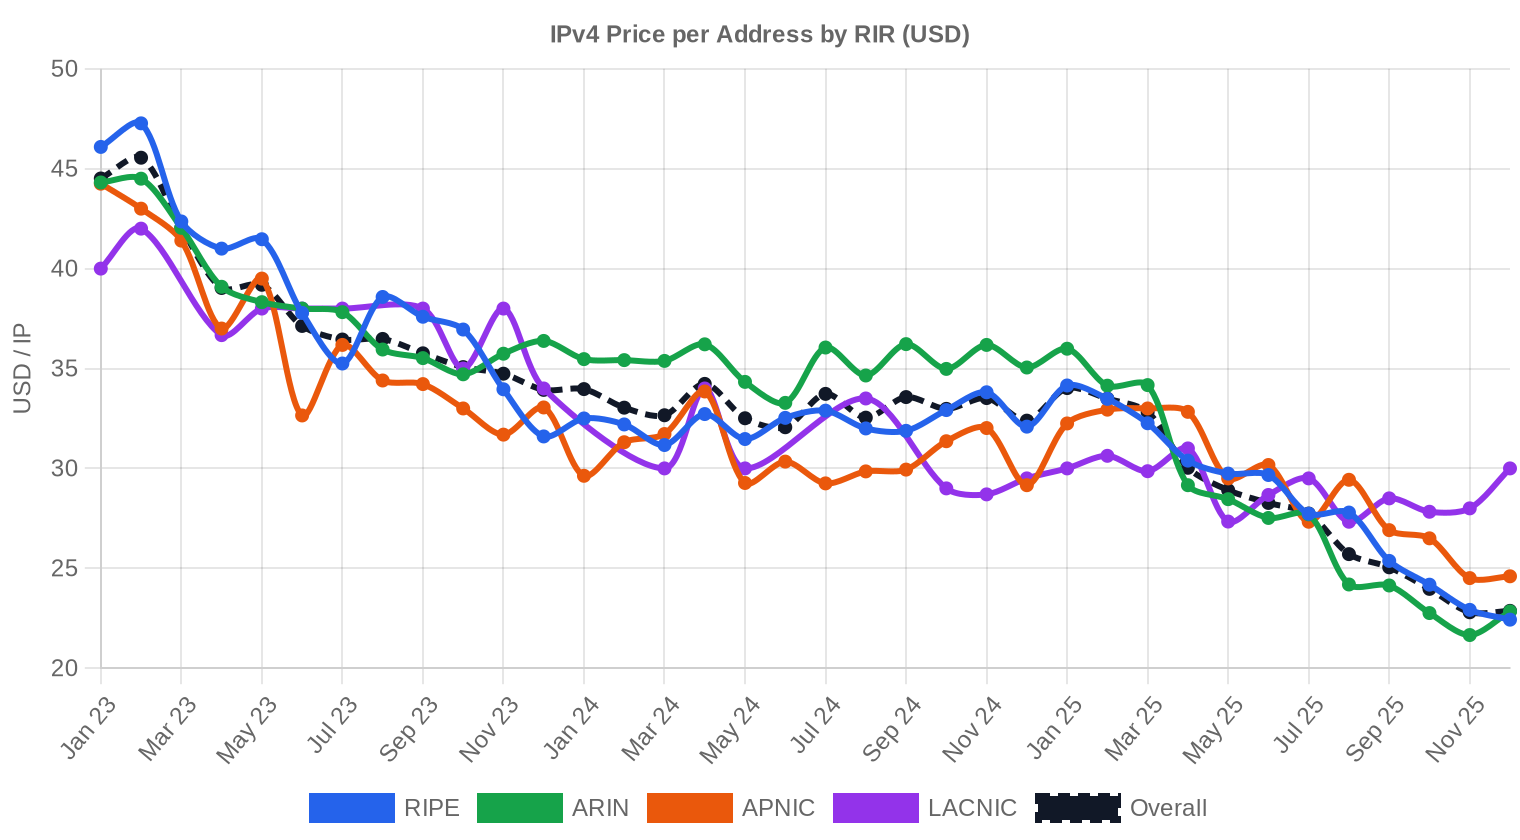
IPv4 addresses first acquired meaningful market value after IANA free-pool exhaustion in 2011, with early transactions clearing in the $5–$8 range. Prices climbed steadily through the mid-2010s, accelerated sharply in 2021 and early 2022, and peaked near $55–$60/IP in some segments. The market began cooling in late 2022, partly driven by AWS's announcement of charges for public IPv4 addresses, which forced enterprises to audit usage and release unused space. Q3 2023's $36.29 average represents roughly a 35–40% decline from peak levels, and the market appears to be searching for a new equilibrium in the mid-$30s.| Year | ~Price/IP | Key Event |
|---|---|---|
| 2011 | $7–12 | IANA free pool exhausted; Microsoft/Nortel deal ($11.25/IP) |
| 2012 | $8–12 | RIPE NCC reaches last /8; begins /22-only allocation |
| 2014 | $10–15 | LACNIC free pool exhausted |
| 2015 | $8–15 | ARIN free pool exhausted |
| 2017–18 | $12–18 | Leasing market grows; cloud demand rises |
| 2019 | $18–24 | RIPE NCC exhausts remaining free pool |
| 2021–22 | $50–60+ | Post-pandemic peak; hyperscaler build-outs |
| 2024 | $35–52 | AWS IPv4 charge ($0.005/IP/hr); large block correction |
| 2025–26 | $18–45 | Market bifurcation; /16s below $20 for first time since 2019 |
Market Structure: Who Is Buying & Selling
The buy side continues to be dominated by cloud infrastructure providers, mid-tier ISPs expanding coverage areas, and hosting companies spinning up new capacity. On the sell side, legacy corporate holders — companies that received large allocations decades ago and never fully utilized them — remain the primary source of supply. Bankruptcy liquidations and M&A-related divestitures contribute intermittently but are difficult to predict quarter to quarter.IPv4 vs. Other Asset Classes
At a 19.4% implied annual yield from leasing, IPv4 blocks outperform virtually every conventional asset class. The 10-year Treasury was yielding roughly 4.6% at the end of Q3 2023; commercial real estate cap rates in major markets sit at 5–7%. The risk profile is different — IPv4 is an illiquid, depreciating-technology asset — but on a pure cash-yield basis, few investments generate this kind of return on a sub-$10,000 entry point.| Asset Class | Typical Yield | Liquidity | Primary Risk |
|---|---|---|---|
| IPv4 | 19.4% | Moderate | IPv6 adoption, block quality |
| Commercial Real Estate | 5–8% | Low | Vacancy, rate cycle |
| Investment-Grade Bonds | 4–5% | High | Duration, credit risk |
| S&P 500 | ~1,3% | High | Market volatility |
| Money Market / T-Bills | ~4–5% | High | Rate cycle changes |
IPv6 Adoption & Why IPv4 Remains Essential
IPv6 adoption continues its glacial pace. Google's public data shows IPv6 capability at roughly 40% of users globally, but corporate and infrastructure adoption lags well behind that figure. The dual-stack reality — where both protocols coexist — is now the consensus baseline assumption for network planning through at least the late 2020s. As long as legacy systems, IoT devices, and large swaths of enterprise infrastructure require IPv4 connectivity, demand for addresses persists.AI & Cloud Infrastructure Demand
The buildout of AI training clusters and inference infrastructure is a net-positive for IPv4 demand, though the effect is concentrated among a handful of hyperscale buyers. Each new GPU cluster deployment requires management network addressing, monitoring infrastructure, and API endpoint space. The volume impact in Q3 is difficult to isolate from broader cloud expansion, but conversations with brokers confirm that AI-adjacent infrastructure projects are showing up as a distinct demand category.What Determines IPv4 Block Value
Block valuation depends on several factors beyond size. Clean blacklist history, allocation age (older blocks from the 1990s tend to carry less spam baggage), and RIR transferability rules all affect pricing. ARIN blocks generally clear fastest due to straightforward transfer mechanics, while RIPE blocks face the 24-month holding rule. Blocks with documented usage history and no abuse complaints routinely command $2–$4/IP premiums over comparable blocks with unknown provenance.Sell vs. Lease: A Decision Framework
In a declining price environment, holders face a clear trade-off: sell now at $36/IP and lock in the capital, or lease at 19.4% annually and bet that the asset retains enough value to justify the hold. For blocks you expect to hold for three or more years, leasing is the superior strategy — the cumulative lease income exceeds the likely price decline. If you need liquidity or believe prices will fall below $30 within 18 months, sell now.| /24 Purchase price | $9,290 |
| /24 Lease price | $150 / mo |
| Payback period | 61.9 mo (5.2 yr) |
| Gross annual yield | 19.4% |
RIPE NCC 24-Month Transfer Restriction
RIPE's 24-month holding period before re-transfer constrains speculative trading and limits the velocity of block turnover within the RIPE service region. This rule effectively creates a two-tier supply dynamic: blocks already past the holding period trade freely, while recently acquired blocks are locked up. The practical effect is a modest supply squeeze in RIPE — and RIPE's $36.98 average this quarter, slightly above ARIN's $36.22, reflects that friction.Deal Size Distribution
Average deal size grew to $71,485 in Q3, up 18% from Q2's $60,602 — indicating larger blocks are moving. The bulk of transactions (126 of 154) fell under $50,000, totaling $2.4 million. But the heavyweight end drove most of the dollar volume: 13 deals in the $250K–$1M band accounted for $5.6 million, and a single deal exceeded $1 million. This top-heavy distribution is typical of a market where institutional buyers coexist with small operators picking up individual /24s.Top Trading Countries
Granular country-level data is unavailable for Q3 2023. The RIR distribution — ARIN at 55%, RIPE at 29%, APNIC at 14% — suggests the United States, Germany, the Netherlands, and the UK remain the most active markets. These countries combine high hosting density with mature transfer ecosystems, making them natural centers of IPv4 trading activity.BEAD Broadband Program Impact
The $42.5 billion BEAD program is still in its planning and allocation phase as of Q3 2023, with state-level proposals under review. When deployment begins in earnest — likely mid-2024 through 2026 — expect meaningful demand for /20 to /16 blocks as rural ISPs and fixed-wireless providers build out new subscriber bases. This program alone could absorb several million addresses from the market, and smart buyers are already positioning for it.Hyperscaler IPv4 Holdings
Amazon, Microsoft, and Google collectively hold tens of millions of IPv4 addresses. AWS's February 2024 public IPv4 charge (announced in mid-2023) is already reshaping behavior — customers are releasing Elastic IPs they do not need, which paradoxically increases AWS's internal supply while reducing external market demand from AWS customers. If any hyperscaler decides to monetize even a fraction of their holdings, the supply impact could be significant. For now, they appear to be holding.Macroeconomic Conditions & Market Impact
Q3 2023 saw the Fed hold rates at 5.25–5.50%, with enterprise IT budgets under sustained pressure from tighter capital conditions. Higher cost of capital makes the buy-vs-lease calculation more nuanced — the opportunity cost of deploying $9,290 on a /24 is higher when money-market funds yield 5%. The 42.6% volume surge despite these headwinds suggests that operational necessity is overriding financial caution for many buyers; they need addresses regardless of macro conditions.Methodology
Figures are based on completed IPv4Center marketplace transactions and RIR transfer statistics. Prices are in US dollars per IP address. Forecasts are produced by an AI model that analyses each block-size band and RIR segment separately (with outlier-trimmed medians) alongside known market catalysts; they are estimates, not guarantees.
Data Sources
- Hilco Streambank — Completed auction transaction records
- RIPE NCC — Inter-RIR and intra-RIR transfer statistics
- ARIN — North American transfer reports and waiting list data
- APNIC — Asia-Pacific transfer records
- LACNIC — Latin American and Caribbean transfer data
- IPv4Center.com — Proprietary marketplace transaction and lease pricing data
This report is generated automatically for informational purposes only and does not constitute financial advice.
Frequently Asked Questions
What was the average price per IPv4 address in Q3 2023?
The market-wide average landed at .29 per IP, with a median of . This represents a modest -0.28% decline from the prior period — not a rout, but a clear signal that the post-pandemic pricing frenzy has cooled.
How many IPv4 transfer transactions were recorded in Q3 2023?
We tracked 154 priced transactions covering 293,888 addresses for a total market value of approximately .0 million. Separately, 1,903 total transfers (including non-priced administrative moves) were logged across all RIRs.
Which RIR commanded the highest per-IP prices this quarter?
LACNIC blocks fetched the highest average at .00 per IP, though on razor-thin volume — just 2 transactions covering 1,536 addresses. RIPE came in second at .98. Buyers paying a premium for Latin American space likely reflects acute regional scarcity.
Why did ARIN dominate transaction volume in Q3 2023?
ARIN accounted for 55.2% of all priced transactions (85 deals, 235,520 IPs, ~.9 million in value). North American blocks remain the most liquid asset class in the market — deep buyer pools, well-understood transfer policies, and relatively fast processing times keep ARIN at the center of gravity.
How did RIPE NCC pricing compare to ARIN this quarter?
RIPE averaged .98 versus ARIN's .22 — a spread of roughly .76 per IP. RIPE's price floor was lower ( vs. ), but its ceiling was comparable ( vs. ). The narrowing gap suggests convergence in transatlantic pricing.
What was the price range observed across all deals in Q3 2023?
The global floor was per IP (a RIPE transaction) and the ceiling was (an APNIC deal). That spread — roughly 72% of the minimum — underscores how much block size, RIR, and buyer urgency still matter.
Were APNIC blocks cheaper than other regions this quarter?
Yes. APNIC averaged .97 per IP with a median of just , the lowest among active RIRs. However, the region also posted the single highest individual transaction price at , suggesting a barbell distribution — small premium blocks at the top, larger commodity lots dragging the average down.
What was the most common block size traded in Q3 2023?
/24 blocks dominated with 62 transactions — roughly 40% of all deals. This is the atomic unit of BGP routability and remains the workhorse of the market, particularly for smaller enterprises and hosting providers.
What does the average deal size of ~,500 tell us about market composition?
At an average deal size of approximately ,485, the market skews toward mid-sized institutional buyers. But 126 of 154 transactions (82%) fell below ,000, confirming that the long tail of small-block retail demand still drives the bulk of deal flow.
How did deal sizes break down by value band?
Sub-K deals dominated by count (126 transactions) but contributed only .4 million. The 0K–M band punched above its weight: 13 deals generated .6 million, or 51% of total market value. A single transaction exceeded million at roughly .19 million.
Is the IPv4 market trending up or down heading into Q4 2023?
Down, incrementally. Our model forecasts an average of .93 for the next month and .71 by year-end 2023. The Q3 decline of -0.28% is shallow, but the direction is consistent — expect gentle price erosion, not a cliff.
How reliable is the year-end price forecast of .71?
We flag this forecast as reliable based on transaction density and model fit. That said, 'reliable' means directionally sound — not precise to the penny. A demand shock from a hyperscaler or a sudden supply release could easily move the number by –2.
What mistakes should buyers avoid in the current softening market?
The cardinal sin is overpaying for urgency. With prices trending toward .71 by December, a buyer locking in at + is effectively prepaying six quarters of depreciation. Unless operational need is immediate, patience has a measurable return right now.
What are the risks of waiting too long to buy IPv4 addresses?
The forecast points down, but supply is finite and lumpy. Large enterprise buyers can vacuum up available inventory in a single quarter, temporarily inverting the market. Waiting saves money on average, but introduces execution risk — the specific block you need may not be there next quarter.
Should I buy or lease IPv4 addresses at current Q3 2023 rates?
Buy, if your time horizon exceeds 5.2 years. At a purchase price of .29 versus a lease rate of .5859/IP/month, the breakeven is approximately 62 months. The implied annual yield on leasing is 19.4% — generous for lessors, expensive for long-term lessees.
What is the current lease rate for a /24 block?
Based on 44 observed lease transactions (predominantly RIPE), the going rate is approximately 0 per month for a /24, or .5859 per IP per month. Annualized, that's about .03 per IP — roughly 19% of the purchase price.
What are the risks of leasing rather than buying at these prices?
At 19.4% implied annual cost, leasing is effectively high-yield financing. Over five years you'll pay more than the outright purchase price with no asset to show for it. Leasing makes sense for short-term projects or bridge needs; for infrastructure with a 5+ year life, it's value-destructive.
How many total transfers (including non-sale) were processed in Q3 2023, and which RIR led?
A total of 1,903 transfers were recorded. RIPE led administrative transfer volume with a 60.8% share, followed by ARIN at 39.2%. APNIC, LACNIC, and AFRINIC registered zero non-sale transfers in our dataset. RIPE's dominance in transfers reflects both its intra-RIR policy framework and heavy European M&A activity.
Was there any IPv4 trading activity in the AFRINIC region during Q3 2023?
Zero. No priced transactions and no recorded transfers. AFRINIC's ongoing governance challenges and policy uncertainty continue to effectively freeze its transfer market. Buyers seeking African-routable space are largely routing ARIN or RIPE blocks instead.
Why hasn't IPv6 adoption killed IPv4 prices yet?
Because IPv6 adoption, while growing, has not reached the threshold where enterprises can safely decommission IPv4 infrastructure. As long as significant portions of the internet — particularly legacy enterprise networks, IoT deployments, and developing-market ISPs — remain IPv4-dependent, the address space retains utility value. Prices are softening, not collapsing, which tells you the market is pricing in a very long transition.
What should sellers be aware of in a declining-price environment?
Time is not your friend. If the year-end forecast of .71 holds, a seller sitting on inventory today at .29 is losing roughly .58 per IP in implied value over the next 90 days. Accelerating disposition timelines — even at a modest discount to spot — is rational portfolio management.
How long does a typical IPv4 transfer take to complete?
Timelines vary by RIR. ARIN transfers typically close in 3–6 weeks given their rigorous needs-assessment process. RIPE intra-RIR transfers can clear in 2–4 weeks. Cross-RIR transactions and APNIC deals often stretch to 6–10 weeks. Buyers should factor processing time into procurement planning, especially in a softening market.
What drove the single transaction above million this quarter?
One deal cleared at approximately .19 million, likely a large contiguous ARIN block given that region's dominance in big-ticket flow. Transactions at this scale typically involve enterprise buyers consolidating address space for cloud infrastructure or ISPs acquiring customer-facing inventory. Specific counterparty details are confidential.
Is now a good time for financial investors to enter the IPv4 market?
The buy-and-lease thesis still pencils at 19.4% annual yield — attractive by any fixed-income standard. However, with spot prices forecast to decline toward .71 by year-end, the capital-gain component is negative. Pure yield investors should be comfortable with a depreciating asset; total-return seekers may want to wait for price stabilization.
What's the risk of buying LACNIC blocks at the current premium?
LACNIC volume is paper-thin — two transactions totaling 1,536 IPs. That premium is built on scarcity, not liquidity. Buyers face meaningful resale risk: if you need to exit, finding a counterparty at in a region with negligible deal flow is nontrivial. Price discovery is unreliable at this sample size.