15 min read
This report analyzes the IPv4 transfer market for Q1 2024, based on completed IPv4Center marketplace transactions and official RIR transfer records.
Executive Summary
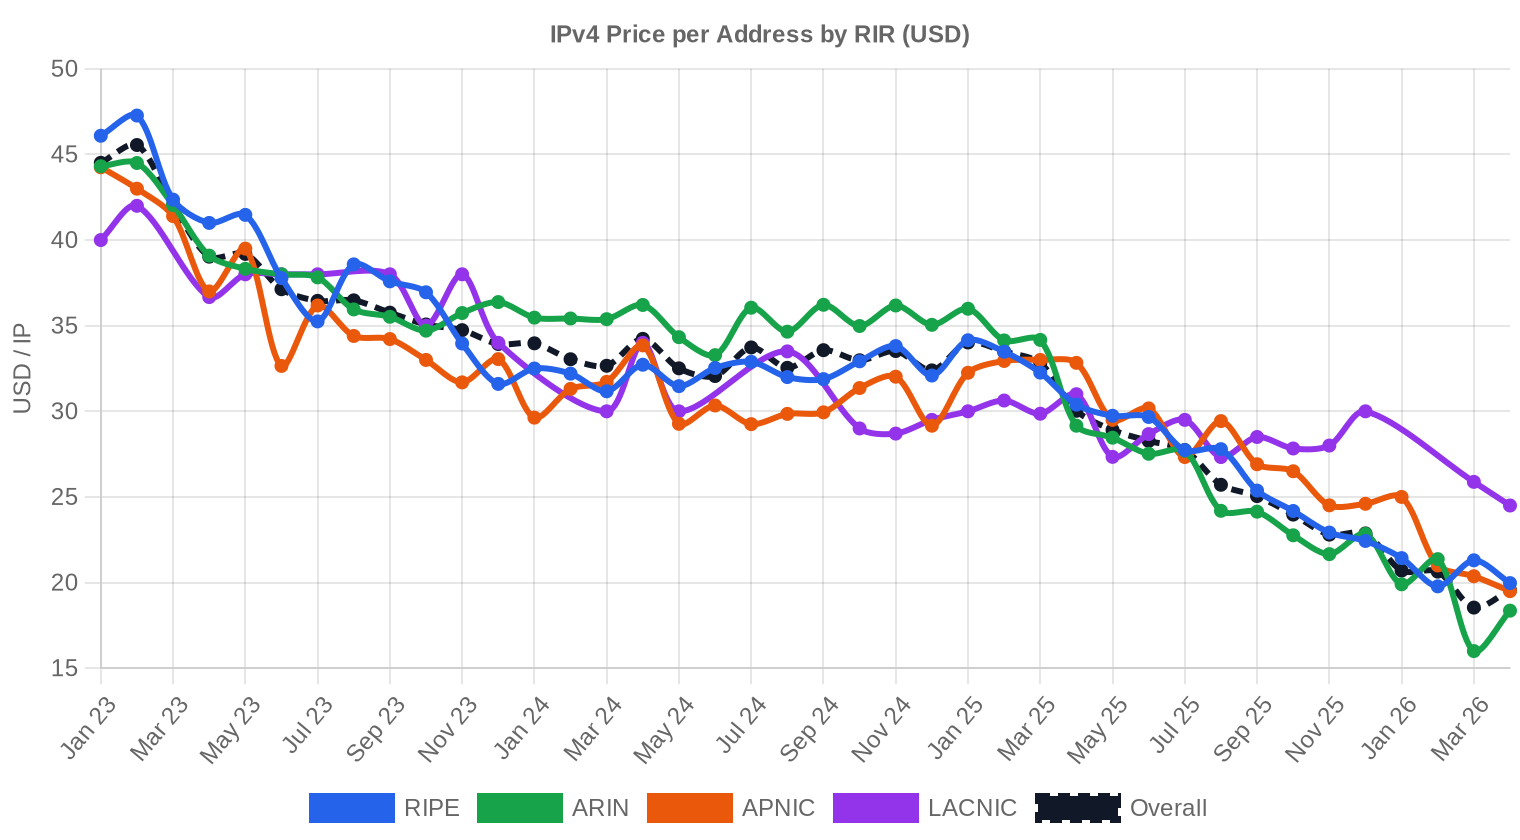
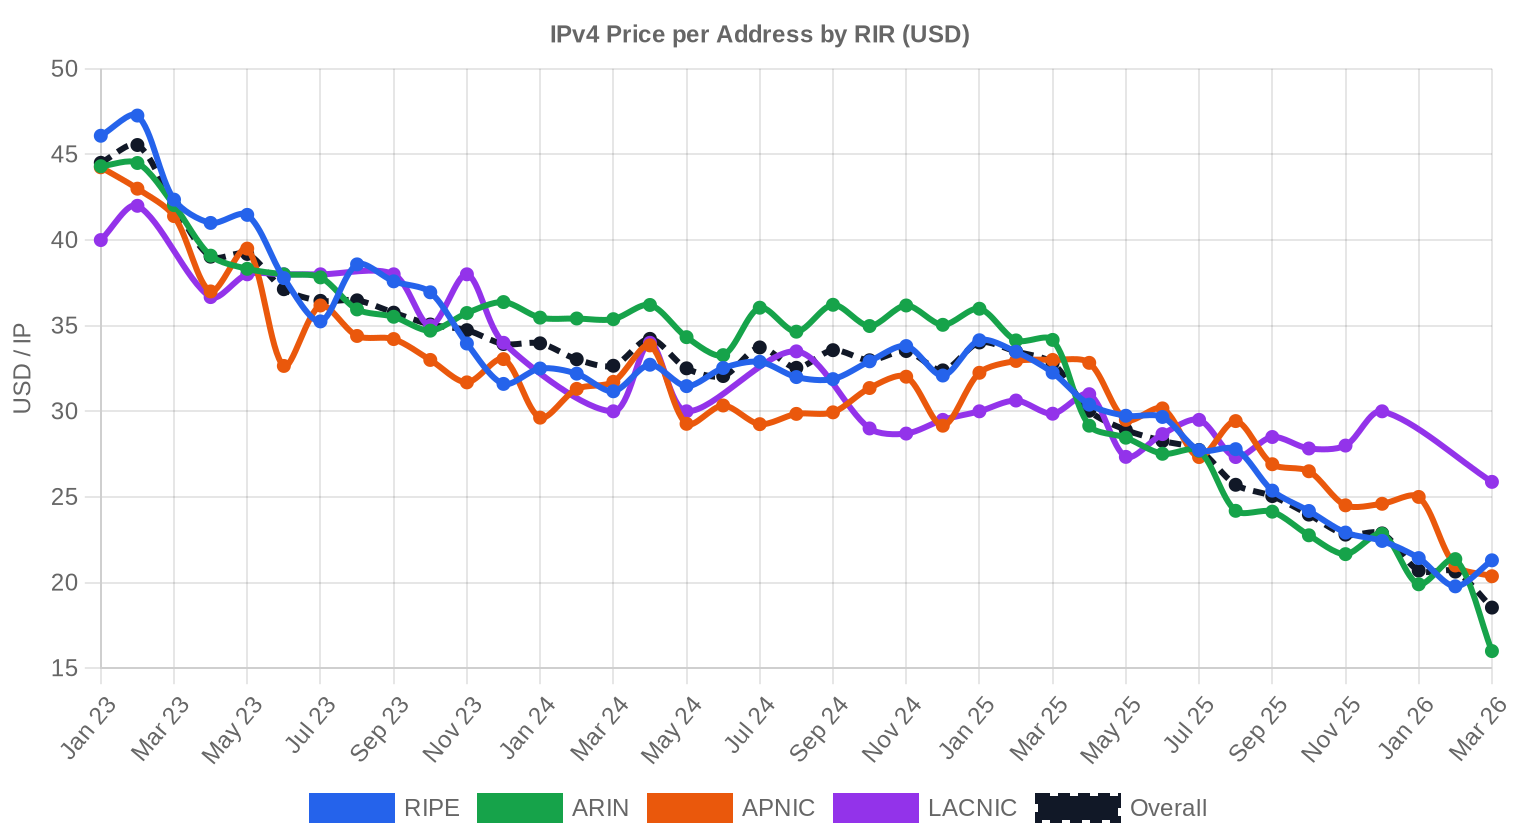
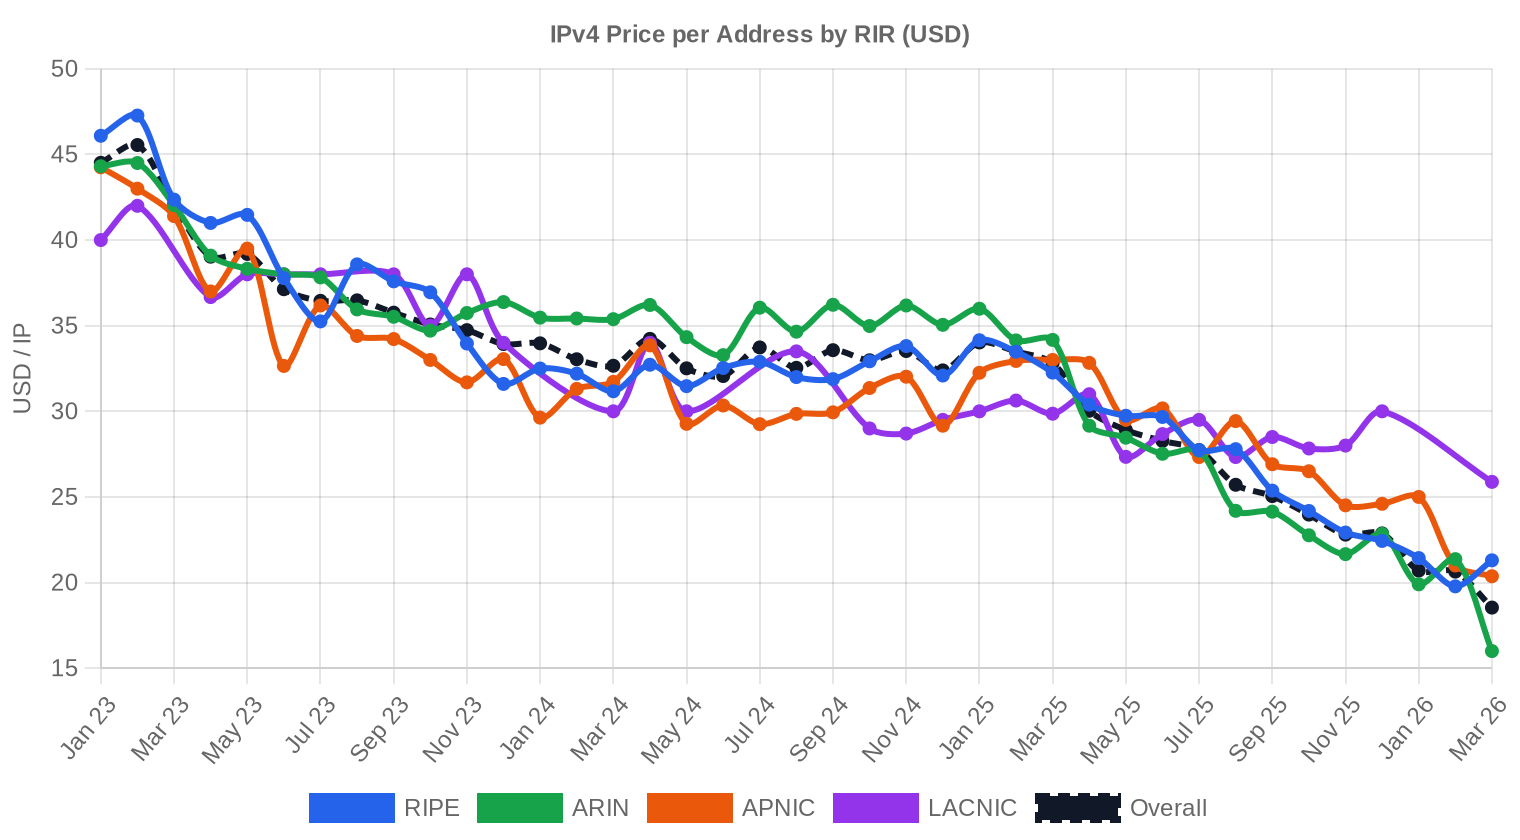
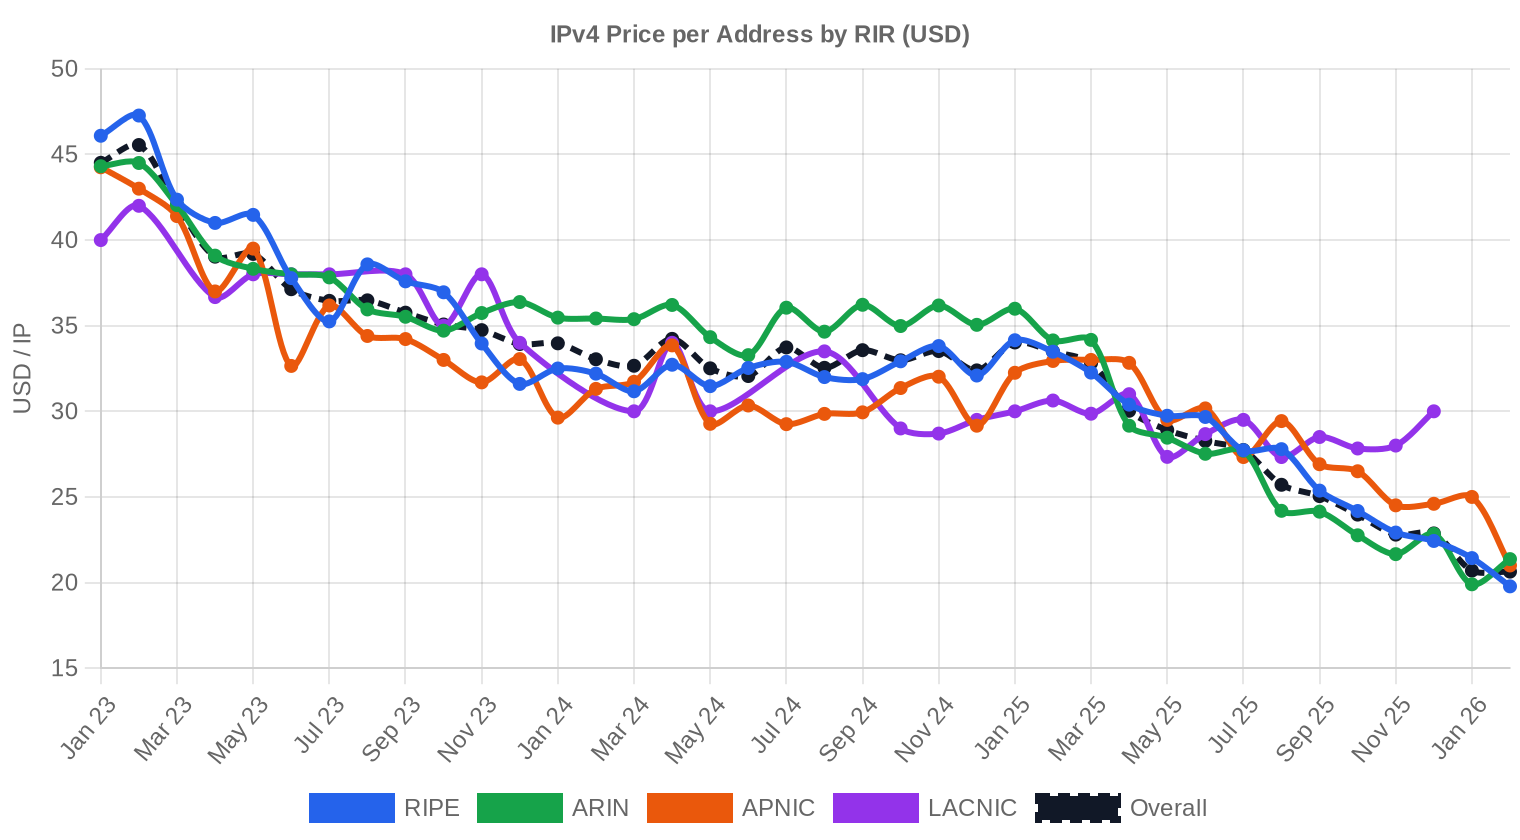
The IPv4 transfer market opened 2024 with continued price erosion. Across 147 transactions totaling 247,808 addresses and $8.5M in gross value, the market-wide average landed at $33.28 per IP — down 3.6% from Q4 2023 and a stark 23.6% below Q1 2023 levels. Transaction count fell 13% quarter-over-quarter, and average deal size collapsed to roughly 1,686 IPs from an implied 4,300+ in Q4, signaling a sharp shift toward smaller blocks. The median held at $32, keeping the average-median spread tight, which tells us this quarter's pricing wasn't distorted by outlier mega-deals. The trend line points down, with the regression suggesting another quarter-point of slippage ahead.Market Overview
| Transactions | 147 |
| IP Addresses Traded | 247,808 |
| Estimated Market Value | $8,529,145 |
| Average Price / IP | $33.28 |
| Median Price / IP | $32.00 |
| RIR Transfers | 2,928 |
Year-over-Year Comparison
| Metric | This period | A year earlier (Q1 2023) | Change |
|---|---|---|---|
| Transactions | 147 | 112 | +31.3% |
| IP Addresses Traded | 247,808 | 609,792 | -59.4% |
| Estimated Market Value | $8,529,145 | $29,845,214 | -71.4% |
| Average Price / IP | $33.28 | $43.57 | -23.6% |
| RIR Transfers | 2,928 | 1,897 | +54.3% |
Price Dynamics
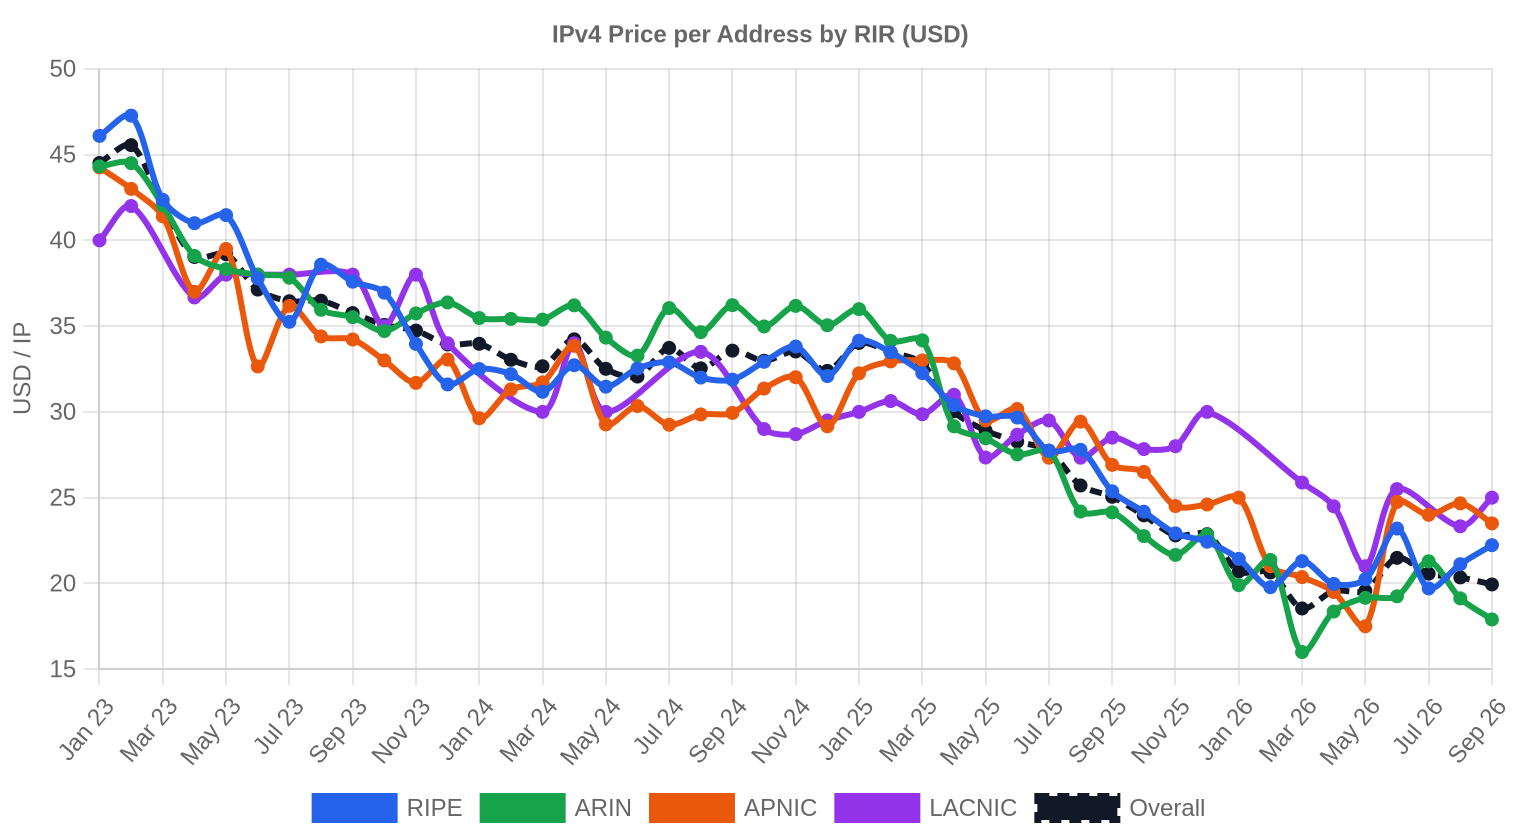
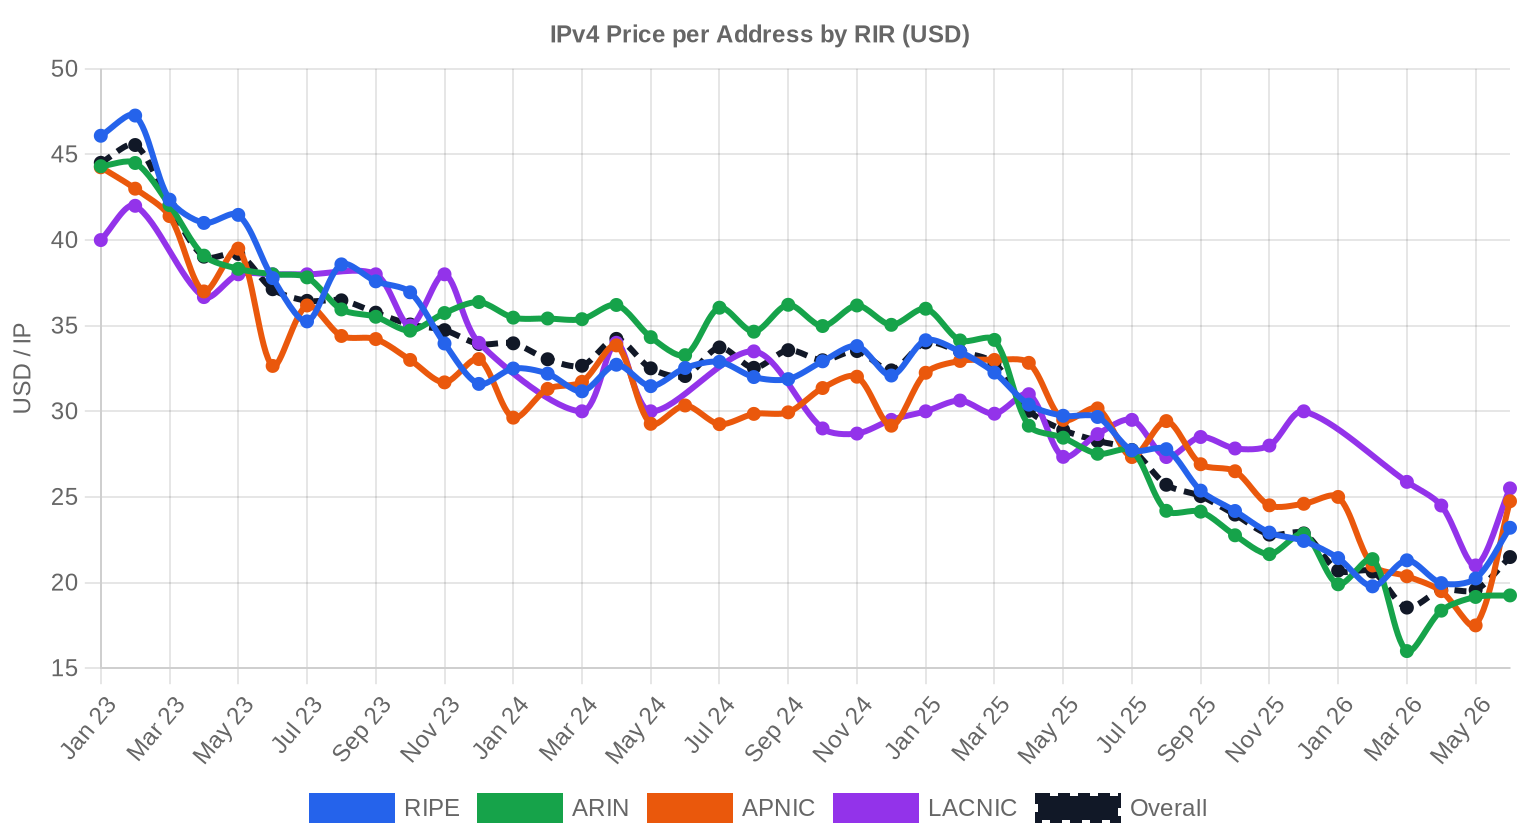
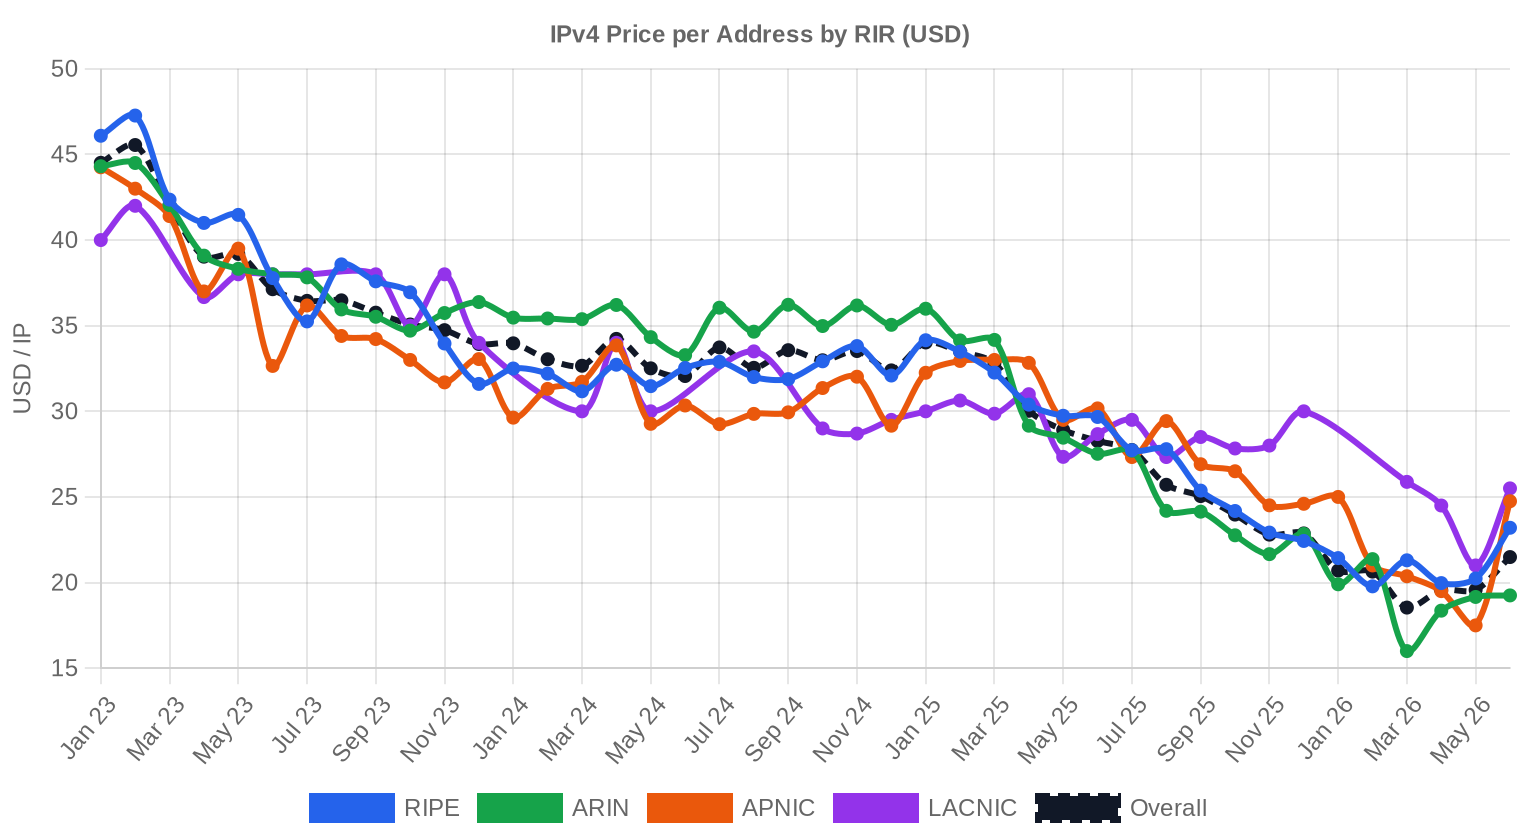
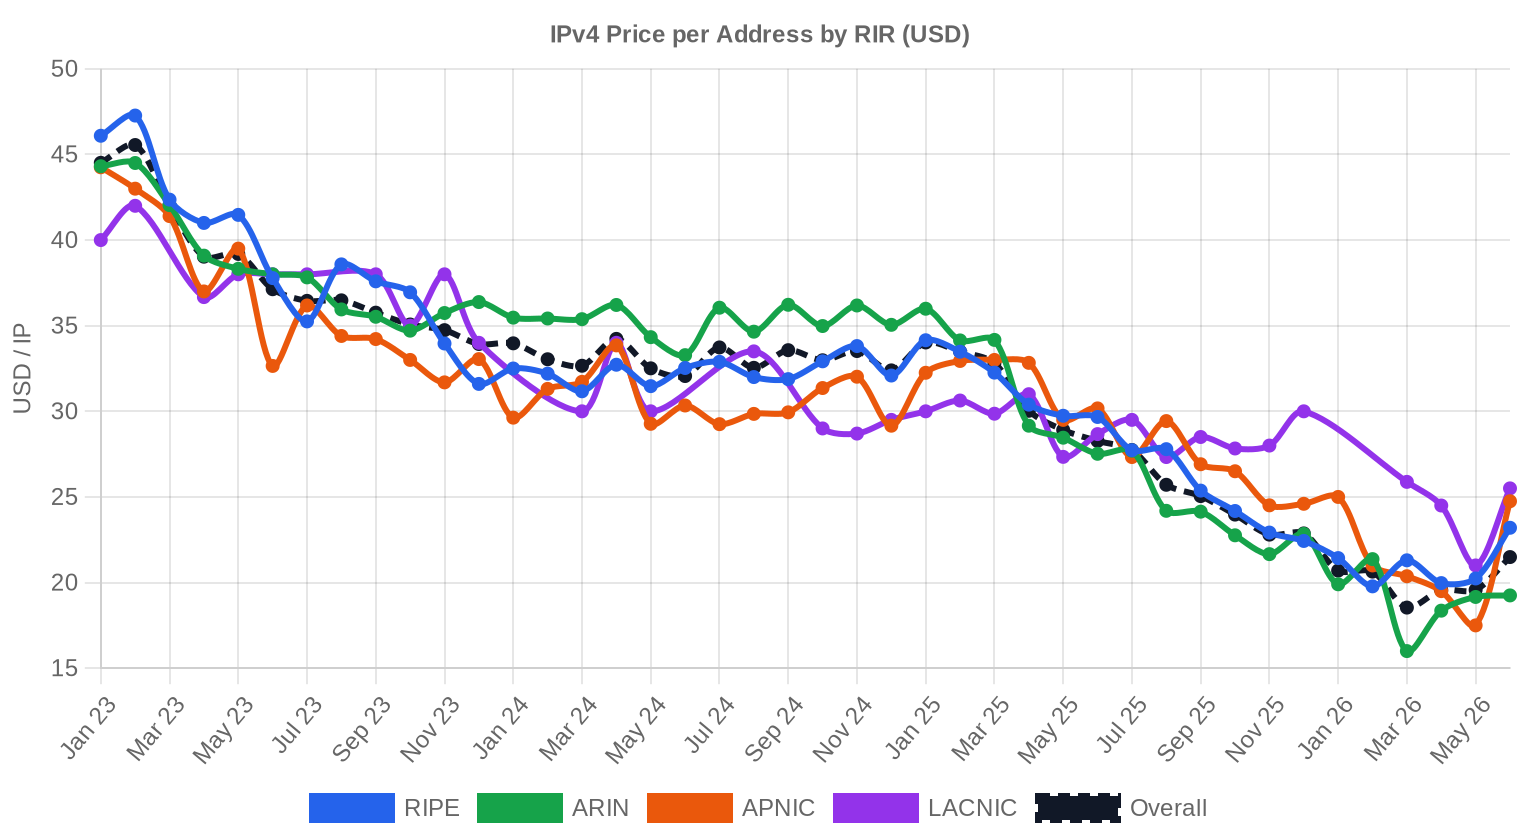
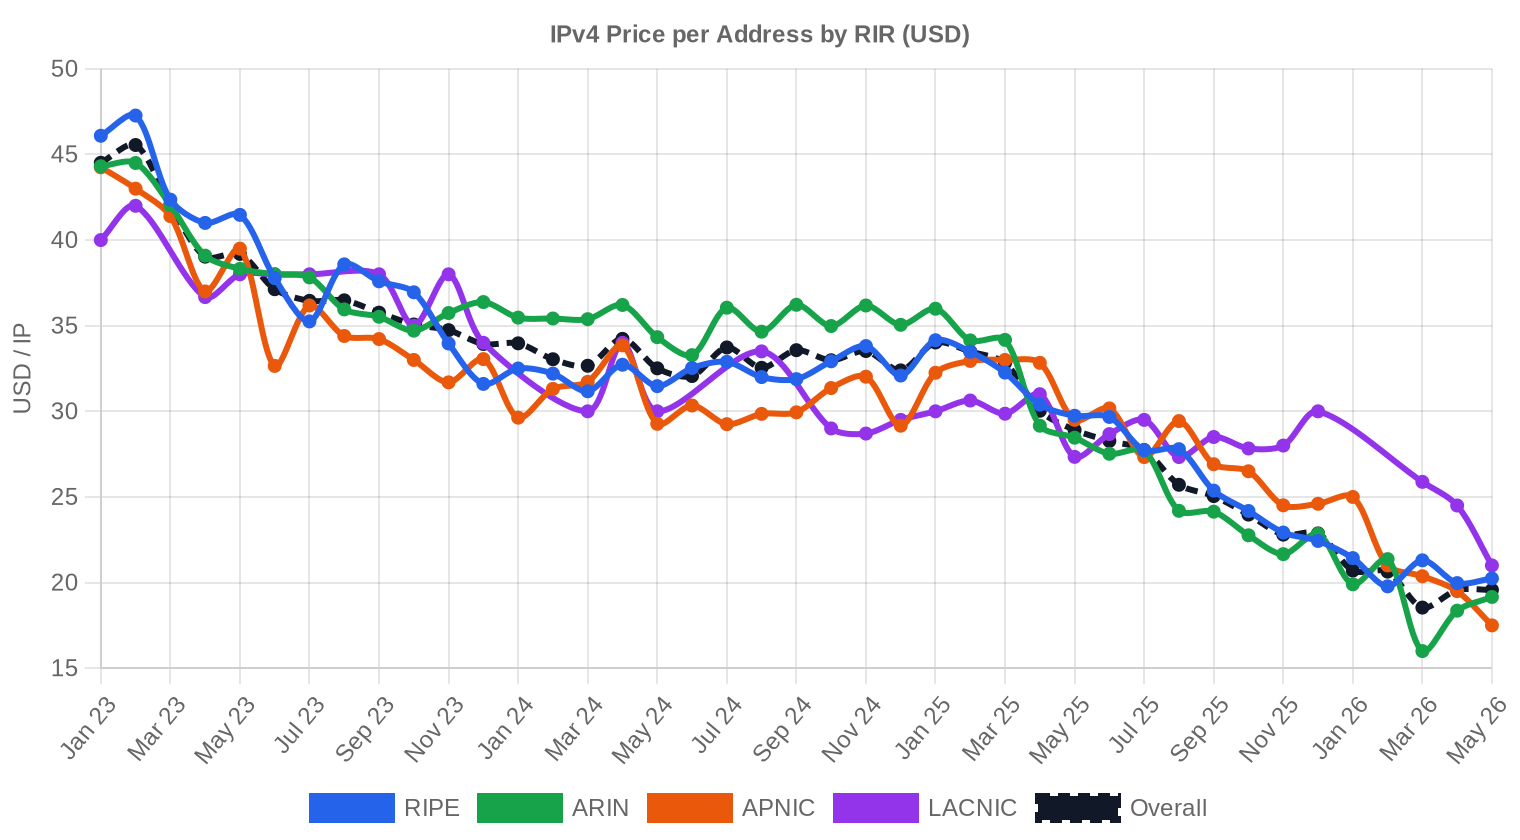
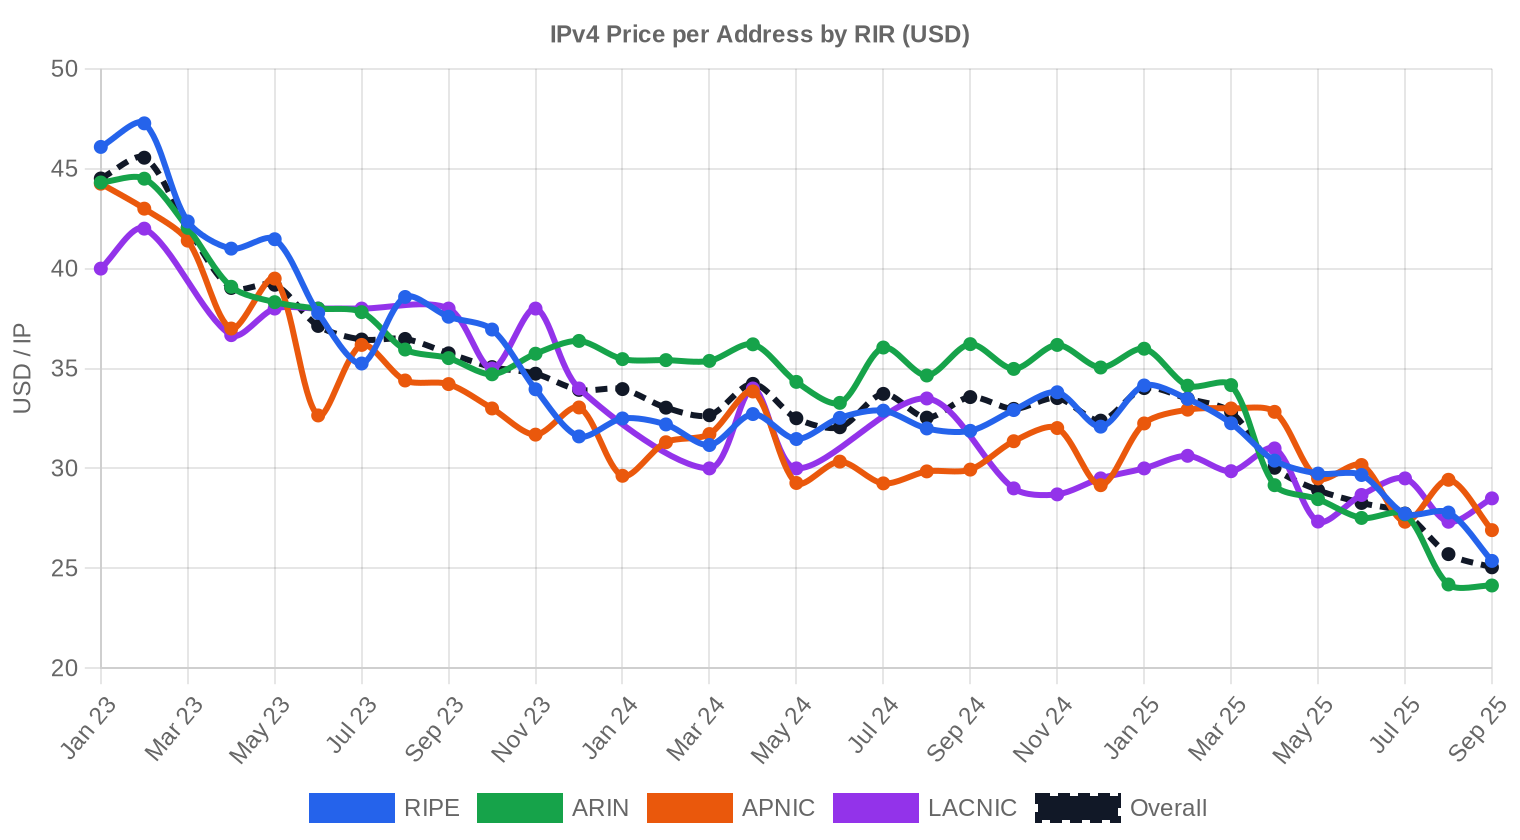
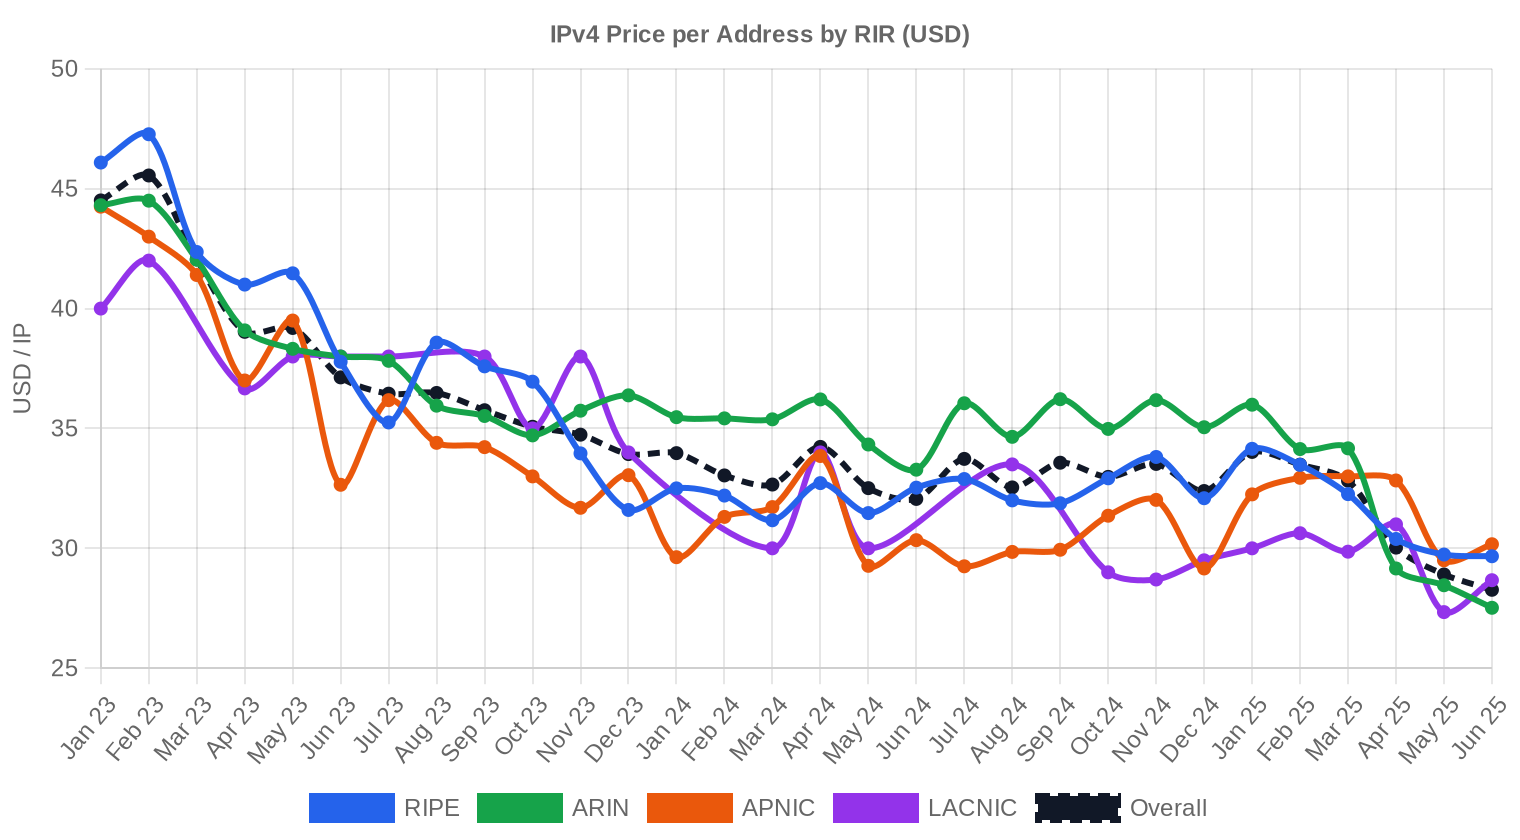
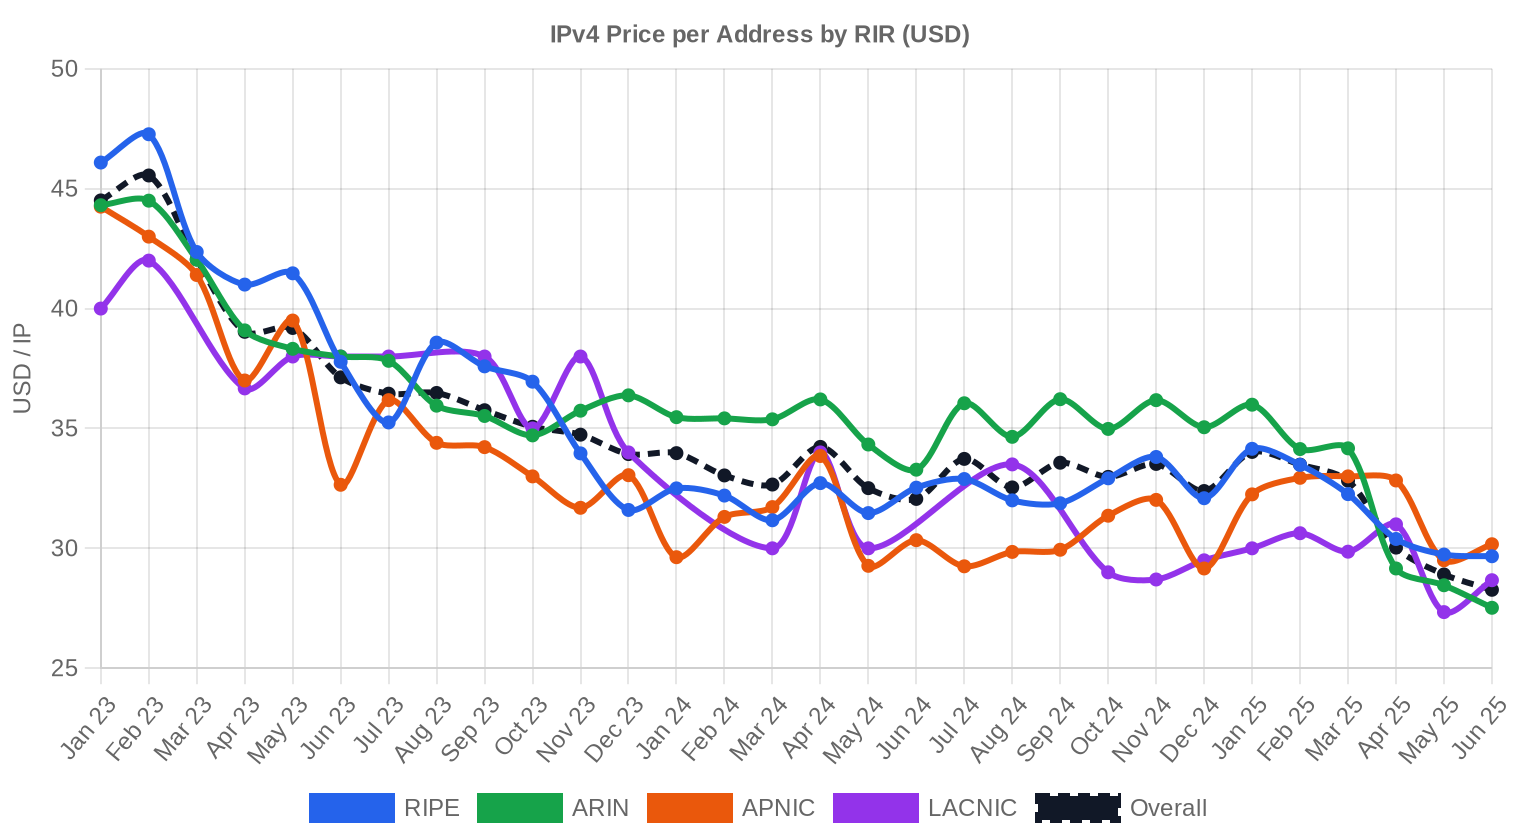
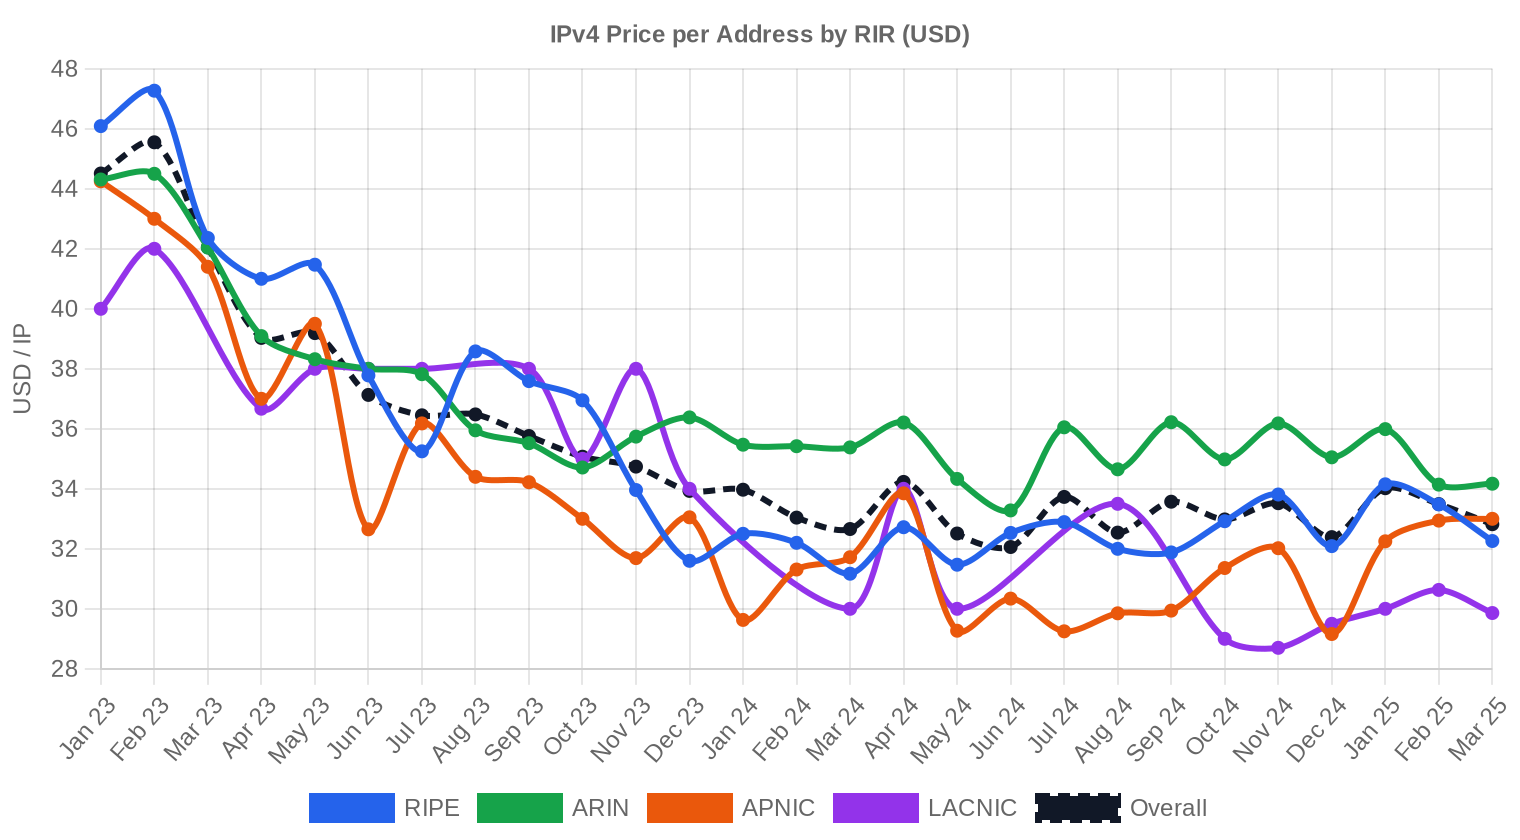
The price floor in Q1 sat at $27 per IP — a RIPE transaction — while the ceiling hit $50.12, an APNIC deal that looks like either a clean /24 premium or a specialty block. That $23.12 spread is wide enough to matter, but the tight $33.28 average against a $32 median means most activity clustered in a relatively narrow band. Compared to Q4 2023, average pricing slid 3.6%, extending a decline that has now persisted for multiple consecutive quarters. Year-over-year, the 23.6% drop from Q1 2023's levels is the headline number — this is not a gentle correction but a genuine repricing of the asset class. AWS's February 2024 public IP charge, now fully in effect, continues to reshape buyer psychology around address economics, and it shows.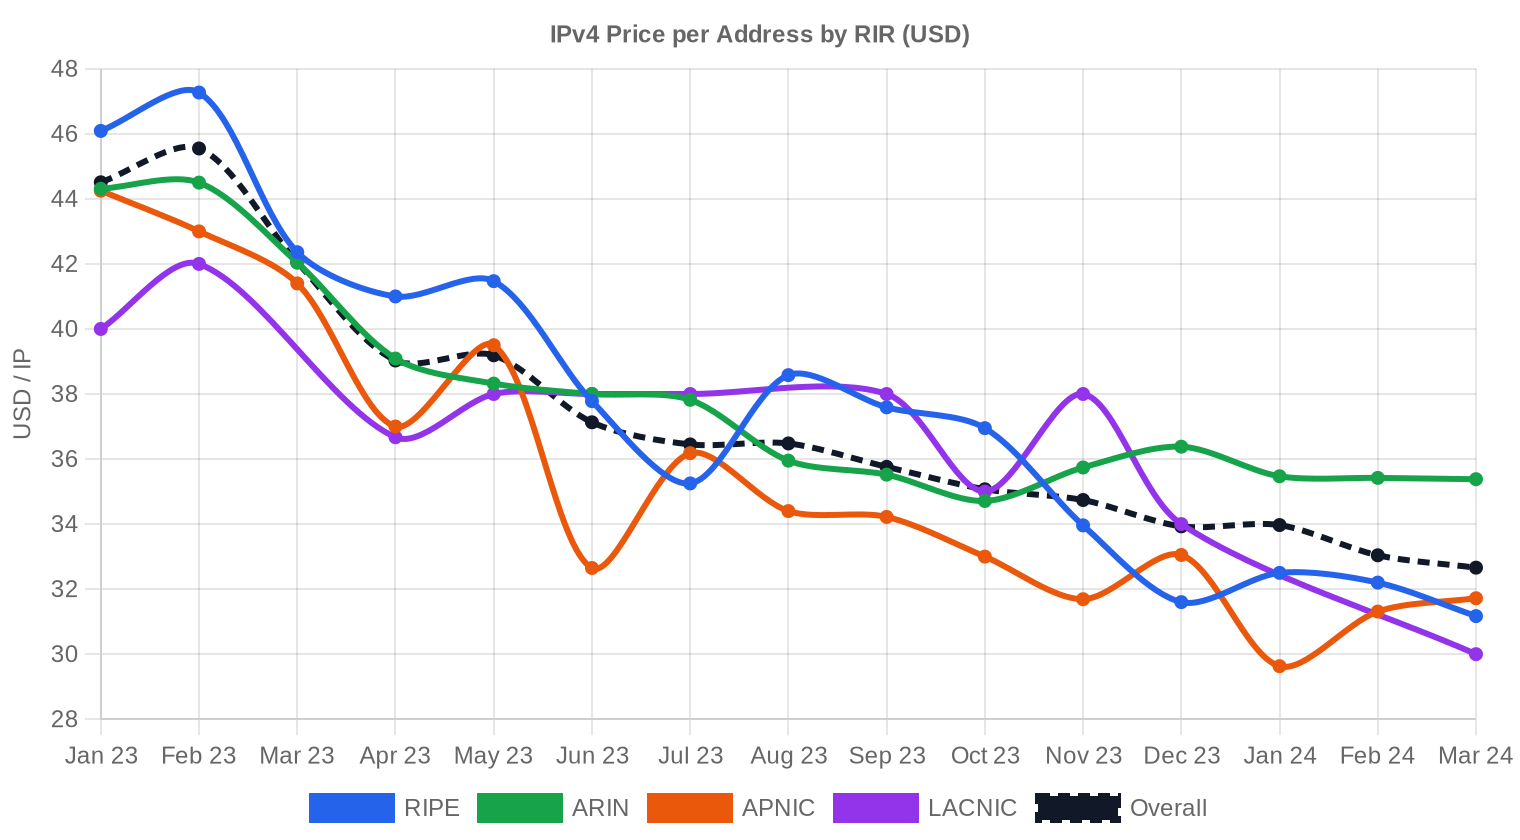
Pricing by RIR
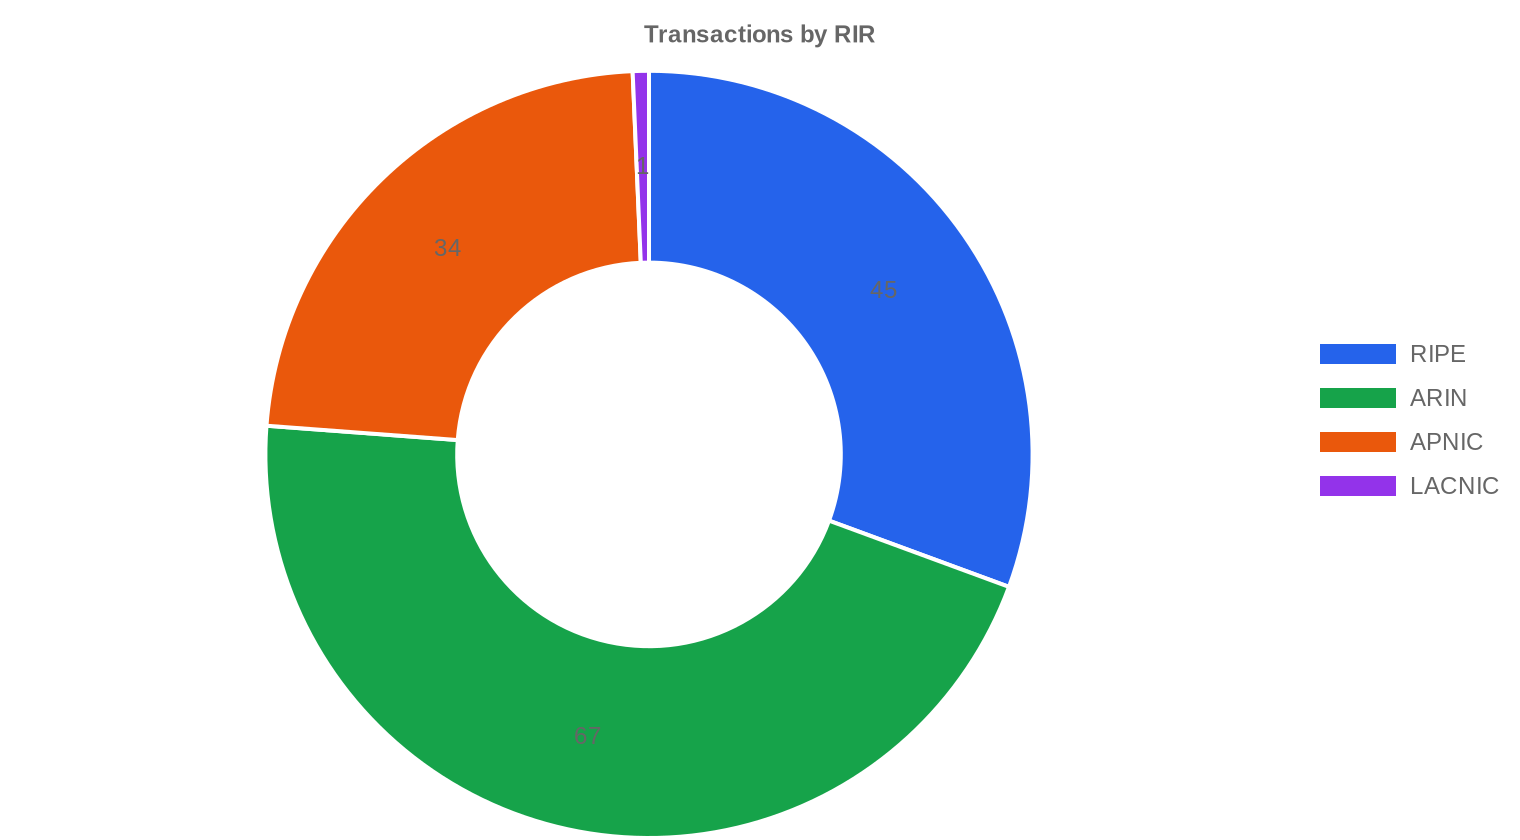
ARIN blocks commanded the highest per-IP prices this quarter, averaging $35.44 against RIPE's $31.81 and APNIC's $31.07. The ARIN premium persists because of the registry's streamlined transfer process and the concentration of US-based enterprise and cloud buyers, but the gap is narrowing — RIPE pricing is now within $3.63 of ARIN, closer than at any point in the past two years. APNIC's average at $31.07 masks the fact that one transaction hit $50.12, the quarter's highest price; strip that out and APNIC pricing looks even softer. LACNIC registered a single deal at $30 flat — barely a data point, but consistent with the limited liquidity that region always shows.ARIN: $35.44 per IP across 67 transactions (45.6% of volume).
RIPE: $31.81 per IP across 45 transactions (19.6% of volume).
APNIC: $31.07 per IP across 34 transactions (22.7% of volume).
LACNIC: $30.00 per IP across 1 transaction (0.8% of volume).
AFRINIC: No recorded transactions.
| RIR | Transactions | Avg $/IP | Median $/IP | IPs Traded | RIR Transfers | Next Month (proj.) | Year-End (proj.) |
|---|---|---|---|---|---|---|---|
| RIPE | 45 | $31.81 | $32.00 | 48,640 | 1,842 | $31.00 | $29.00 |
| ARIN | 67 | $35.44 | $35.00 | 140,800 | 1,086 | $37.00 | $38.00 |
| APNIC | 34 | $31.07 | $30.00 | 56,320 | 0 | $29.50 | $28.00 |
| LACNIC | 1 | $30.00 | $30.00 | 2,048 | 0 | $29.00 | $27.00 |
Transaction Volume

Supply & Block Sizes
/24 blocks dominated deal flow with 70 transactions — nearly half the quarter's total of 147. This tracks with the collapse in average deal size from roughly 4,300 IPs in Q4 to 1,686 IPs in Q1; the market is increasingly retail-sized. Buyers in this segment tend to be small ISPs, SaaS companies standing up new infrastructure, or organizations needing clean space for email reputation — use cases where a single /24 is sufficient and a /22 is overkill.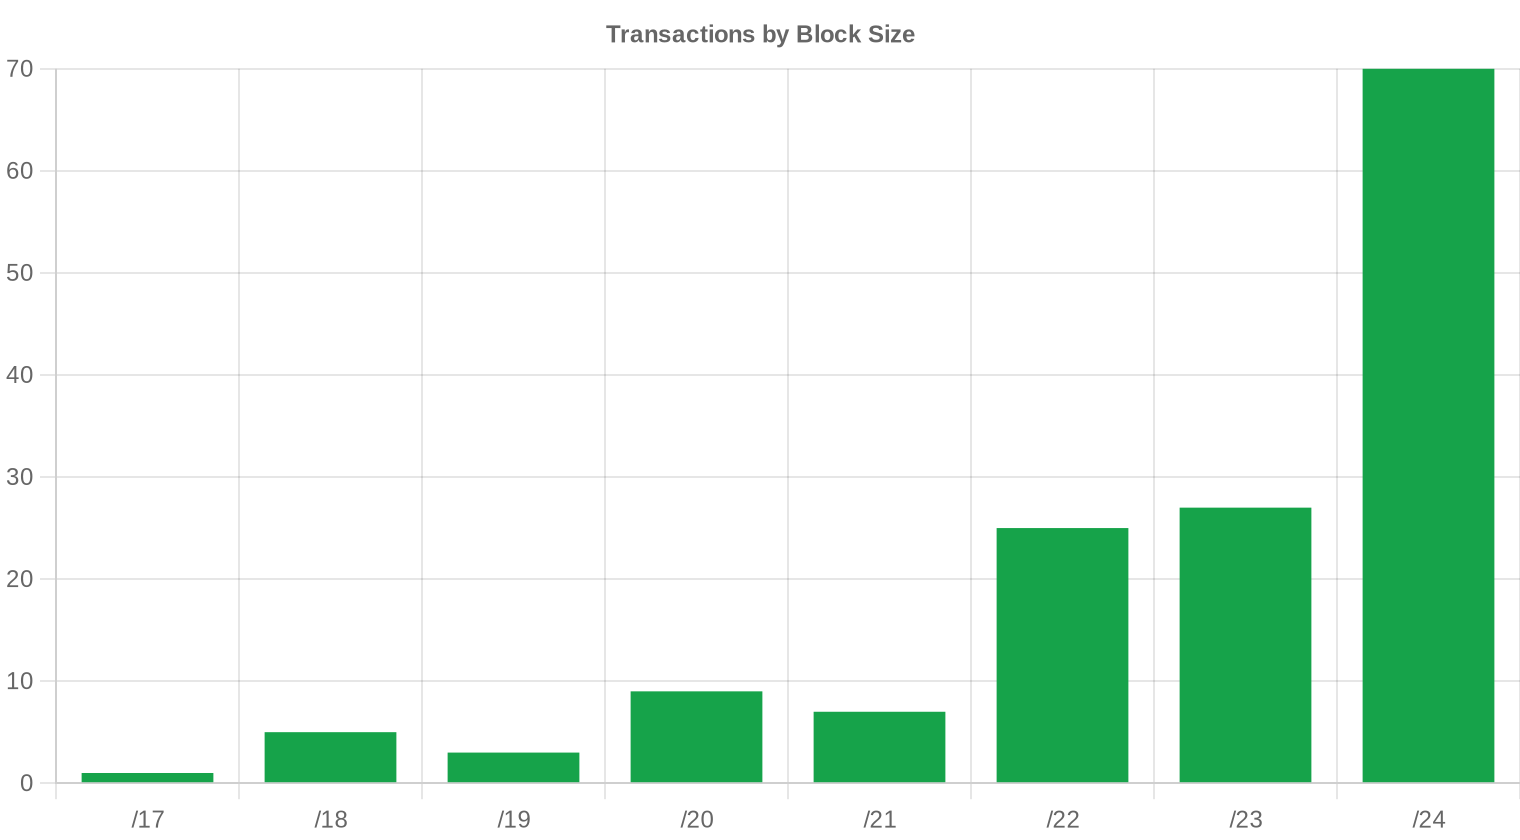
Geographic Activity
Country-level distribution data was not available for Q1 2024. Given that ARIN accounted for 45.6% of transaction volume and RIPE contributed 63.7% of all official RIR transfers, activity remained concentrated in North America and Europe, consistent with historical patterns.Registry Transfer Activity
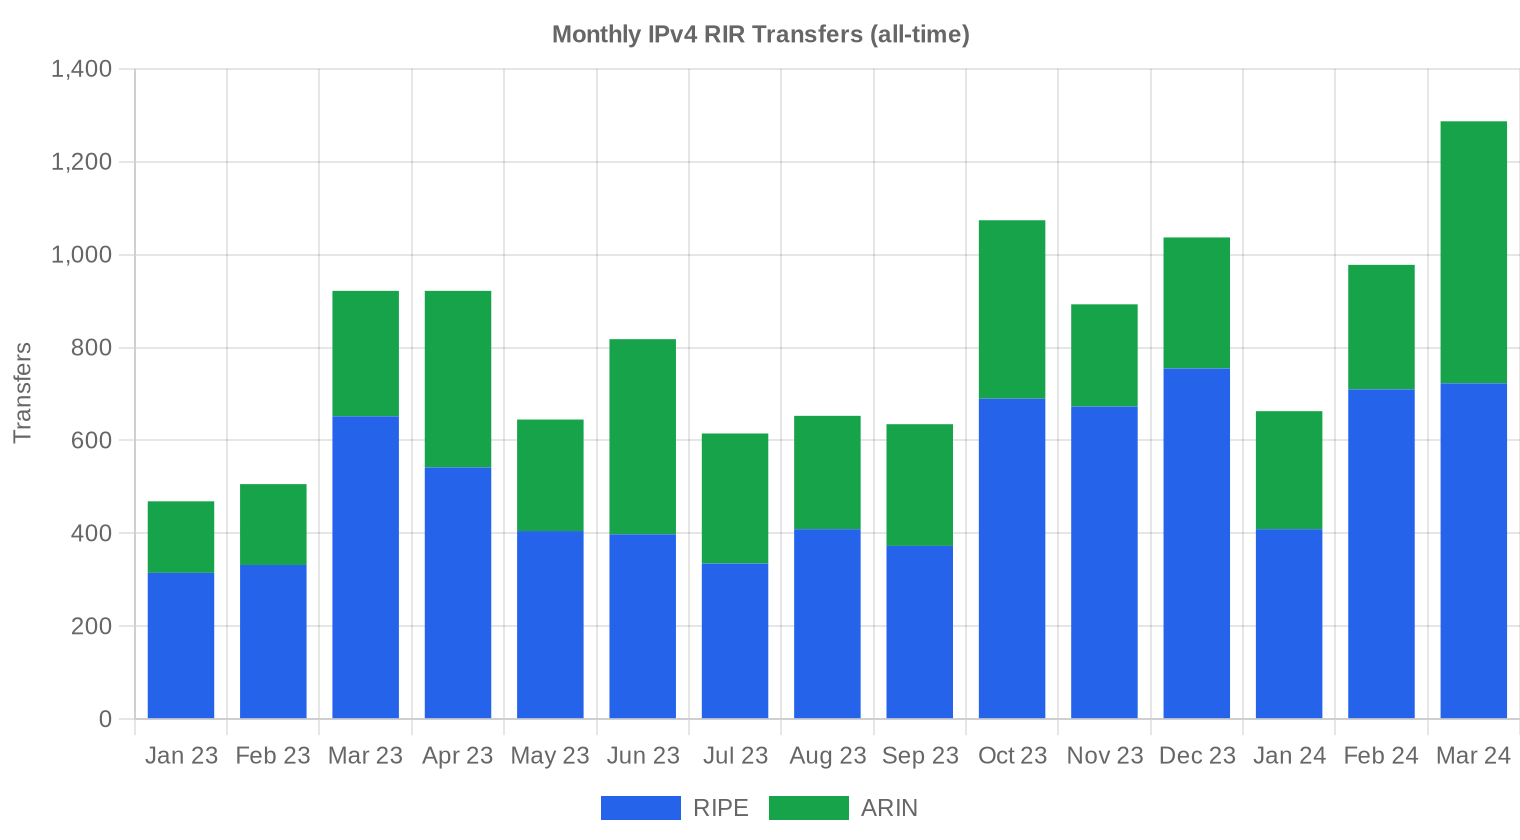
RIR-recorded transfers totaled 2,928 in Q1 2024, with RIPE accounting for 1,842 (62.9%) and ARIN contributing 1,086 (37.1%). The RIPE dominance in transfer counts versus ARIN's dominance in priced transaction volume reflects the difference between administrative re-registrations and arms-length commercial deals. APNIC, LACNIC, and AFRINIC registered zero official transfers in the period.Long-Run Transfer Trends
Over the trailing 15 months through Q1 2024, cumulative RIR transfers reached 12,117. March 2024 marked the peak month in that window, suggesting a late-quarter surge — possibly driven by organizations closing fiscal-year purchases or RIPE members beating anticipated policy tightening. The upward drift in raw transfer counts, even as priced transaction volume fell 13%, implies a growing share of non-market or intra-organizational moves.| RIR | RIR Transfers |
|---|---|
| RIPE | 7,721 |
| ARIN | 4,396 |
| RIR Transfers | 12,117 |
Outlook & Forecast
Forecasting each block-size band and RIR separately with our AI model:
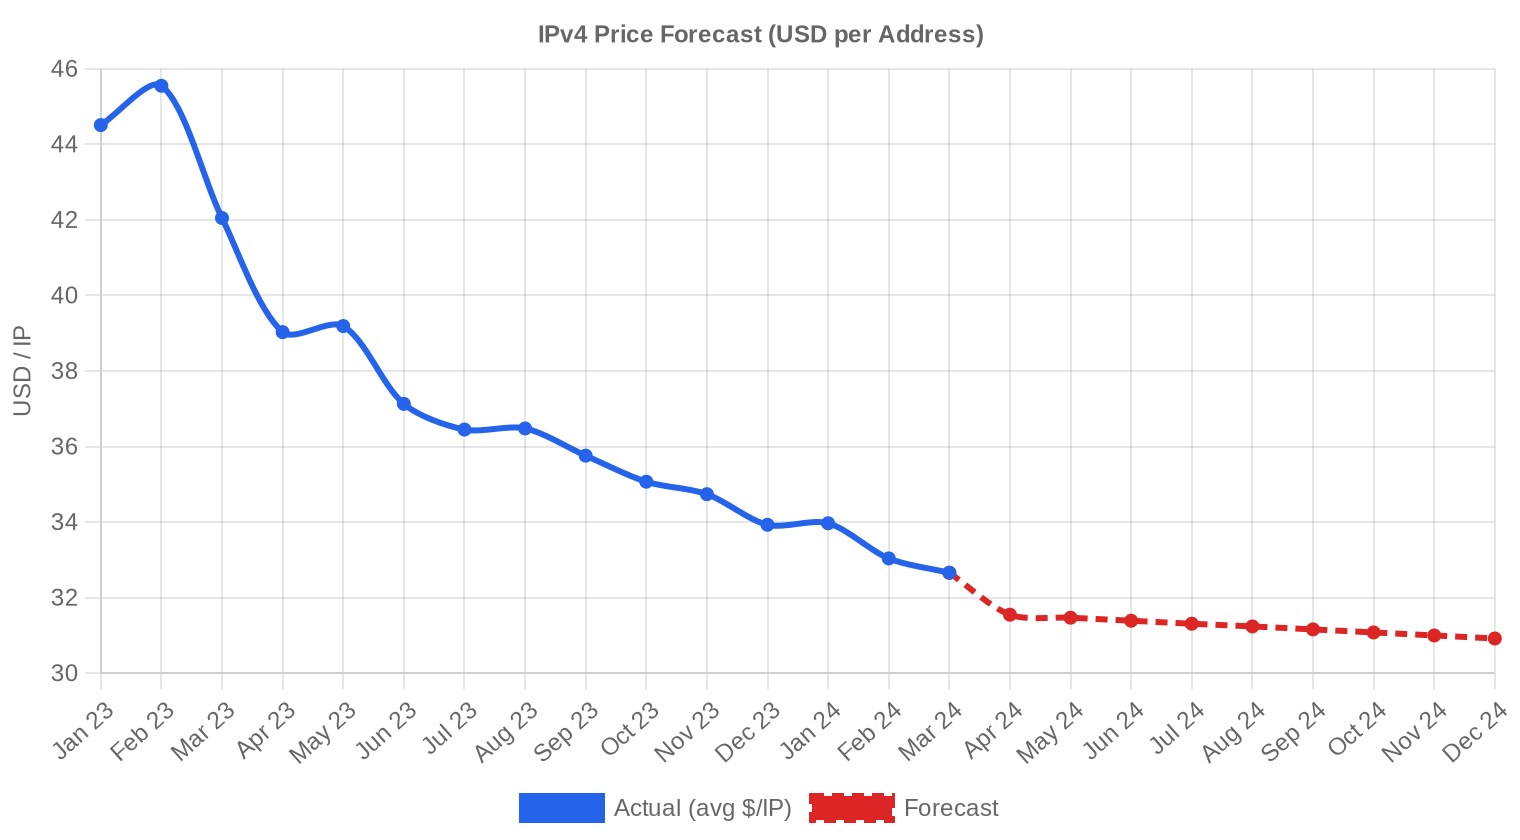
The overall average price per IP is projected to reach $30.92 by December 2024, with a next-month estimate of $31.57 per IP.
- RIPE: projected at $31.00 per IP next month, trending toward $29.00 by December 2024.
- ARIN: projected at $37.00 per IP next month, trending toward $38.00 by December 2024.
- APNIC: projected at $29.50 per IP next month, trending toward $28.00 by December 2024.
- LACNIC: projected at $29.00 per IP next month, trending toward $27.00 by December 2024.
- AFRINIC: insufficient data for a reliable forecast.
Forecast by Block Size
| Block | Current $/IP | Next Month | Year-End | Confidence |
|---|---|---|---|---|
| /24 | $32.00 | $32.00 (0.0%) | $31.00 (-3.1%) | medium |
| /23 | $30.00 | $30.00 (0.0%) | $29.00 (-3.3%) | medium |
| /22 | $29.50 | $29.50 (0.0%) | $29.00 (-1.7%) | medium |
| /21 | $30.00 | $30.00 (0.0%) | $29.00 (-3.3%) | low |
| /20 | $36.00 | $35.00 (-2.8%) | $36.00 (0.0%) | medium |
| /19 | $31.75 | $32.00 (+0.8%) | $33.00 (+3.9%) | low |
| /18-/16 | $39.00 | $39.00 (0.0%) | $41.00 (+5.1%) | low |
| /15-up | $51.50 | $51.00 (-1.0%) | $53.00 (+2.9%) | low |
Editor's Take: Buy vs. Lease
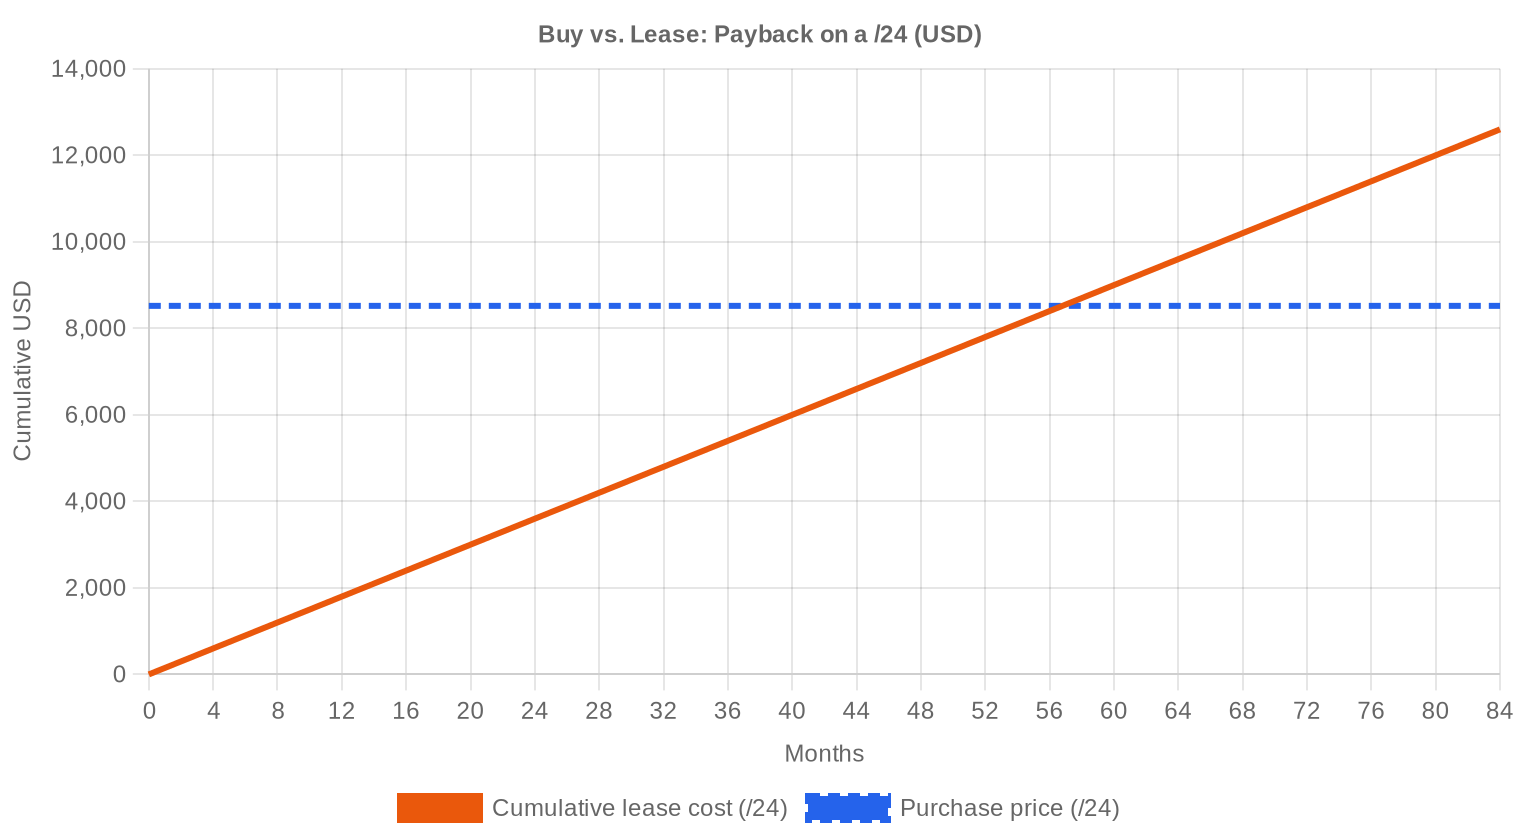
The buy-versus-lease math continues to favor purchasing. At $33.28 per IP on the buy side and $0.5859 per IP monthly on the lease side, the break-even sits at 56.8 months — just under 4.7 years. For any organization planning to use address space beyond a five-year horizon, buying is the rational choice. The implied annual yield to a lessor is 21.1%, which is extraordinary by any fixed-income standard but reflects the illiquidity premium and operational burden of managing leased space. With prices still trending down, buyers who can wait another quarter or two may pick up blocks in the low $30s or even high $20s. Sellers, conversely, face a deteriorating bid — the window for extracting $35+ on non-ARIN space is functionally closed.| /24 Purchase price | $8,520 |
| /24 Lease price | $150 / mo |
| Payback period | 56.8 mo (4.7 yr) |
| Gross annual yield | 21.1% |
What This Means for You
Buyers: You are in the strongest negotiating position in at least two years. Average pricing has dropped 23.6% year-over-year, and the forecast calls for further erosion toward $31 by year-end. If you need space, bid at or below $32 for RIPE and APNIC blocks and hold firm — the data supports it.Sellers: The decline is accelerating. If you hold ARIN blocks, you can still command a $35 average, but that premium is shrinking every quarter. Listing now rather than waiting for a recovery that may not materialize in 2024 is the pragmatic call.
Leasers: At $0.59 per IP monthly, leasing remains attractive for short-term projects or organizations with sub-five-year time horizons. But the declining purchase price narrows the window where leasing beats buying — run your own break-even math before signing multi-year lease agreements.
Block Holders: If you are sitting on unused space, the 21.1% implied annual yield from leasing is the best risk-adjusted return available in the current market. Leasing now and selling later, even at a lower price, may maximize total economic value extracted from the asset.
Browse verified IPv4 blocksSell IPv4 →
List your blocks with managed transferLease IPv4 →
Flexible short-term capacityLease Out IPv4 →
Turn idle blocks into recurring revenue
IPv4 Pricing by Block Size
The /24 segment — 256 IPs — drove 70 of 147 transactions, and these blocks carry a meaningful per-IP premium over larger allocations. A clean /24 at the median price of $32 per IP works out to $8,192 per block, while larger /16 transactions, where per-IP pricing compresses toward $27–$29, deliver far more addresses per dollar. The small-block premium reflects ease of transfer, higher demand frequency, and the simple fact that more buyers can afford an $8K purchase than an $800K one.| Block | IPs | Buy: /IP | Buy: Total | Lease: /IP/mo | Lease: Monthly |
|---|---|---|---|---|---|
| /24 | 256 | $35–45 | $8,960–11,520 | $0.38–0.50 | $97–128 |
| /22 | 1,024 | $28–38 | $28,672–38,912 | $0.33–0.45 | $338–461 |
| /20 | 4,096 | $22–32 | $90,112–131,072 | $0.30–0.40 | $1,229–1,638 |
| /18 | 16,384 | $20–30 | $327,680–491,520 | $0.30–0.38 | $4,915–6,226 |
| /16 | 65,536 | $18–28 | $1,179,648–1,835,008 | $0.30–0.35 | $19,661–22,938 |
IPv4 Price History: 2011–2026
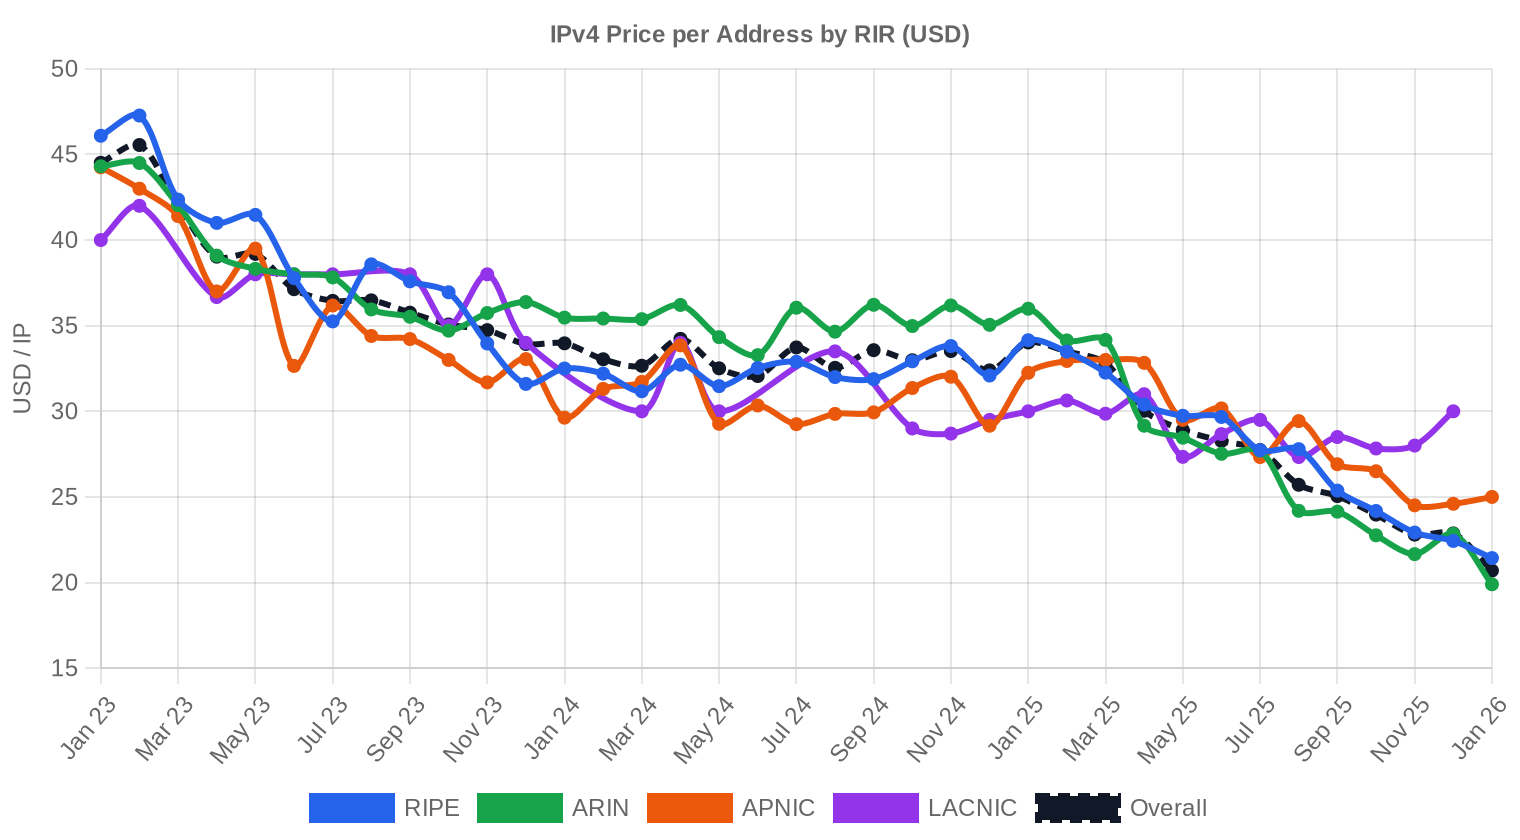
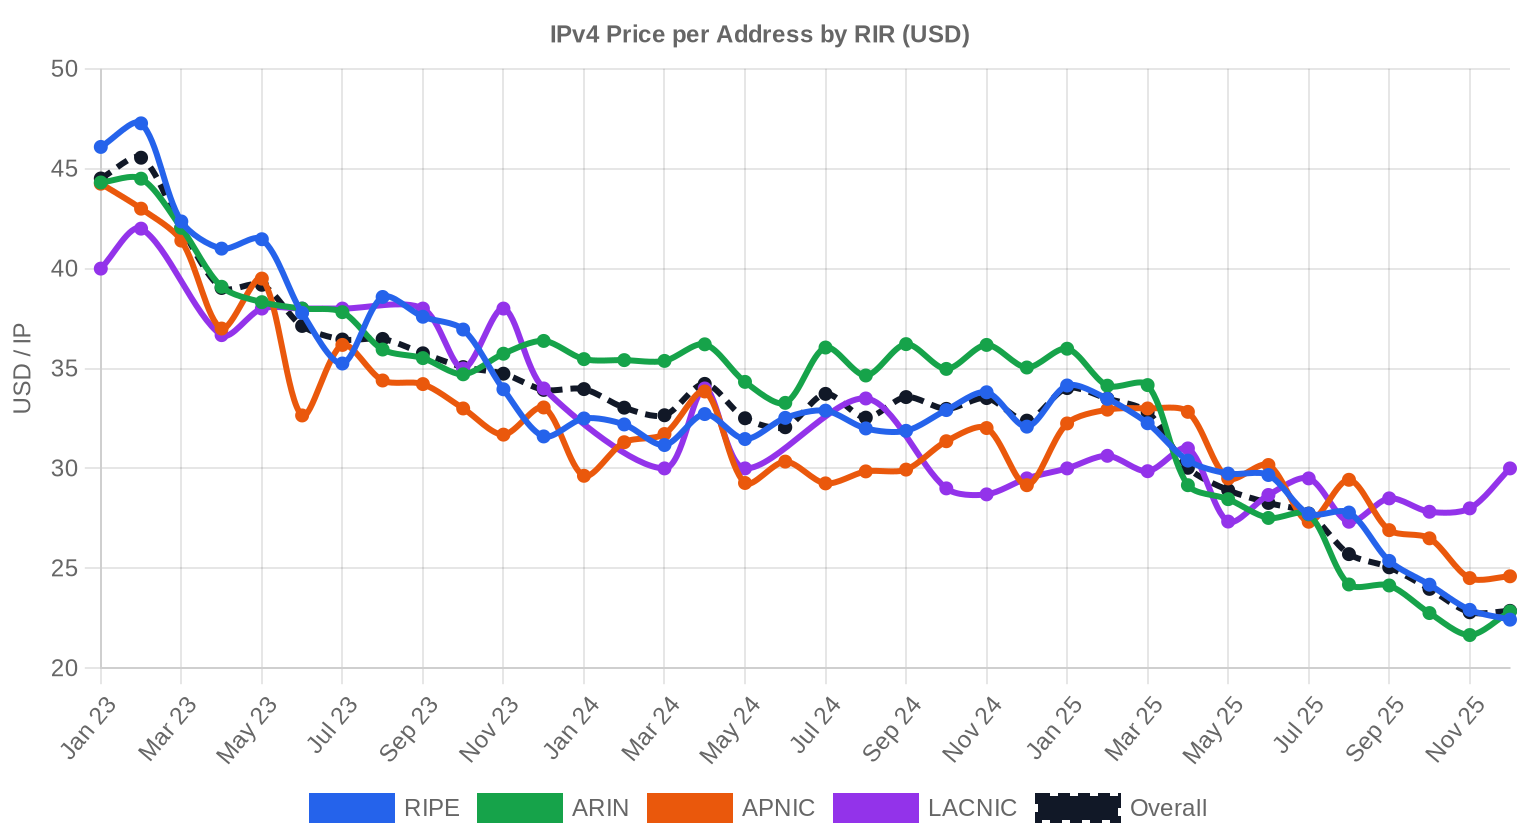
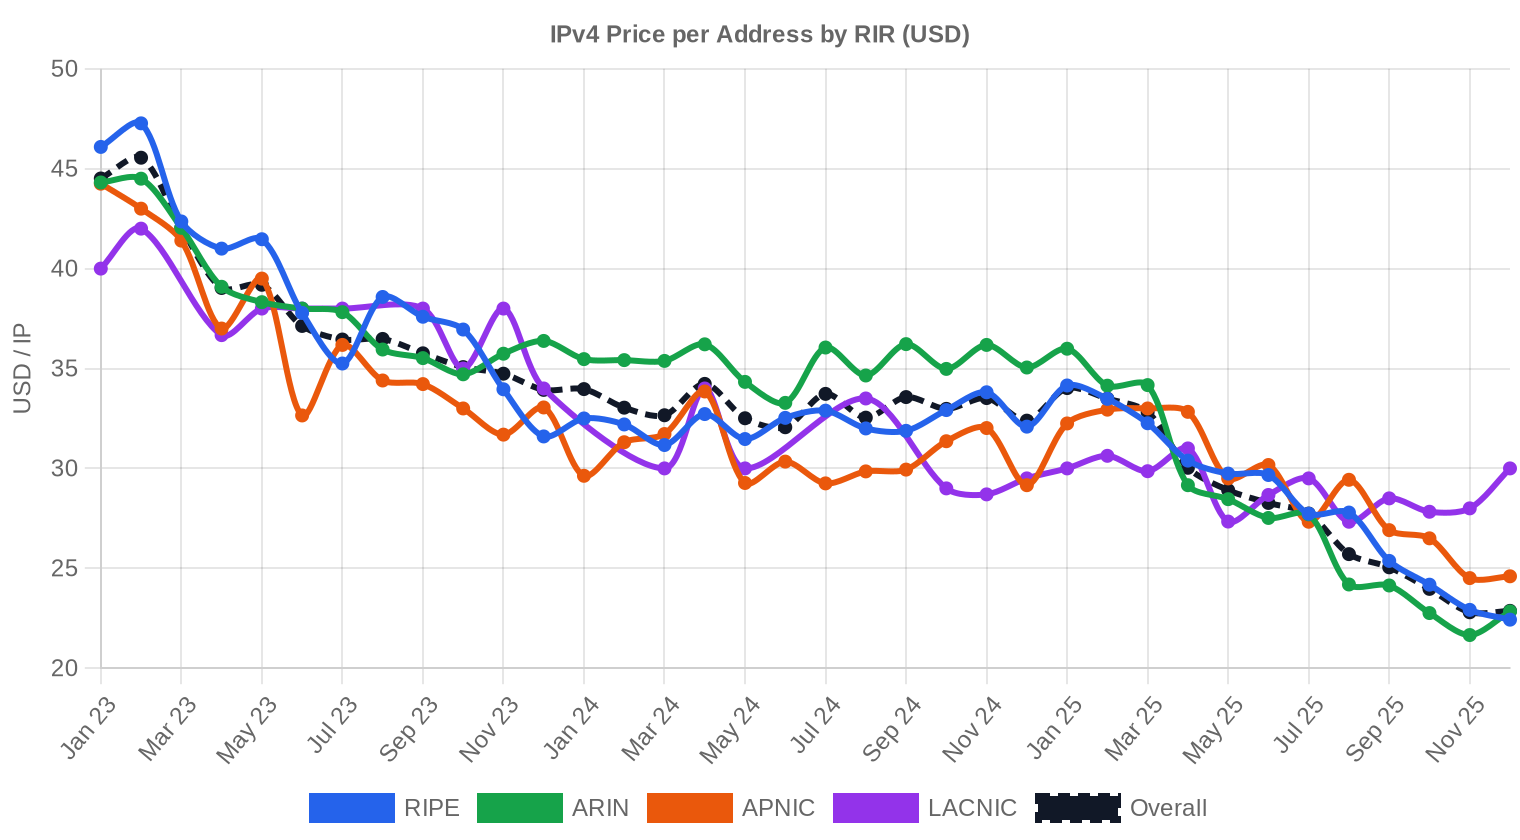
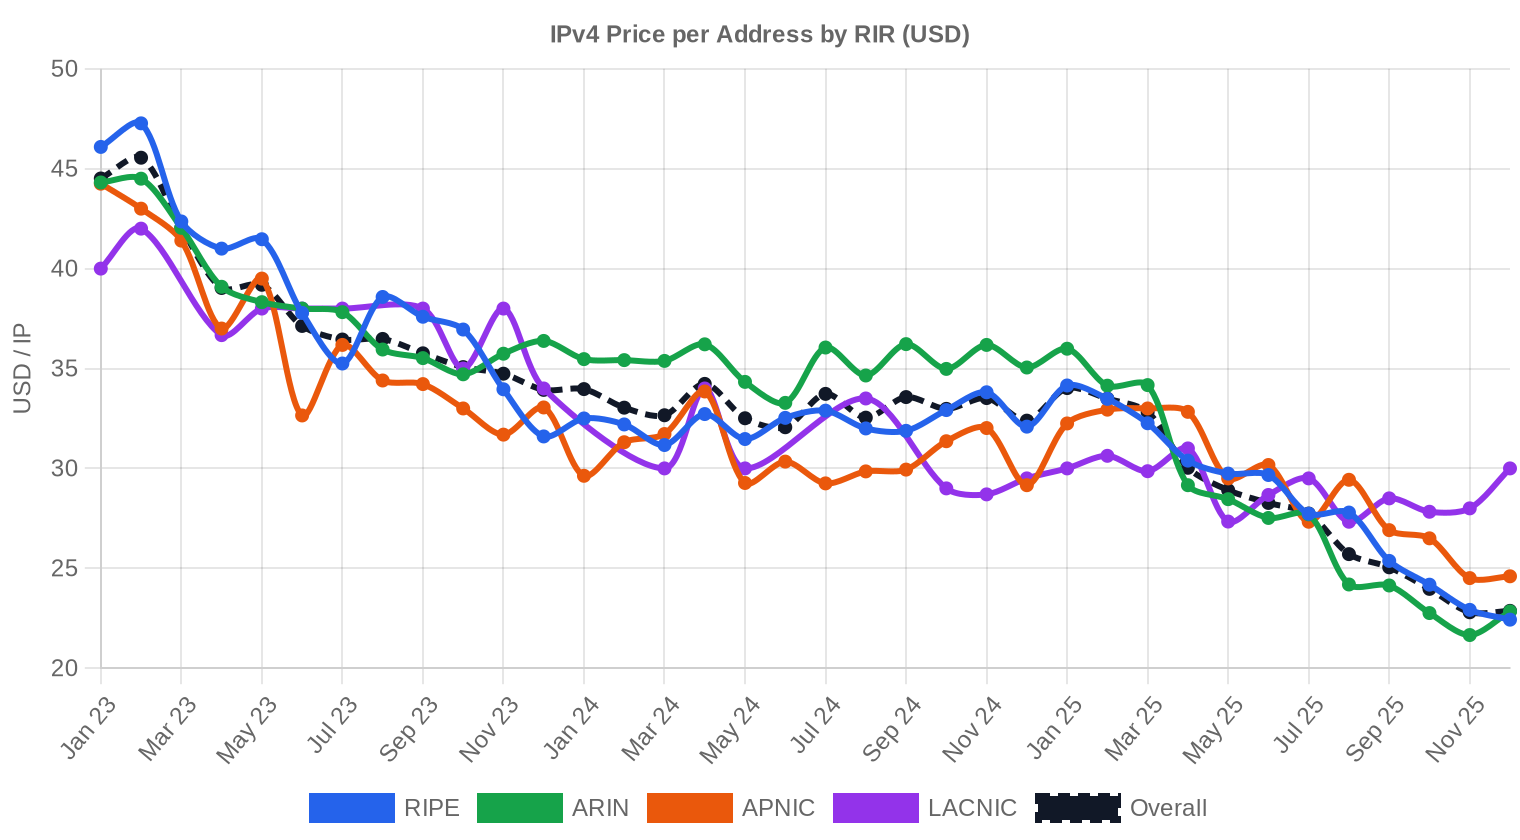
IPv4 addresses first acquired real commercial value after IANA pool exhaustion in 2011, with early transfers pricing in the $5–$7 range. The market climbed steadily through 2021 and peaked near $55–$60 per IP in early-to-mid 2023 for premium ARIN space, before AWS's decision to charge for public IPv4 addresses catalyzed a repricing event. Q1 2024's $33.28 average represents roughly a 40% drawdown from those peaks — a correction that has separated the market into a two-tier structure: ARIN space still commands a premium, while RIPE and APNIC blocks trade closer to $30. The question going forward is whether $30 represents a floor or simply a waypoint.| Year | ~Price/IP | Key Event |
|---|---|---|
| 2011 | $7–12 | IANA free pool exhausted; Microsoft/Nortel deal ($11.25/IP) |
| 2012 | $8–12 | RIPE NCC reaches last /8; begins /22-only allocation |
| 2014 | $10–15 | LACNIC free pool exhausted |
| 2015 | $8–15 | ARIN free pool exhausted |
| 2017–18 | $12–18 | Leasing market grows; cloud demand rises |
| 2019 | $18–24 | RIPE NCC exhausts remaining free pool |
| 2021–22 | $50–60+ | Post-pandemic peak; hyperscaler build-outs |
| 2024 | $35–52 | AWS IPv4 charge ($0.005/IP/hr); large block correction |
| 2025–26 | $18–45 | Market bifurcation; /16s below $20 for first time since 2019 |
Market Structure: Who Is Buying & Selling
The buy side in Q1 was dominated by small and mid-size ISPs, hosting companies, and SaaS firms — the /24 transaction count makes that clear. Large cloud providers have largely stepped back from the spot market, having built sufficient inventory during the run-up years or shifted workloads behind CGNAT. On the sell side, legacy holders and organizations rationalizing post-merger address portfolios account for most supply, with a growing trickle from firms that moved fully to IPv6-only internal networks and are monetizing freed-up space.IPv4 vs. Other Asset Classes
At a 21.1% implied annual yield from leasing, IPv4 addresses outperform virtually every traditional asset class on a current-income basis. US investment-grade bonds are yielding 5–6%, commercial real estate cap rates sit around 6–8%, and the S&P 500 dividend yield is roughly 1.4%. The catch is liquidity and depreciation risk — IPv4 prices are declining, so that 21.1% yield comes with capital erosion that could eat into total returns. An investor buying at $33 today and leasing at $7.03 annually nets positive returns only if the block retains meaningful residual value at exit.| Asset Class | Typical Yield | Liquidity | Primary Risk |
|---|---|---|---|
| IPv4 | 21.1% | Moderate | IPv6 adoption, block quality |
| Commercial Real Estate | 5–8% | Low | Vacancy, rate cycle |
| Investment-Grade Bonds | 4–5% | High | Duration, credit risk |
| S&P 500 | ~1,3% | High | Market volatility |
| Money Market / T-Bills | ~4–5% | High | Rate cycle changes |
IPv6 Adoption & Why IPv4 Remains Essential
IPv6 adoption continues to creep upward — Google's measurements show roughly 45% of traffic reaching their services over IPv6 — but the transition remains stubbornly incomplete in enterprise, hosting, and last-mile ISP segments. Large swathes of corporate IT, legacy SaaS platforms, and IoT device management still require IPv4 connectivity, and that reality is not changing in 2024 or 2025. The dual-stack era will persist for the rest of this decade at minimum, which puts a floor under IPv4 demand even as per-IP prices soften.AI & Cloud Infrastructure Demand
AI infrastructure buildouts — GPU training clusters, inference serving farms, data pipeline endpoints — require public IP space for API access, model distribution, and inter-datacenter connectivity. Hyperscalers tend to pull from existing inventory, but the wave of AI startups and mid-tier cloud providers spinning up dedicated GPU capacity are net-new IPv4 buyers. This is a real but modest demand driver in Q1 2024; it may become more material as inference workloads scale and more companies deploy customer-facing AI endpoints that need routable addresses.What Determines IPv4 Block Value
Not all IPv4 blocks trade at the same price, and the variance in Q1 — $27 to $50.12 — reflects that. Key differentiators include blacklist status (a block showing up on Spamhaus or UCE Protect will trade at steep discounts), allocation age (older blocks from legacy holders tend to carry cleaner reputations), RIR of origin (ARIN commands a $4+ premium over RIPE and APNIC), and whether the block can be transferred cleanly without policy encumbrances. Buyers should request blacklist reports and routing history before agreeing to any price.Sell vs. Lease: A Decision Framework
In a declining-price environment, leasing lets holders extract income without crystallizing a loss versus last year's valuations. At $0.59 per IP monthly, a /24 generates $1,800 annually — and the block can still be sold later. Selling makes sense for holders who need immediate capital, who lack the operational infrastructure to manage lease relationships, or who believe the price decline will accelerate beyond what lease income can offset.| /24 Purchase price | $8,520 |
| /24 Lease price | $150 / mo |
| Payback period | 56.8 mo (4.7 yr) |
| Gross annual yield | 21.1% |
RIPE NCC 24-Month Transfer Restriction
RIPE NCC's 24-month holding requirement — which bars transfer of a block until two years after acquisition — acts as a structural brake on speculative flipping in the European market. It constrains short-term supply, which historically supported RIPE pricing, but the effect appears to be fading as the overall market softens. Buyers acquiring RIPE space should factor the holding period into any resale or portfolio rotation plan; this is effectively a two-year lockup on capital deployed.Deal Size Distribution
Q1 2024's deal-size profile skewed dramatically small. Of 147 transactions, 122 (83%) fell under $50K, accounting for just $1.9M of the quarter's $8.5M total value. The 16 deals in the $50K–$250K band contributed $1.7M, while 8 transactions between $250K and $1M generated $3.5M — the largest single value bucket. One deal exceeded $1M at roughly $1.09M. Average deal size collapsed to about 1,686 IPs from approximately 4,300 in Q4 and over 8,400 in Q1 2023, a trend that reflects the retail-ification of the market as large block inventory thins and institutional buyers pull back.Top Trading Countries
Country-level transaction data was not captured for Q1 2024. Based on RIR distribution — ARIN at 45.6% of volume, RIPE at 30.6%, APNIC at 23.1% — the US, Germany, the UK, and the Netherlands likely remained the most active jurisdictions, consistent with prior quarters. We expect to have granular country data in future reports as tracking improves.BEAD Broadband Program Impact
The US Broadband Equity, Access, and Deployment (BEAD) program, with approximately $42.45 billion allocated across all states and territories, is moving from planning into subgrantee selection in 2024. As rural ISPs and fixed wireless operators begin building out subsidized networks, they will need routable IPv4 space — typically /22 to /20 blocks — creating a potential demand wave for mid-size allocations later this year and into 2025. This could tighten supply in exactly the block-size segment where Q1 activity was weakest, providing a modest counterweight to the broader price decline.Hyperscaler IPv4 Holdings
Amazon, Microsoft, and Google collectively hold millions of IPv4 addresses — Amazon alone controls an estimated 100M+ through acquisitions and legacy allocations. These stockpiles mean hyperscalers rarely need to transact on the open market, which removes what would otherwise be the most price-insensitive buyer class. Any future decision by a hyperscaler to divest unused blocks could flood the market with supply; conversely, their ongoing retention of that space keeps it off the market and supports scarcity pricing for everyone else.Macroeconomic Conditions & Market Impact
Higher interest rates through Q1 2024 continued to pressure enterprise IT budgets and raise the cost of capital for infrastructure investments, including IPv4 purchases. Rate-sensitive buyers — particularly smaller ISPs carrying floating-rate debt — are more inclined to lease than buy, which partially explains the shift toward smaller deal sizes. If the Fed begins cutting in the second half of 2024 as markets expect, the resulting easing in capital costs could stabilize or modestly lift IPv4 transaction volumes, though prices have their own supply-driven gravity to contend with.Model Update & Calibration
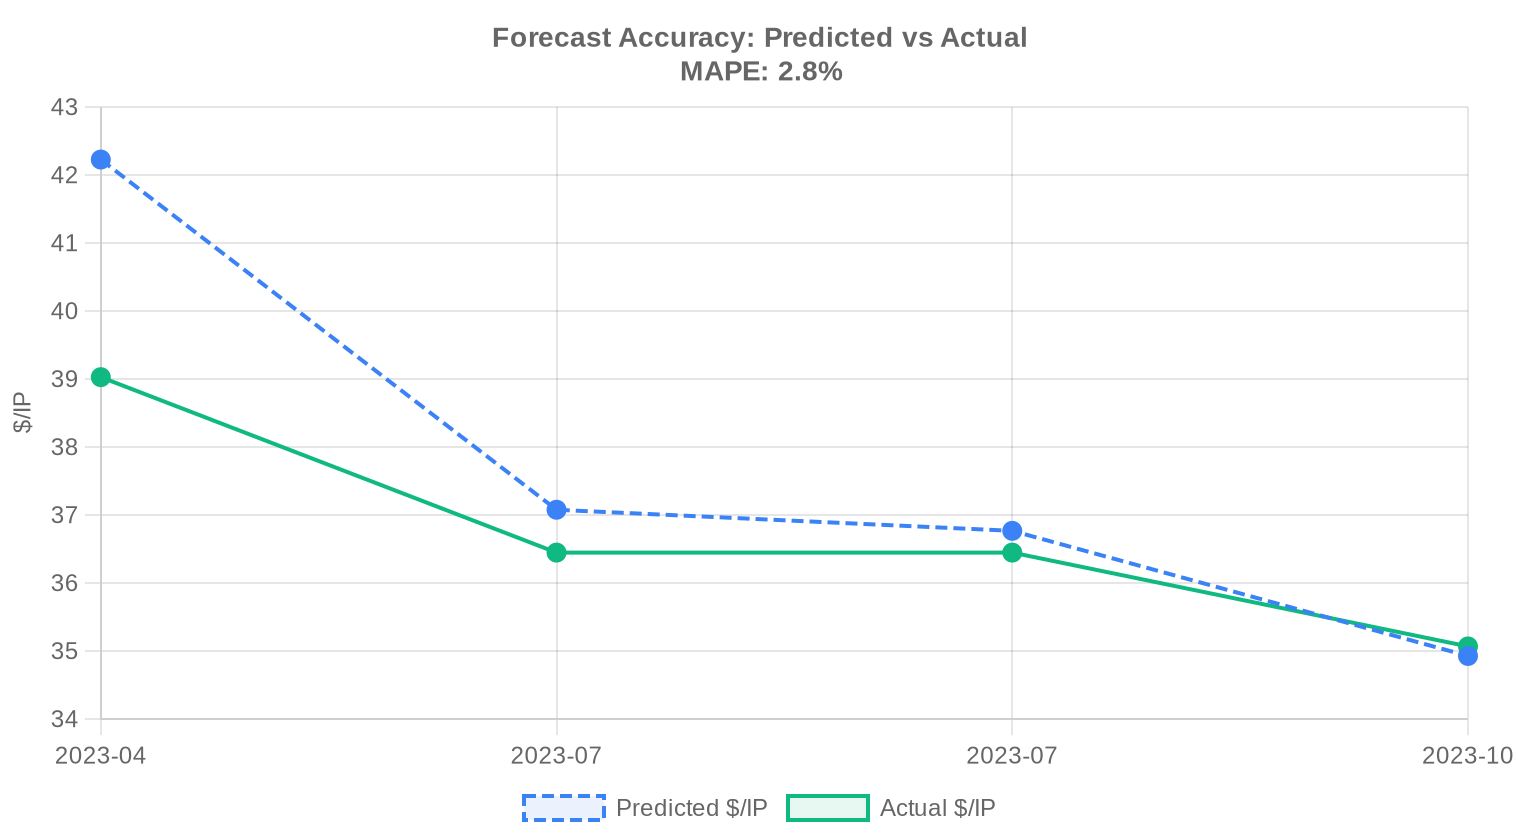
As part of our continuous improvement process, we backtested previous forecasts against realised prices and fine-tuned the model accordingly. Recent months now carry more influence than older data, and the confidence bands have been widened or narrowed based on how well they captured actual outcomes in the past. You can see the full backtest results in the table and chart below.
| Report Period | Target Month | Predicted | Actual | Deviation |
|---|---|---|---|---|
| 2023-Q1 | 2023-04 | $42 | $39 | +8% |
| 2023-H1 | 2023-07 | $37 | $36 | +2% |
| 2023-Q2 | 2023-07 | $37 | $36 | +1% |
| 2023-Q3 | 2023-10 | $35 | $35 | 0% |
Methodology
Figures are based on completed IPv4Center marketplace transactions and RIR transfer statistics. Prices are in US dollars per IP address. Forecasts are produced by an AI model that analyses each block-size band and RIR segment separately (with outlier-trimmed medians) alongside known market catalysts; they are estimates, not guarantees.
Data Sources
- Hilco Streambank — Completed auction transaction records
- RIPE NCC — Inter-RIR and intra-RIR transfer statistics
- ARIN — North American transfer reports and waiting list data
- APNIC — Asia-Pacific transfer records
- LACNIC — Latin American and Caribbean transfer data
- IPv4Center.com — Proprietary marketplace transaction and lease pricing data
This report is generated automatically for informational purposes only and does not constitute financial advice.
Frequently Asked Questions
What was the average price per IPv4 address in Q1 2024?
The market-wide weighted average landed at .28 per address, with a median of . The spread between the two suggests a modest right-tail skew driven by a handful of premium-priced blocks.
How many IPv4 transfer transactions were recorded in Q1 2024?
We tracked 147 priced transactions covering 247,808 addresses for an aggregate market value of roughly .5 million. An additional 2,928 administrative transfers were logged across all RIRs, the vast majority through RIPE (63.7%) and ARIN (36.3%).
Why does ARIN command the highest per-IP prices at .44 when RIPE and APNIC trade cheaper?
ARIN blocks carry a structural premium — cleaner WHOIS provenance, deeper U.S. enterprise demand, and a transfer policy that, while maturing, still imposes friction that constrains supply. RIPE averaged .81 and APNIC .07, roughly 10-12% below ARIN. Buyers who can tolerate non-ARIN space are effectively getting a discount.
What was the price range observed across all transactions in Q1 2024?
The floor was per IP (a RIPE block) and the ceiling was .12 (an APNIC block). That spread — nearly 85% of the minimum — underscores how much block size, RIR, and counterparty urgency still matter in price discovery.
Which block size dominated the market this quarter?
/24 blocks accounted for 70 of 147 transactions — roughly 48% of deal count. This is consistent with persistent demand from small-to-midsize operators and email-reputation buyers who need just 256 addresses.
Is the IPv4 market trending up or down as of Q1 2024?
Down, modestly. Our composite trend indicator shows a -0.25% quarter-over-quarter decline. The forecast model — which we rate as reliable — projects a year-end 2024 average of .92, implying further compression of roughly 7% from Q1 levels.
What mistakes do buyers commonly make when purchasing IPv4 blocks at current prices?
Three recurring errors: (1) overpaying for /24s when comparable blocks trade -5 cheaper across RIRs; (2) neglecting to verify blacklist and abuse-history status before closing; and (3) failing to factor in transfer-processing time — ARIN transfers routinely take 4-8 weeks, which can blow up deployment timelines.
Should I buy or lease IPv4 addresses at Q1 2024 rates?
Buy, if your time horizon exceeds 4.7 years. At a purchase price of .28 per IP versus a lease rate of .59/month per IP, the breakeven sits at roughly 57 months. Below that threshold, leasing preserves optionality — particularly relevant if you believe IPv6 adoption will accelerate within five years.
What is the current monthly lease rate for a /24 block?
Based on a sample of 44 lease transactions (predominantly RIPE), the going rate is approximately 0 per month for a /24, or .5859 per IP per month. Annualized, that's .03 per IP — implying a gross yield of 21.1% on a purchased block, which is eye-catching for a depreciating-but-not-yet-depleted asset.
What are the risks of buying IPv4 addresses in a declining-price environment?
The obvious risk is capital impairment: our model forecasts .92 by December 2024, which would represent a ~7% unrealized loss on a Q1 purchase at .28. Less obvious is counterparty risk — in a softening market, smaller brokers may face liquidity pressure, and sellers sometimes attempt to back out of agreed terms when they see prices slip.
How does the APNIC market compare to ARIN and RIPE in Q1 2024?
APNIC recorded 34 transactions totaling 56,320 IPs at an average of .07 — the cheapest RIR average this quarter. Interestingly, APNIC also posted the single highest per-IP price at .12, likely a small clean block sold under time pressure. The region remains the most price-heterogeneous of the three major RIRs.
Were there any large-block transactions above million in Q1 2024?
Exactly one, valued at approximately .09 million. The >M bracket is thin but punches above its weight: that single deal represented 12.8% of total market value. The 0K-M band was more active with 8 deals totaling .54 million — the largest value segment this quarter.
What was the average deal size in dollar terms?
The average transaction covered roughly 1,686 addresses with a dollar value of about ,021. However, 122 of 147 deals (83%) fell under ,000, so the average is heavily distorted by a small number of six- and seven-figure trades.
Is LACNIC or AFRINIC a viable source of IPv4 supply?
Barely. LACNIC contributed a single transaction — a /21 block at per IP — and AFRINIC recorded zero priced transactions in Q1 2024. Neither region has the policy infrastructure, transfer velocity, or broker ecosystem to function as a reliable procurement channel for institutional buyers.
What risks are associated with purchasing APNIC-region blocks for use outside Asia-Pacific?
Geo-routing mismatch is the primary concern. Major CDNs and ad networks geo-locate IPs by RIR registration, so an APNIC block announced from a North American POP may trigger fraud filters, degrade ad-fill rates, or produce latency anomalies. Re-registration via inter-RIR transfer is possible but adds weeks and fees.
How significant is RIPE's share of administrative transfers?
Dominant. RIPE accounted for 1,842 of 2,928 total transfers logged in Q1 2024 — a 63.7% share. Many of these are intra-group or policy-driven transfers rather than arm's-length sales, but the volume signals a deep and liquid European secondary market.
What does the Q1 2024 data say about the impact of IPv6 on IPv4 demand?
Not much relief yet. 147 priced transactions and nearly .5 million in aggregate value suggest sustained commercial demand. Prices are softening, but the decline is gentle (-0.25% QoQ) — consistent with IPv6 adoption nibbling at the margin rather than cratering the market. At the current trajectory, IPv4 retains meaningful economic value well into the second half of the decade.
What is the projected year-end 2024 price for IPv4 addresses?
Our model forecasts an average of .92 by December 2024, down from .28 in Q1. The near-term waypoint is .57 for the next observable month. We classify this forecast as reliable based on transaction volume and data density, though exogenous supply shocks — such as a large carrier liquidating legacy space — could accelerate the decline.
Why did March 2024 record the highest transfer volume of the quarter?
March was the peak month with the bulk of the quarter's 12,117 cumulative transfers concentrated there. End-of-quarter budget cycles and fiscal-year close activity in APNIC jurisdictions likely contributed. RIPE and ARIN collectively accounted for 100% of these administrative transfers.
What mistakes should be avoided when leasing IPv4 space at current rates?
First, avoid locking into long-term leases above .60/IP/month — that's already at the top of the current range and prices are trending down. Second, insist on contractual clean-IP guarantees; a blacklisted /24 is worthless for mail or ad-tech. Third, don't ignore the breakeven math: at current rates, any lease beyond 57 months costs more than buying outright.
How does the 21.1% annualized yield on leased IPv4 compare to other alternative assets?
It's unusually high — comparable to distressed-debt or venture-like returns — but comes with a depreciating-asset caveat. If market prices decline to .92 by year-end as forecast, your net yield after mark-to-market erosion drops to roughly 14%. Still attractive, but not the risk-free annuity it appears at first glance.
Are sub-K transactions a sign of market fragmentation or healthy liquidity?
Both. The 122 deals under K (83% of transaction count but only 22% of total value) reflect broad retail-tier participation — hosting companies, VPN operators, email senders — which is a sign of healthy liquidity. But the value concentration in just 9 deals above 0K reveals a bifurcated market where institutional and retail participants are effectively trading in different arenas.
What should a first-time buyer know about the transfer process in Q1 2024?
Each RIR has its own transfer policy, approval timeline, and documentation requirements. ARIN requires a demonstrated-need justification; RIPE does not. Expect 2-6 weeks for approval depending on the registry. Budget for broker fees (typically 5-10% of transaction value) and ensure your upstream provider will route the block before you close.
Is there any risk that IPv4 prices collapse suddenly rather than declining gradually?
A sudden collapse is unlikely but not impossible. The scenario would require either a massive block release — say, a Tier-1 carrier dumping millions of addresses — or a policy breakthrough that dramatically accelerates IPv6 transition. Neither is on the horizon in Q1 2024. The more probable path is continued gradual erosion, per our -0.25% quarterly trend.
How does the floor price in Q1 2024 compare to the cost of deploying IPv6 instead?
A fully loaded IPv6 migration for a mid-size enterprise — dual-stack infrastructure, application testing, staff training — typically runs ,000-0,000 depending on complexity. At per IP, a /22 block (1,024 addresses) costs roughly ,648. For organizations that simply need routable space, IPv4 remains the cheaper short-term option. The calculus flips at scale or over multi-year horizons.